Ames Laboratory Publications
Ames Laboratory
2012
Magnetic and structural transitions in the
iron-chalcogenide high-Tc superconductor:
K0.8Fe1.76Se2.00
W. N. Rowan-Weetaluktuk
McGill University
D. H. Ryan
McGill University
J. M. Cadogan
University of Manitoba
R. Hu
Iowa State University
Sergey L. Bud'ko
Iowa State University, [email protected]
See next page for additional authors
Follow this and additional works at:
http://lib.dr.iastate.edu/ameslab_pubs
Part of the
Condensed Matter Physics Commons
The complete bibliographic information for this item can be found at
http://lib.dr.iastate.edu/
ameslab_pubs/218
. For information on how to cite this item, please visit
http://lib.dr.iastate.edu/
howtocite.html
.
Magnetic and structural transitions in the iron-chalcogenide high-Tc
superconductor: K0.8Fe1.76Se2.00
Abstract
57Fe Mössbauer spectroscopy was used to study single-crystals of K
0.8Fe1.76Se2.00from 6 K to 673 K. At 6 K,
the hyperfine field (Bhf) is canted away from thec-axis by 18 ± 3°. The temperature dependence ofBhf
follows a spin wavemodel with a spin excitation gap of 9 ± 1 meV. A sudden increase in the linewidth and a corresponding drop in (1/2)eQVzz atTN= 532 K are indications of strong coupling between the magnetic
and structural transitions.
Keywords
Physics and Astronomy, Single crystals, Iron, Magmatic magnetic minerals, Superconducting transitions, Paramagnetism
Disciplines
Condensed Matter Physics
Comments
The following article appeared inJournal of Applied Physics111 (2012): 07E126 and may be found at
http://dx.doi.org/10.1063/1.3673848.
Rights
Copyright 2012 American Institute of Physics. This article may be downloaded for personal use only. Any other use requires prior permission of the author and the American Institute of Physics.
Authors
W. N. Rowan-Weetaluktuk, D. H. Ryan, J. M. Cadogan, R. Hu, Sergey L. Bud'ko, and Paul C. Canfield
Magnetic and structural transitions in the iron-chalcogenide high-Tc superconductor:
K0.8Fe1.76Se2.00
W. N. Rowan-Weetaluktuk, D. H. Ryan, J. M. Cadogan, R. Hu, S. L. Bud’ko, and P. C. Canfield
Citation: Journal of Applied Physics 111, 07E126 (2012); doi: 10.1063/1.3673848
View online: http://dx.doi.org/10.1063/1.3673848
View Table of Contents: http://scitation.aip.org/content/aip/journal/jap/111/7?ver=pdfcov
Published by the AIP Publishing
Articles you may be interested in
A study of spin canting in Li3Fe2(PO4)3 with Mössbauer spectroscopy under 5T
J. Appl. Phys. 115, 17E126 (2014); 10.1063/1.4864747
Anisotropic transport property anomaly in K0.8Fe1.65Se2 crystal
J. Appl. Phys. 115, 143905 (2014); 10.1063/1.4871456
Evidence for multiple nodeless gaps and electron-mode coupling from scanning tunneling spectroscopy in the iron-based superconductor Ba0.6K0.4Fe2As2
AIP Conf. Proc. 1447, 12 (2012); 10.1063/1.4709862
Unravelling the effect of interparticle interactions and surface spin canting in -Fe2O3@SiO2 superparamagnetic nanoparticles
J. Appl. Phys. 109, 114319 (2011); 10.1063/1.3583652
Spin collinearity and thermal disorder in - Fe 2 O 3
J. Appl. Phys. 98, 053901 (2005); 10.1063/1.2034653
Magnetic and structural transitions in the iron-chalcogenide high-
T
csuperconductor: K
0.8Fe
1.76Se
2.00W. N. Rowan-Weetaluktuk,1D. H. Ryan,1,a)J. M. Cadogan,2R. Hu,3S. L. Bud’ko,3 and P. C. Canfield3
1
Physics Department and Centre for the Physics of Materials, McGill University, 3600 University Street, Montreal, Quebec, H3A 2T8, Canada
2
Department of Physics and Astronomy, University of Manitoba, Winnipeg, Manitoba, R3T 2N2, Canada 3
Ames Laboratory, U.S. DOE and Department of Physics and Astronomy, Iowa State University, Ames, Iowa 50011, USA
(Presented 3 November 2011; received 21 September 2011; accepted 1 November 2011; published online 29 February 2012)
57Fe Mo¨ssbauer spectroscopy was used to study single-crystals of K
0.8Fe1.76Se2.00 from 6 K to 673 K. At 6 K, the hyperfine field (Bhf) is canted away from thec-axis by 1863. The temperature dependence ofBhffollows a spin wave model with a spin excitation gap of 961 meV. A sudden increase in the linewidth and a corresponding drop inð1=2ÞeQVzzatTN¼532 K are indications of
strong coupling between the magnetic and structural transitions.VC 2012 American Institute of
Physics. [doi:10.1063/1.3673848]
I. INTRODUCTION
The iron chalcogenide K0.8Fe1.8Se2 is superconducting up to Tsc¼30 K (Ref. 1) and antiferromagnetic up to
TN559 K. 2,3
Neutron diffraction suggested that the 3.3lB
iron moments are oriented parallel to the c-axis,2 while single-crystal Mo¨ssbauer data demonstrated a slight canting of the moments away from thec-axis.3Single-crystal x-ray diffraction showed that superconducting KyFe2xSe2adopts anI4/mstructure belowTN, with a (
ffiffiffi
5
p
pffiffiffi51) iron va-cancy ordering and that iron atoms fully occupy the 16i site.4 The collapse of the magnetism is associated with the loss of this vacancy ordering at a first orderI4/m!I4/mmm magne-tostructural transition.2,3
Single-crystal Mo¨ssbauer studies of AyFe2xSe2(A¼K, Rb)3,5,6 all show a clear asymmetry in the intensity of the absorption peaks and a failure to account for this may lie behind the disagreement on the ordering direction with angles of 0,218,3and 4045(Ref.7) between the moments and thec-axis all being proposed. Liet al.5have also claimed that the temperature dependence of the hyperfine field [Bhf(T)] exhibits evidence for a spin excitation gap (SEG) and that there is a drop in absorption associated with the supercon-ducting transition. All of these issues are addressed here by analyzing the single-crystal Mo¨ssbauer spectra using a full Hamiltonian solution to the spectral shape.
II. EXPERIMENTAL METHODS
Single-crystals of K0.80Fe1.76Se2.00 were grown and characterized as previously described.8 The crystals were cleaved and mounted into spectrometers with the c beam aligned along thec-axis of the crystal mosaic.3The Mo¨ssba-uer spectra were collected using 50 mCi57CoRhsources and electromechanical drives using both constant acceleration
and sine modes in conventional spectrometers. Calibration was done using ana-Fe foil as a reference. Two closed-cycle He refrigerators were used in addition to a furnace for the high temperature data. One sample was cycled through the Ne´el temperature twice and another was cycled three times, spending over a week above 550 K. Contrary to reports by Nowik et al.,7we observed no degradation of the samples below 673 K and the I4/m ! I4/mmm structural transition appeared to be reversible.
The Mo¨ssbauer spectra were fitted using a nonlinear least squares minimization routine for 57Fe single-crystal spectra employing the general static Mo¨ssbauer solution9 using a full Hamiltonian code.
III. RESULTS
The Mo¨ssbauer spectrum at 6 K (Fig.1) was fitted using two components. The magnetic sextet, accounts for 8661% of the spectrum and a paramagnetic impurity, the doublet, represents 1461% of the spectrum. The deviation of the magnetic peak intensities from the 3:2:1:1:2:3 ratio and the paramagnetic peaks from the 1:1 ratio, is due to the use of ori-ented single-crystals as opposed to powder samples. The magnetic component has a clear asymmetry between the lines that correspond to the sameDmI. This can best be seen
in lines 2 and 5, where line 2 is more intense than line 5. This is an indication of a nonzero asymmetry parameter (g). At 6 K Bhf¼28.360.1 T, ð1=2ÞeQVzz¼1.360.1 mm/s, g¼0.1160.09 and the angle, h, between Vzz and Bhf,¼4561. For the paramagnetic component, we find that
Vzzis parallel to thec-beam. These results are all consistent
with values obtained for Rb0.8Fe1.6Se2.0.6
The near vanishing of lines 2 and 5 indicates that the c-beam andBhfare nearly, but not quite, fully aligned, as has been previously reported.3,5,6This contradicts the claim by Nowiket al.7that the iron moments in A0.8Fe2ySe2(A¼K,
a)Electronic mail: [email protected].
Rb and K/Tl) are tilted by 4045 away from thec-axis. A conclusion arrived at by using powders and assuming that
Vzzpoints along the c-axis. However, the low point
symme-try of the 16i site (1) allowsVzzto make an arbitrary angle
with thec-axis. Using single-crystals, unlike powders, per-mits the direct measurement of the 1863 angle between thec-beam and Bhf. This angle comes from three independ-ent mosaics run on differindepend-ent spectrometers and exceeds any possible misalignment. While we cannot distinguish between uniaxial canting and some form of conical spin arrangement, there is definitely a small canting ofBhf, and hence the iron moments, away from thec-axis. This same canting has now been seen in both the potassium3and rubidium6compounds and suggests that the neutron diffraction results2,10 need to be re-evaluated.
The low temperature dependence of the hyperfine field is shown in Fig.2. AT3/2spin wave model shown by the dot-ted line in Fig.2fails to reproduce adequatelyBhf(T) so we included a spin excitation gap:
BhfðTÞ ¼Bhfð0Þ 1CT3=2
X1
k¼1
eDE=kBT k3=2
!
; (1)
where Bhf(0) is the hyperfine field at 0 K, C is the spin stiffness constant, DE is the energy of the SEG and kB is
Boltzmann’s constant.11A previous study claimed a gap of
5 meV;5here the gap was found to be 961 meV with a spin stiffness constant of 1861106K3/2. The summa-tion was limited to the first 19 terms of the series. The differ-ence between the infinite series and our limited summation is less than 0.001%.
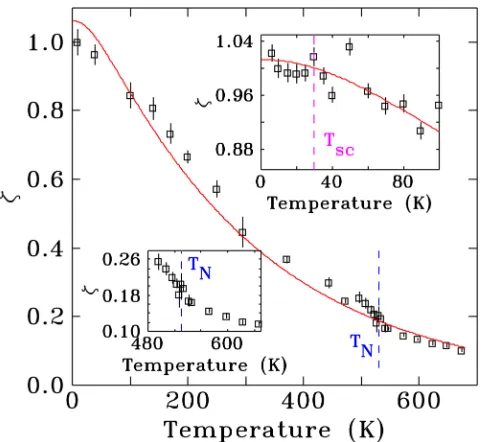
The integrated spectral area,f,is shown in Fig.3.fs for different samples in different spectrometers have been com-bined by scaling data taken at a common temperature in order to cover the full temperature range of the experiments. Li et al.5 claimed a 10% drop in f associated with the superconducting transition and a similar one below the
transition. No such drops were observed here, as can be seen in the inset of Fig.3. Since there is no structural transition or other behavior causing lattice softening associated with the superconducting transition, no drop infis expected. Fitting of f(T) to a Debye-Waller model between 6 and 673 K (Fig.3), yieldshDof 19562 K, typical for an intermetallic.
The development of a soft phonon mode near the
I4/m! I4/mmm structural transition could lead to a reduc-tion in the f-factor.12 However, no drop in absorption was observed. The small break near TN in Fig. 3 is consistent
with a fitting artifact (there are rapid changes in both the spectral form and linewidth nearTN) and would be followed
by a recovery if it were indeed due to a soft mode.
FIG. 1. (Color online) Mo¨ssbauer spectrum at 6 K of K0.80Fe1.76Se2.00. The
spectrum was fitted using a full Hamiltonian code. The blue sextet is the magnetic component, the red doublet is an impurity and the solid green line through the data is the sum of the two components. Lines 2 and 5 of the magnetic sextet are marked.
FIG. 2. (Color online) The hyperfine field (Bhf) of the antiferromagnetic
subspectrum of K0.80Fe1.76Se2.00.Bhf(T) was fitted using aT3/2law (dotted
red line), and aT3/2law with a SEG (solid green line) up to 200 K. The SEG was found to be 961 meV. The inset showsBhf(T) close to the
supercon-ducting transition (Tsc), marked as the dashed magenta line.
FIG. 3. (Color online) The integrated spectral area,f, fitted using a Debye-Waller model givinghD¼19562 K. The insets showf: (top right) near the superconducting transition, the magenta line, and (bottom left) the magnetic transition, the blue line.
07E126-2 Rowan-Weetaluktuket al. J. Appl. Phys.111, 07E126 (2012)
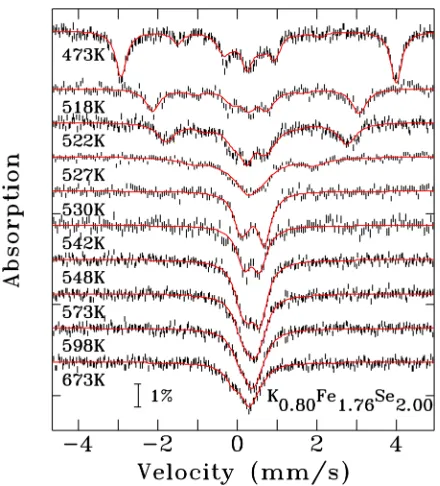
[image:5.612.322.555.60.264.2] [image:5.612.59.293.62.247.2] [image:5.612.319.560.498.719.2]The high temperature Mo¨ssbauer spectra are shown in Fig. 4. The magnetic transition is obvious from the col-lapse of the outer (magnetic) peaks, accompanied by the growth of a paramagnetic doublet. As we heat through TN
there is a marked reduction in ð1=2ÞeQVzz (Fig. 5), the new paramagnetic component starts to appear at least 10 K
below TNand the transformation inð1=2ÞeQVzzis not com-plete until 10 Kabove TN(upper inset to Fig. 5). The
line-width,C, increases dramatically and then recovers (lower inset to Fig.5). These changes indicate that the structural transition from I4/m to I4/mmm is closely linked to the magnetic transition. It startsbefore the magnetism
collap-ses and likely caucollap-ses the collapse. The increase in line-width suggests a rapid increase in disorder at the iron site, while the reduction in ð1=2ÞeQVzz is consistent with an increase in symmetry associated with the structural transi-tion. Although neutron diffraction data have been inter-preted as showing a gap of 20 K between the TN and TS,2,10 the results in Fig.5demonstrate that the first stages
of the I4/m! I4/mmm transition start well below TN and
continue after the magnetic order is lost. The two transi-tions are essentially coincident and the changes in crystal structure drive the loss of magnetic order.
IV. CONCLUSIONS
The iron moments in K0.80Fe1.76Se2.00are canted away from the c-axis by 1863 below TN. Below200 K, Bhf follows a gapped spin wave model with a SEG of 9(1) meV. Material degradation is not an intrinsic property of the
I4/m ! I4/mmm transition, rather it stems from reactions with mounting materials or contaminated vacuum. The
I4/m !I4/mmm structural transition is coincident with the loss of antiferromagnetic order and likely plays a causal role in the loss of magnetic ordering.
ACKNOWLEDGMENTS
This work was supported by grants from the Natural Sci-ences and Engineering Research Council of Canada, and Fonds Que´be´cois de la Recherche sur la Nature et les Tech-nologies. JMC is supported by the Canada Research Chairs program. R.H. and P.C.C. are supported by AFOSR-MURI Grant No. FA9550-09-1-0603. S.L.B. and P.C.C. are also supported by the U.S. DOE BES DMSE. Ames Laboratory is operated for the U.S. DOE by ISU under Contract No. DE-AC02-07CH11358. We are grateful to G. Wortmann (Max-Planck Institute for Chemistry) for suggesting to us that the asymmetry in the magnetic spectra was the result of a nonax-ially symmetric quadrupole interaction (g=0).
1J. Guo, S. Jin, G. Wang, S. Wang, K. Zhu, T. Zhou, M. He, and X. Chen,
Phys. Rev. B82, 180520 (2010).
2
B. Wei, H. Qing-Zhen, C. Gen-Fu, M. A. Green, W. Du-Ming, H. Jun-Bao, and Q. Yi-Ming,Chin. Phys. Lett.28, 086104 (2011).
3D. H. Ryan, W. N. Rowan-Weetaluktuk, J. M. Cadogan, R. Hu, W. E.
Straszheim, S. L. Bud’ko, and P. C. Canfield, Phys. Rev. B83, 104526 (2011).
4
P. Zavalijet al.,Phys. Rev. B83, 132509 (2011).
5Z. Li, X. Ma, H. Pang, and F. Li, arXiv:1103.0098v1 (2011). 6
V. Ksenofontov, G. Wortmann, S. Medvedev, V. Tsurkan, J. Deisenhofer, A. Loidl, and C. Felser,Phys. Rev. B84, 180508 (2011).
7
I. Nowik, I. Felner, M. Zhang, A. F. Wang, and X. H. Chen,Supercond. Sci. Technol.24, 095015 (2011).
8R. Hu, K. Cho, H. Kim, H. Hodovanets, W. E. Straszheim, M. A. Tanatar,
R. Prozorov, S. L. Bud’ko, and P. C. Canfield,Supercond. Sci. Technol.
24, 065006 (2011).
9C. J. Voyer and D. H. Ryan,Hyperfine Interac.170, 91 (2006). 10
F. Ye, S. Chi, W. Bao, X. F. Wang, J. J. Ying, X. H. Chen, H. D. Wange, C. H. Dong, and M. Fang,Phys. Rev. Lett.107, 137003 (2011).
11
V. Senz, R. Ro¨hlsberger, J. Bansmann, O. Leupold, and K.-H. Meiwes-Broer,New J. Phys.5, 47 (2003).
12
W. N. Rowan-Weetaluktuk, D. H. Ryan, A. O. Sushkov, S. Eckel, S. K. Lamoreaux, O. P. Sushkov, J. M. Cadogan, M. Yethiraj, and A. J. Studer,
Hyperfine Interac.198, 1 (2010). FIG. 4. (Color online) Mo¨ssbauer spectra of K0.80Fe1.76Se2.00. The fits to the
spectra, made using a full Hamiltonian solution, are shown as solid red lines.
FIG. 5. (Color online)ð1=2ÞeQVzzof K0.80Fe1.76Se2.00determined from the
Mo¨ssbauer spectra shown in Fig.4. The lower inset shows the spectral line-width (C) while the upper inset shows the fractional areas of the magnetic (blueh) and paramagnetic (green*) components. The Ne´el temperature, TN¼53262 K, is marked by the dashed blue line.
[image:6.612.65.285.60.303.2] [image:6.612.65.285.502.710.2]