https://doi.org/10.5194/bg-15-3577-2018 © Author(s) 2018. This work is distributed under the Creative Commons Attribution 4.0 License.
Effect of wind speed on the size distribution of gel particles in the sea
surface microlayer: insights from a wind–wave channel experiment
Cui-Ci Sun1,2,3, Martin Sperling1, and Anja Engel1
1GEOMAR Helmholtz Centre for Ocean Research Kiel, 24105 Kiel, Germany
2State Key Laboratory of Tropical Oceanography, South China Sea Institute of Oceanology, Chinese Academy of Sciences,
510301, Guangzhou, China
3Daya Bay Marine Biology Research Station, Chinese Academy of Sciences, 518000, Shenzhen, China
Correspondence:Anja Engel ([email protected])
Received: 11 October 2017 – Discussion started: 23 October 2017
Revised: 22 May 2018 – Accepted: 29 May 2018 – Published: 15 June 2018
Abstract.Gel particles, such as transparent exopolymer par-ticles (TEP) and Coomassie stainable parpar-ticles (CSP), are important organic components in the sea surface microlayer (SML). Here, we present results on the effect of differ-ent wind speeds on the accumulation and size distribution of TEP and CSP during a wind wave channel experiment in the Aeolotron. Total areas of TEP (TEPSML) and CSP
(CSPSML) in the surface microlayer were exponentially
re-lated to wind speed. At wind speeds<6 m s−1, accumulation of TEPSMLand CSPSMLoccurred, decreasing at wind speeds
of >8 m s−1. Wind speeds >8 m s−1 also significantly al-tered the size distribution of TEPSML in the 2–16 µm size
range towards smaller sizes. The response of the CSPSML
size distribution to wind speed varied through time depend-ing on the biogenic source of gels. Wind speeds >8 m s−1 decreased the slope of CSPSMLsize distribution significantly
in the absence of autotrophic growth. For the slopes of TEP and CSP size distribution in the bulk water, no significant difference was observed between high and low wind speeds. Changes in spectral slopes between high and low wind speed were higher for TEPSMLthan for CSPSML, indicating that the
impact of wind speed on size distribution of gel particles in the SML may be more pronounced for TEP than for CSP, and that CSPSML are less prone to aggregation during the
low wind speeds. Addition of an E. huxleyiculture resulted in a higher contribution of submicron gels (0.4–1 µm) in the SML at higher wind speed (>6 m s−1), indicating that
phy-toplankton growth may potentially support the emission of submicron gels with sea spray aerosol.
1 Introduction
inter-mediate winds (Calleja et al., 2009; Mesarchaki et al., 2015; Wurl et al., 2016; Engel and Galgani, 2016).
Particle-size distribution (PSD) is a trait description of gel particles that relates to many important processes. It has been demonstrated that marine heterotrophs feed on gel particles within specific size ranges (Mari and Kiorboe, 1996). Bac-terial colonization of TEP varies as a function of size (Mari and Kiorboe, 1996; Passow, 2002). Thus, changes in size dis-tribution of gel particles will likely alter food-web structure and dynamics in the ocean and SML.
Gel PSD and its variation with biogeochemical and physi-cal processes generally reflect the information about coagula-tion, breakup and dissolution as well as on sources and sinks of gel particles, either moving upward into or sinking out of the SML. In addition, the abundance and size of gels in the SML and in subsurface waters may determine their potential fate as CCN in the atmosphere (Orellana et al., 2011).
Wind was determined as a principal force that controls accumulation of particulate material in the SML and as the most important variable controlling the air–sea exchange of gas and particles (Liu and Dickhut, 1998; UNESCO, 1985; Frew et al., 2004). The SML is expected to disrupt at higher wind speed, but the threshold wind speed for organic matter enrichment in general, and for specific components in par-ticular, is largely unknown (Liss, 2005). Natural slicks often occur at low wind speeds (<6 m s−1) typically having wider area coverage for a longer time in coastal seas compared to the open ocean (Romano, 1996). Using different SML sam-pling methods, such as a Teflon plate, glass plate and Garret screen (Garrett and Duce, 1980), direct relationships between wind speed and SML thickness have been determined. How-ever, the influence of wind on SML thickness is not clear; Liu and Dickhut (1998) observed a decrease with a wind speed of up to 5 m s−1, while Falkowska (1999) determined an in-crease up to a wind speed of 8 m s−1, beyond which the thick-ness of the SML began to decrease.
TEP enrichment in the SML has been described as in-versely related to wind speed greater than 5–6 m s−1 (Wurl et al., 2009, 2011; Engel and Galgani, 2016). One explana-tion for this is that at higher wind speed, aggregaexplana-tion of solid particles with TEP results in aggregates becoming negatively buoyant and sinking out of the SML. For proteinaceous gels, Engel and Galgani (2016) observed that their enrichment was not inversely related to wind speed. However, an inverse rela-tionship between the slope of the CSP size distribution in the SML and wind speed was observed, indicating larger CSP in the SML at low wind speed. In addition, the dynamics of gel particles in the SML were also affected by other mechanisms that depend on the wind and wave conditions. It is proposed that gel particle formation within the SML is supported by bubble scavenging of dissolved organic matter (DOM) in the upper water column (Wurl et al., 2011) because more TEP precursors are lifted up the water column. Moreover, com-pression and dilatation of the SML due to capillary waves
may increase the rate of polymer collision, subsequently fa-cilitating gel aggregation (Carlson, 1983).
Wurl et al. (2011) provided a conceptual model for the pro-duction and fate of TEP in surface waters and the underlying controlling mechanisms. However, due to the lack of obser-vational data, we do not understand how the size distribution of marine gel particles in the SML varies as a function of wind speed and wave action well. Knowledge of the charac-teristics of gel particles such as abundance, total area, and size distribution in the SML and how they relate to wind speed may improve our understanding of marine primary or-ganic aerosol emission–cloud feedback processes and may help to accurately estimate trace gas fluxes from the ocean to the atmosphere. Here, we assess the dynamics of size distri-bution of marine gel particles, i.e., TEP and CSP, in the SML in response to different wind speeds.
2 Methods
2.1 Experimental setup
Effects of different wind speeds on the size distribution of organic gel particles in the SML were studied during the Ae-olotron experiment from 3 to 28 November 2014. A total of 22 000 L of North Atlantic seawater was pumped and col-lected by the research vesselPoseidon, including∼14 000 L collected at 55 m of depth at 64◦4.900N, 8◦2.030E and
∼8000 L collected on 22 September 2014 at 5 m of depth near the island of Sylt in the German Bight, North Sea. The water was pumped into a clean (“food save”) road tanker and unloaded at the wind–wave facility Aeolotron the following day and stored in a dark and cool (∼10◦C) place until the start of the experiment. It took 41 days from sampling to start the experiment. The Aeolotron (Heidelberg, Germany) is a large-scale annular wind–wave facility with a total height of 2.4 m, and an outer diameter of 10 m. The wind speed inside the channel was measured using a Pitot tube and anemome-ter. A more detailed description of the facility is given by Nagel et al. (2015). The friction velocityU?was determined and converted into the valueU10 as described in
Maximil-ian Bopp and Bernd Jähne (unpublished, 2014), withU10
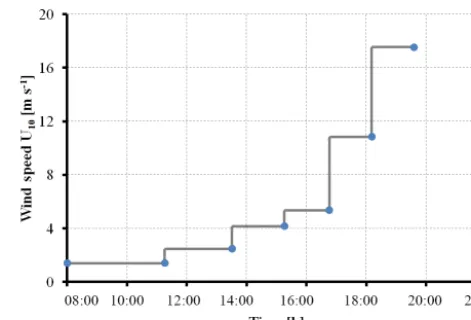
be-ing the equivalent wind speed at 10 m height above the ocean. The experiment started on 3 November (day 1). Seven ex-periments were conducted on days 2, 4, 9, 11, 15, 22 and 24, with a stepwise increase in wind speeds (U10), ranging
from 1.37 to 18.7 m s−1as shown in Table 1. At some
con-ditions, data of water velocity were absent; hence no val-ues forU10 could be obtained. On experimental days, wind
Table 1. Wind speed settings as applied during strategy I of the Aeolotron experiment; “NaN”: no values forU10.
Day Wind velocityU10(m s−1)
2 NaN NaN 3.98 5.38 11.1 17. 9 4 2.09 3.44 4.31 8.31 14.2 9 1.54 2.40 4.07 5.29 11.1 11 1.66 2.89 3.93 8.03 14.0 NaN 15 2.58 4.99 6.42 11.1 18.1 22 1.37 1.37 4.53 6.1 11.3 18.7 24 1.44 2.65 4.27 5.38 11.4 18.1
during the experiment and are described in more detail in the Supplement. On day 20, a seed culture ofEmiliania hux-leyi(cell density: 4.6×10⁵cell mL−1) was added, followed by a biogenic SML from a previous experiment on day 21. A pair of SML and bulk water samples was collected at the end of each wind condition except for days 2 and 4, when the bulk water was collected at the start (morning) and the end (evening) of the experiment. Developments of TEP and CSP in the SML and the bulk water in the course of the Ae-olotron study are shown in the Supplement (Fig. S1). Com-pared to the significant changes of gel particle tion with wind speed observed in the SML, gel concentra-tion changes with wind speed in the bulk water were much smaller. Thus, overall gel concentration in the bulk water was not sensitive to wind speed changes.
2.2 Sampling
SML samples were collected with a glass plate sampler, made of borosilicate glass with dimensions of 500 mm (length)×250 mm (width)×5 mm (thickness) and with an effective surface area of 2000 cm2(considering both sides). For each sample, the glass plate was inserted into the wa-ter perpendicular to the surface and withdrawn at a rate of
∼20 cm s−1. The sample, retained on the glass because of surface tension, was removed by a Teflon wiper. The water from all dips pooled into one sample. Sample volumes were 210–355 mL for the SML and 800–1000 mL for bulk water. Samples were collected into acid-cleaned (HCl, 10 %) and Milli-Q-washed glass bottles. Prior to sampling, both glass plate and wiper were rinsed with Milli-Q water and inten-sively rinsed with Aeolotron water in order to minimize their contamination with alien material. The first milliliters of the SML sample were used to rinse the bottles and then dis-carded. The bulk water was sampled from the outlet at the middle-lower part of the Aeolotron and collected into acid-cleaned (HCl, 10 %) and Milli-Q-washed glass bottles.
Figure 1.Schematic wind speed (U10) increase as applied during
strategy I for experiments conducted in the Aeolotron.
2.3 Analytical methods
Total area, particle numbers and equivalent spherical diame-ter (dp) of gel particles were determined by microscopy
fol-lowing Engel (2009). For TEP and CSP, 5 to 30 mL were gen-tly filtered (<150 mbar) onto 25 mm Nuclepore membrane filters (0.4 µm pore size, Whatman Ltd.), stained with 1 mL Alcian Blue solution for polysaccharide gels and 0.5 mL Coomassie Brilliant Blue G (CBBG) working solution for proteinaceous gels. The excessive dye was removed by rins-ing the filter with Milli-Q water. Blank filters for gel particles were prepared using Milli-Q water. Filters were transferred onto Cytoclear© slides and stored at −20◦C until micro-scopic analysis. Each treatment had two duplicates. For each filter, about 30 images were randomly taken at×200 mag-nification with a light microscope (Zeiss Axio Scope A.1). Image-analysis software (Image J, US National Institutes of Health) was used to analyze particle numbers and area. The total particle abundance and total area were determined from a minimum particle size of 0.4 µm equivalent spherical di-ameter (ESD). The submicron gel particles during this study covered a range of 0.4–1 µm.
The size-frequency distribution of TEP and CSP gels was described by
dN d dp
=kd
δ
p, (1)
where dNis the number of particles per unit water volume in the size rangedpto (dp+d(dp)) (Mari and Kiorboe, 1996).
from regressions of log[dN/d(dp)] versus log[dp] over the
size range 2–16 µm ESD.
On day 11, samples taken at a wind speed of 1.66 and 2.89 m s−1 were contaminated and therefore removed from data analysis and discussion.
2.4 Data analysis
Results from the SML samples were compared to those of bulk water and expressed as enrichment factors (EFs), de-fined as
EF=(C)SML/(C)Bulk, (2)
where(C) is the concentration of a given parameter in the SML or bulk water (GESAMP, 1995). Enrichment of a com-ponent is generally indicated by EF>1, depletion by EF<1. Considering the measurement uncertainty of gel particles us-ing the microscopic method within 10 %, EF values >1.1 thus represent significant enrichment of gel particles in the SML, while EF<0.9 is determined to be a depletion.
Nonparametric statistics (two-sample Kolmogorov– Smirnov test) was performed to compare differences of slope of gel particle size distribution between low and moderate wind speeds (<8 m s−1) and high wind speeds (>8 m s−1). In addition, statistical significance of changes with respect to the slope of gel particle size distribution after adding the seed culture ofE. huxleyiand the biogenic SML water from a previous experiment was determined with a two-sample Kolmogorov–Smirnov test on non-normalized anomalies given the data being normally distributed. Average values are given by the statistical mean and its standard deviation (SD). Statistical significance was ac-cepted for p <0.05. Calculations and statistical tests were conducted using Microsoft Office Excel 2010 and Origin 9.0 (OriginLab Corporation, USA) software.
3 Results
3.1 Biological variations during the Aeolotron experiment
Temporal changes in hetero- and autotrophic plankton and neuston abundance and in organic matter during the experi-ment will be described in more detail elsewhere (Engel et al., 2018) and are summarized here only briefly. Heterotrophic microorganisms dominated cell abundance and biomass in the tank during the whole study. Two peaks of bacterial abun-dance in the SML occurred on days 4 and 11. Primary pro-duction was low during the whole experiment. Chlorophylla (chl a) concentrations were not detectable until days 20– 21, i.e., after the addition of the E. huxleyiculture and the SML water from a previous phytoplankton bloom experi-ment. Chlaconcentration clearly increased after day 23.
3.2 TEP and CSP abundance and total area variations with respect to wind speeds
Before the onset of the wind experiments, the water surface was flat without visible surface movement. As the wind speed increased, the first capillary waves became visible and started breaking above aboutU10=6 m s−1 (e.g., U10=6.1 m s−1
on day 22). At this wind speed, abundance of TEPSML
de-creased, except for days 15 and 11, when abundance of TEPSMLremained relatively stable or even increased slightly
at high wind speed (Fig. 2). Similar to TEPSML, abundance
and total area of CSPSML decreased with increasing wind
speed, excluding days 11 and 2 (Fig. 3). Exponential declines of total area TEPSML and CSPSML with increasing wind
speed were observed, except for TEPSML area on days 11
and 15, and CSPSMLarea on day 15; a measure of the
good-ness of exponential fit is the coefficient of determination (COD), denoted asr2yieldingrCSP2 −Total area=0.73±0.20, n=6 andrTEP2 −Total area=0.87±0.19,n=5. In contrast to total area, only three out of seven observations for abun-dance of TEPSML and two out of seven for abundance of
CSPSMLwere exponentially related to wind speed. Thus, the
relationship between abundance of gel particles in the SML and wind speeds could not be well described by an expo-nential function. Nevertheless, the reduction of gel particle abundance and area in the SML indicated a clear removal from the SML with increasing wind speed. Enrichment of gel particles, with EF>1.2, for both abundance and total area were generally found at a wind speed of 2–6 m s−1 (Ta-ble 2), except for day 15 on which high CSP enrichment in the SML (EFAbundance=4.10 and EFTotal area=3.20) was
observed at a wind speed of 18 m s−1. Although the me-dian of EFs was significantly lower at wind speed>6 m s−1 than at a wind speed of 2–6 m s−1 (p <0.05; two-sample Kolmogorov–Smirnov test) (Table 2), gel particles were not always depleted in the SML at high wind speeds. Enrichment of both CSP and TEP at low wind speed was higher for to-tal area than for abundance (Table 2), suggesting selective enrichment of larger gel particles in the SML.
3.3 TEP and CSP size distributions related to wind speeds
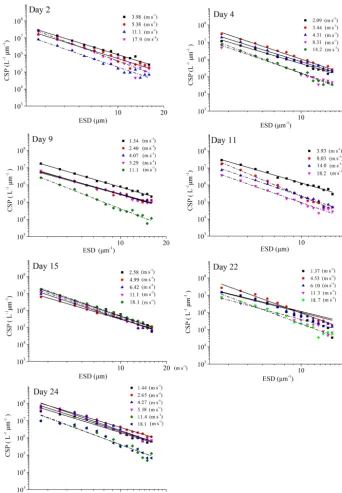
The power-law relation fitted the gel particle size distribu-tion (dp: 2–16 µm) very well for both CSPSMLand TEPSML
under different wind speed conditions (mean ofr2=0.95) (Figs. 4 and 5; slope (δ)data in the SML are given in the Supplement). The slopes of size distributions for TEPSML
maxi-Figure 2.Response of abundance and total area for TEPSMLto increasing wind speeds; the error bars indicate±1 SD.
mal gel particle size in the SML was found except for day 15. The response of CSPSML slopes to the wind speed varied
over time of the experiment. From days 2 to 11, the slopes of CSPSML were significantly lower at high wind speed
(>8 m s−1) (−3.78 to−3.05, median of 3.28, n=8) than at <8 m s−1 (−3.25 to −2.41, median of −2.63, n=12) (p <0.001; two-sample Kolmogorov–Smirnov test). How-ever, during the second part of the experiment, when a seed culture of E. huxleyi was added on day 20, followed by a biogenic SML from a previous experiment on day 21, no significant difference of CSPSML size distribution was
ob-served between high and low wind speeds (p=0.51, two-sample Kolmogorov–Smirnov test), and the negative effect of increasing wind on the maximum size for CSPSML was
less obvious (Fig. 6). In addition, the δ values for CSPSML
and TEPSMLbecame higher after the addition of theE.
hux-leyiculture. The average slope increased from−2.94 before
to−2.37 for CSPSML and from−2.79 before to−2.16 for
TEPSML(Fig. 7).
Size distribution of gel particles (dp: 2–16 µm) in the bulk
water also followed the power-law relationship of Eq. (1) (mean of r2=0.99), with δ varying between −3.48 and
−1.94 (mean value: −2.56, SD: 0.49) for TEPBulk and
be-tween−3.43 and−2.01 (mean value:−2.50, SD: 0.42) for CSPBulk. For the slopes of size distribution in the bulk
wa-ter, no significant difference was observed between high and low wind speeds. However, as observed for the SML, theδ values of both TEP and CSP in the bulk water were higher after adding the seed culture ofE. huxleyion day 20 and a biogenic SML from a previous experiment on day 21 (Fig. 7) (p <0.05, two-sample Kolmogorov–Smirnov test), i.e., the average slope of CSPBulkwith a size of 2–16 µm was−2.84
[image:5.612.127.470.62.474.2]Figure 3.Response of abundance and total area for CSPSMLto increasing wind speeds; the error bars indicate±1 SD.
The abundance of submicron gel particles (0.4–1 µm) in the SML was analyzed at low wind and high wind (Fig. S2). The results showed that the fraction of submicron gel parti-cles became larger at high speed (>6.1 m s−1) during the pe-riod after addition ofE. huxleyifollowed by a biogenic SML from a previous experiment (p=0.003 for TEPSML, p=
0.02 for CSPSML, two-sample Kolmogorov–Smirnov test).
The median abundance fraction of submicron gel increased from 33.7 % at low wind speed to 43.0 % at high wind speed for TEPSMLand from 38.5 to 46.0 % for CSPSML. There was
no enhancement found in submicron fraction at high wind speed before the addition of E. huxleyi, with the exception of day 11 when the fraction of submicron TEPSMLincreased
from 37.7 % at 3.93 m s−1to 51.4 % at 18.2 m s−1.
4 Discussion
Figure 4.PSD of TEPSMLat different wind speeds (linear regressions of log(dN/d(dp))vs. log(dp)was fitted to particles in the size range
of 2–16 µm ESD, with wind speeds<8 m s−1(solid line) and wind speeds>8 m s−1(dash and dot).
speed increases further (4–6 m s−1), microscale wave break-ing is likely to increase the turbulence in the top surface layer, but it does not cause homogenous mixing (Melville, 1996). The contribution of the fraction of submicron gel par-ticles increased when wind speed was above 6 m s−1, but the threshold of significant changing PSD in the SML was a wind speed of 8 m s−1. Thus, there is an inharmonic effect of wind speeds on the submicron fraction and PSD. For higher wind speeds of 8 m s−1and above, the enhancement of shear and of
kinetic energy dissipation by the release of momentum from
Figure 5.PSD of CSPSMLat different wind speeds (linear regressions of log(dN/d(dp))vs. log(dp)was fitted to particles in the size range
of 2–16 µm ESD, with wind speeds<8 m s−1(solid line) and wind speeds>8 m s−1(dash and dot)).
intensity by promoting the formation of TEP, but that TEP volume concentration and the fraction of large TEP are re-duced at stronger shear (Mari and Robert, 2008). Thus, the effect of wind shear on gel aggregation is double-edged, and large aggregates may be broken apart when the turbulence intensity increases. Our study suggests that high wind speed leads to a breakup of larger gel particles, enhancing the frac-tion of submicron gels in the SML.
The results of this study indicate that the decrease in to-tal TEPSML area with increasing wind speed may be related
Table 2.Enrichment factors (EFs) for gel particle abundance and total area in the SML at different wind speeds; (EFTotal area>EFAbundance are marked bold.)
Experiment Wind speed TEP CSP
day (m s−1) EFAbundance EFTotal area EFAbundance EFTotal area
2 NaN(<4 m s−1) 2.24 7.40 41.43 113.98
17.9 1.80 1.71 8.21 12.27
4 2.09 0.97 5.71 3.52 26.81
9 1.54 3.34 16.16 nd nd
2.40 4.80 12.76 1.84 7.08
5.29 1.44 5.40 1.20 2.78
11.1 1.08 1.07 0.74 0.72
11 3.93 0.91 1.16 13.46 31.16
18.2 1.63 1.53 1.11 1.12
15 2.58 1.06 1.13 1.28 1.03
4.99 0.48 0.77 0.47 1.08 6.42 0.68 0.95 1.39 2.02 11.1 0.77 0.70 2.14 1.50 18.1 1.28 1.02 4.10 3.20
22 1.37 3.06 4.38 1.14 2.41
4.53 3.06 5.04 5.46 4.54 6.10 2.94 4.78 1.34 2.23
11.3 0.61 1.02 1.07 1.02 18.7 0.44 0.58 1.41 0.85
24 1.44 4.68 8.21 1.82 3.93
4.27 6.97 6.06 5.94 6.82 5.38 6.42 5.19 2.44 4.05 11.4 2.38 1.23 0.72 0.66 18.1 1.74 0.81 0.65 0.69 Median of EFs <6 m s−1 3.06 7.81 6.48 19.22 Median of EFs >6 m s−1 1.28 1.53 2.14 2.23
total area of gels in the SML. However, an exponential rela-tionship was not observed between abundance of gel parti-cles and wind speed in this study. A likely explanation is that the abundance of gel particles was influenced not only by turbulence levels but also by bubble scavenging and bursting at higher speed. In particular small particles that contribute more to total abundance than to total area can accumulate in the SML due to bubble scavenging at high wind speed. This may explain why changes in gel particle abundance did not fit well to an exponential function with wind speed in our study.
According to our results, the average slopes showed about 41.2 % changes for TEPSMLat a speed>8 m s−1compared
to low wind speed, but only 23.8 % for CSPSML. The change
in slope of size distribution between high and low wind speeds was thus higher for TEPSML than CSPSML. In
addi-tion, after adding theE. huxleyiseed culture, no influence of wind speed on slopes of CSPSML (2–16 µm) was detected.
These results indicated that the influence of wind speed on size distribution of gel particles may be more pronounced for TEPSMLthan for CSPSML(Prieto et al., 2002; Engel and
Galgani, 2016).
4.2 Implication of gel particles in the SML
mat-Figure 6.Maximum size (ESD) of gel particles in the SML;(a)and(c)before addition ofE. huxleyi;(b)and(d)after addition ofE. huxleyi.
Figure 7.Average slopes of gel particles in the bulk water and SML. Open bars: before addition ofE. huxleyi; hatched bars: after addition ofE. huxleyi; error bars indicate±1 SD.
ter in the surface water column and a potential role of gel particles in gas exchange would be reduced.
Under conditions of high wind and wave breaking, sub-micron gels can be aerosolized with sea spray (Gantt et al., 2011). For the ocean, gel particle emission in aerosols has recently been discussed with respect to cloud formation, pre-cipitation, the hydrological cycle and climate (Knopf et al., 2011; Wilson et al., 2015; Alpert et al., 2011). In this study, we found that the fraction of submicron gels (0.4–1 µm) in
the SML increased at high wind speeds (>6 m s−1) after the
addition ofE. huxleyiand on day 11 with the peak concen-tration of bacterial abundance in the SML (Fig. 8). Due to the TEP’s flexible nature, small gels can pass through a fil-ter with a size of 0.4 µm (Passow and Alldredge, 1995) and thus may escape the measurement. It is therefore likely that the fraction of submicron gels was even higher at high wind speeds than observed. The changes of size distribution of gel particles in the SML indicated that large gel particles were fragmented into smaller gels at high wind speed, or that sub-micron gels were generated. Strong enrichment of TEP in submicron SSA under field conditions has been observed by Aller et al. (2017). Production of SSA in the field is driven by wind speed, and SSAs in the size range 0.4–1 µm in particular were observed to be higher at high wind speed (Lehahn et al., 2014). Therefore, our finding supported the results of Aller et al. (2017) and Lehahn et al. (2014) and suggest that the enhanced contribution of submicron gel particles at higher wind>6 m s−1 after the addition ofE. huxleyi, potentially impact the emission of gels with SSA.
[image:10.612.49.287.377.543.2]Figure 8. Strong accumulation of TEP and CSP in the SML at low wind speed as determined by microscopy,(a)TEP (2.0 m s−1),
(b) TEP (4.3 m s−1), (c) TEP (8.3 m s−1), (d) CSP (2.0 m s−1),
(e)CSP (4.3 m s−1),(f)CSP (8.3 m s−1);(g)proposed schematic for interactions between wind speed and gel particle coverage in the SML.
sink out of the SML. This, to a certain extent, may explain that a decrease in the EFs of CSP and TEP after the addition of theE. huxleyiseed. The observed changes after addition of theE. huxleyiseed culture indicates that variations in gel particles in the SML may also depend on the source of gels and gel precursors.
5 Conclusion
Our study showed that an enrichment of biogenic gel par-ticles in the SML can occur at a low speed (<6 m s−1) de-spite low autotrophic productivity in the water column. A negative exponential relationship between the total area of gel particles in the SML and wind speed was observed in most cases. Our results showed that the PSD is an impor-tant parameter for characterizing the shape of the gel particle size distribution in the SML and reflects the particles’ fate in the SML (i.e., aggregation, fragmentation and injection into air). The slope of PSD for TEP(2−16 µm) and the max-imum size of gel particles in the SML varied significantly at about 8 m s−1. The influence of wind speed on spectral slopes is more pronounced for TEPSMLthan for CSPSML, and
CSPSML are less prone to aggregation than TEPSML during
the low wind speed. The enhancement of contribution of sub-micron gel particles in the SML at higher wind (>6 m s−1)
after the addition ofE. huxleyiindicates that biological ac-tivity may potentially influence the emission of gels with sea spray aerosol. Overall, variations in gel particle sizes in the SML can provide useful information on particle dynamics at the interface between air and sea.
To better understand the role of biogenic gel particles for bio-physicochemical processes across the air–sea interface, future studies should consider the full size spectrum of gels scaling from nanometers to micrometers and also include their chemical composition. This could provide important information on implications of marine gels for aerosol and cloud formation as well as for air–sea gas exchange.
Data availability. All data are available at
https://doi.org/10.1594/PANGAEA.891025 (Sun et al., 2018).
Supplement. The supplement related to this article is available online at: https://doi.org/10.5194/bg-15-3577-2018-supplement.
Competing interests. The authors declare that they have no conflict of interest.
Acknowledgements. We thank Tania Klüver, Ruth Flerus, Katja Laß, Sonja Endres and Jon Roa for technical assistance. Armin Form helped to collect seawater for the Aeolotron ex-periment onboard the RV Poseidon. This study was supported by the SOPRAN-III project (03F06622.2) and by the China Scholarship Council (grant number 201408440016). We also thank Bernd Jähne, Kerstin Krall and Maximilian Bopp for providing access and support during the Aeolotron experiment, and for sharing their data and knowledge. This study is a contribution to the international Surface Ocean Lower Atmosphere Study (SOLAS).
Edited by: Gerhard Herndl
Reviewed by: two anonymous referees
References
Alldredge, A. L., Passow, U., and Logan, B. E.: The Abundance and Significance of a Class of Large, Transparent Organic Particles in the Ocean, Deep-Sea Res. Pt. I, 40, 1131–1140, https://doi.org/10.1016/0967-0637(93)90129-Q, 1993.
Aller, J. Y., Radway, J. C., Kilthau, W. P., Bothe, D. W., Wil-son, T. W., Vaillancourt, R. D., Quinn, P. K., Coffman, D. J., Murray, B. J., and Knopf, D. A.: Size-resolved charac-terization of the polysaccharidic and proteinaceous compo-nents of sea spray aerosol, Atmos. Environ., 154, 331–347, https://doi.org/10.1016/j.atmosenv.2017.01.053, 2017.
supercooled aqueous phases, Phys. Chem. Chem. Phys., 13, 19882–19894, https://doi.org/10.1039/c1cp21844a, 2011. Azetsu-Scott, K. and Niven, S. E. H.: The role of transparent
ex-opolymer particles (TEP) in the transport of Th-234 in coastal water during a spring bloom, Cont. Shelf Res., 25, 1133–1141, https://doi.org/10.1016/j.csr.2004.12.013, 2005.
Belcher, S. E., Grant, A. L. M., Hanley, K. E., Fox-Kemper, B., Van Roekel, L., Sullivan, P. P., Large, W. G., Brown, A., Hines, A., Calvert, D., Rutgersson, A., Pettersson, H., Bidlot, J. R., Janssen, P. A. E. M., and Polton, J. A.: A global perspective on Langmuir turbulence in the ocean surface boundary layer, Geophys. Res. Lett., 39, L18605, https://doi.org/10.1029/2012gl052932, 2012. Calleja, M. Ll., Duarte, C. M., Prairie, Y. T., Agustí, S., and
Herndl, G. J.: Evidence for surface organic matter modulation of air-sea CO2 gas exchange, Biogeosciences, 6, 1105–1114,
https://doi.org/10.5194/bg-6-1105-2009, 2009.
Carlson, D. J.: Dissolved Organic Materials in Surface Mi-crolayers – Temporal and Spatial Variability and Re-lation to Sea State, Limnol. Oceanogr., 28, 415–431, https://doi.org/10.4319/lo.1983.28.3.0415, 1983.
Cunliffe, M., Engel, A., Frka, S., Gasparovic, B., Guitart, C., Mur-rell, J. C., Salter, M., Stolle, C., Upstill-Goddard, R., and Wurl, O.: Sea surface microlayers: A unified physicochemical and bi-ological perspective of the air-ocean interface, Prog. Oceanogr., 109, 104–116, https://doi.org/10.1016/j.pocean.2012.08.004, 2013.
Donelan, M. A.: Air-Water Exchange Processes, in: Physical Pro cesses in Lakes and Oceans, American Geophysical Union, Washington, 19–36, 1998.
Ebling, A. M. and Landing, W. M.: Sampling and anal-ysis of the sea surface microlayer for dissolved and particulate trace elements, Mar. Chem., 177, 134–142, https://doi.org/10.1016/j.marchem.2015.03.012, 2015.
Ellis, K. M., Bowers, D. G., and Jones, S. E.: A study of the temporal variability in particle size in a high energy regime, Coast. Shelf Sci., 61, 311–315, https://doi.org/10.1016/j.ecss.2004.06.001, 2004.
Engel, A.: Determination of marine gel particles. Practical Guide-lines for the Analysis of Seawater, CRC Press, Boca Raton, 2009. Engel, A. and Galgani, L.: The organic sea-surface microlayer in the upwelling region off the coast of Peru and potential implications for air–sea exchange processes, Biogeosciences, 13, 989–1007, https://doi.org/10.5194/bg-13-989-2016, 2016.
Engel, A., Thoms, S., Riebesell, U., Rochelle-Newall, E., and Zondervan, I.: Polysaccharide aggregation as a potential sink of marine dissolved organic carbon, Nature, 428, 929–932, https://doi.org/10.1038/nature02453, 2004.
Engel, A., Sperling, M., Sun, C. C., Grosse, J., and Friedrichs, G.: Bacterial control of organic matter in the surface microlayer: In-sights from a wind wave channel experiment, Frontiers in Ma-rine Sciences, 5, 182, https://doi.org/10.3389/fmars.2018.00182, 2018.
Falkowska, L.: A field evaluation of teflon plate, glass plate and screen sampling techniques. Part 1. Thickness of microlayer samples and relation to wind speed, Oceanol., 41, 211–221, 1999.
Frew, N. M., Bock, E. J., Schimpf, U., Hara, T., Haussecker, H., Edson, J. B., McGillis, W. R., Nelson, R. K., McKenna, S. P., Uz, B. M., and Jahne, B.: Air-sea gas
trans-fer: Its dependence on wind stress, small-scale roughness, and surface films, J. Geophys. Res.-Oceans, 109, C08S17, https://doi.org/10.1029/2003JC002131, 2004.
Gantt, B., Meskhidze, N., Facchini, M. C., Rinaldi, M., Ce-burnis, D., and O’Dowd, C. D.: Wind speed dependent size-resolved parameterization for the organic mass fraction of sea spray aerosol, Atmos. Chem. Phys., 11, 8777–8790, https://doi.org/10.5194/acp-11-8777-2011, 2011.
Garrett, W. D. and Duce, R. A.: Surface Microlayer Samplers, in: Air-Sea Interaction: Instruments and Methods, edited by: Dob-son, F., Hasse, L., and Davis, R., Springer US, Boston, MA, 471– 490, 1980.
GESAMP: The Sea-Surface Microlayer and its Role in Global Change, Reports and Studies, WMO, 1995.
Graham, D. E. and Phillips, M. C.: Proteins at liquid interfaces: I. Kinetics of adsorption and surface denaturation, J. Colloid Interf. Sci., 70, 403–414, https://doi.org/10.1016/0021-9797(79)90048-1, 1979.
Guasco, T. L., Cuadra-Rodriguez, L. A., Pedler, B. E., Ault, A. P., Collins, D. B., Zhao, D. F., Kim, M. J., Ruppel, M. J., Wil-son, S. C., Pomeroy, R. S., Grassian, V. H., Azam, F., Bertram, T. H., and Prather, K. A.: Transition Metal Associations with Primary Biological Particles in Sea Spray Aerosol Generated in a Wave Channel, Environ. Sci. Technol., 48, 1324–1333, https://doi.org/10.1021/es403203d, 2014.
Knopf, D. A., Alpert, P. A., Wang, B., and Aller, J. Y.: Stimula-tion of ice nucleaStimula-tion by marine diatoms, Nat. Geosci., 4, 88–90, https://doi.org/10.1038/ngeo1037, 2011.
Kuznetsova, M., Lee, C., and Aller, J.: Characterization of the pro-teinaceous matter in marine aerosols, Mar. Chem., 96, 359–377, https://doi.org/10.1016/j.marchem.2005.03.007, 2005.
Leck, C. and Bigg, E. K.: Source and evolution of the marine aerosol – A new perspective, Geophys. Res. Lett., 32, L19803, https://doi.org/10.1029/2005GL023651, 2005.
Lehahn, Y., Koren, I., Rudich, Y., Bidle, K. D., Trainic, M., Flo-res, J. M., Sharoni, S., and Vardi, A.: Decoupling atmospheric and oceanic factors affecting aerosol loading over a cluster of mesoscale North Atlantic eddies, Geophys. Res. Lett., 41, 4075– 4081, https://doi.org/10.1002/2014GL059738, 2014.
Liss, P. S. A. D. R. A.: The Sea Surface and Global Change, Cam-bridge University Press, CamCam-bridge, 2005.
Liu, K. W. and Dickhut, R. M.: Effects of wind speed and particulate matter source on surface microlayer characteris-tics and enrichment of organic matter in southern Chesa-peake Bay, J. Geophys. Res.-Atmos., 103, 10571–10577, https://doi.org/10.1029/97jd03736, 1998.
Long, R. A. and Azam, F.: Abundant protein-containing par-ticles in the sea, Aquat. Microb. Ecol., 10, 213–221, https://doi.org/10.3354/Ame010213, 1996.
Mari, X. and Kiorboe, T.: Abundance, size distribution and bac-terial colonization of transparent exopolymeric particles (TEP) during spring in the Kattegat, J. Plankton Res., 18, 969–986, https://doi.org/10.1093/plankt/18.6.969, 1996.
Mari, X. and Robert, M.: Metal induced variations of TEP sticking properties in the southwestern la-goon of New Caledonia, Mar. Chem., 110, 98–108, https://doi.org/10.1016/j.marchem.2008.02.012, 2008.
car-bon cycling in the ocean, Prog. Oceanogr., 151, 13–37, https://doi.org/10.1016/j.pocean.2016.11.002, 2017.
McCave, I. N.: Size Spectra and Aggregation of Suspended Particles in the Deep Ocean, Deep-Sea Res., 31, 329–352, https://doi.org/10.1016/0198-0149(84)90088-8, 1984.
Melville, W. K.: The role of surface-wave breaking in the air-sea interaction, Annu. Rev. Fluid Mech., 28, 279–321, https://doi.org/10.1146/annurev.fl.28.010196.001431, 1996. Mesarchaki, E., Kräuter, C., Krall, K. E., Bopp, M., Helleis, F.,
Williams, J., and Jähne, B.: Measuring air–sea gas-exchange ve-locities in a large-scale annular wind–wave tank, Ocean Sci., 11, 121–138, https://doi.org/10.5194/os-11-121-2015, 2015. Nagel, L., Krall, K. E., and Jähne, B.: Comparative heat and
gas exchange measurements in the Heidelberg Aeolotron, a large annular wind-wave tank, Ocean Sci., 11, 111–120, https://doi.org/10.5194/os-11-111-2015, 2015.
Orellana, M. V., Matrai, P. A., Leck, C., Rauschenberg, C. D., Lee, A. M., and Coz, E.: Marine microgels as a source of cloud con-densation nuclei in the high Arctic, P. Natl. Acad. Sci. USA, 108, 13612–13617, https://doi.org/10.1073/pnas.1102457108, 2011. Passow, U.: Transparent exopolymer particles (TEP) in
aquatic environments, Prog. Oceanogr., 55, 287–333, https://doi.org/10.1016/S0079-6611(02)00138-6, 2002. Passow, U. and Alldredge, A. L.: Aggregation of a Diatom
Bloom in a Mesocosm – the Role of Transparent Ex-opolymer Particles (Tep), Deep-Sea Res. Pt. II, 42, 99–109, https://doi.org/10.1016/0967-0645(95)00006-C, 1995.
Prieto, L., Ruiz, J., Echevarria, F., Garcia, C. M., Bartual, A., Galvez, J. A., Corzo, A., and Macias, D.: Scales and processes in the aggregation of diatom blooms: high time resolution and wide size range records in a mesocosm study, Deep-Sea Res. Pt. I, 49, 1233–1253, https://doi.org/10.1016/S0967-0637(02)00024-9, 2002.
Romano, J. C.: Sea-surface slick occurrence in the open sea (Mediterranean, Red Sea, Indian Ocean) in rela-tion to wind speed, Deep-Sea Res. Pt. I, 43, 411–423, https://doi.org/10.1016/0967-0637(96)00024-6, 1996.
Ruiz, J. E. and Izquierdo, A.: A simple model for the break-up of marine aggregates by turbulent shear, Oceanolica Acta, 20, 597– 605, 1997.
Russell, L. M., Hawkins, L. N., Frossard, A. A., Quinn, P. K., and Bates, T. S.: Carbohydrate-like composition of submi-cron atmospheric particles and their production from ocean bubble bursting, P. Natl. Acad. Sci. USA, 107, 6652–6657, https://doi.org/10.1073/pnas.0908905107, 2010.
Stoderegger, K. E. and Herndl, G. J.: Production of exopolymer par-ticles by marine bacterioplankton under contrasting turbulence conditions, Mar. Ecol. Prog. Ser., 189, 9–16, 1999.
Sun, C.-C., Sperling, M., and Engel, A.: Effect of wind speed on the size distribution of gel particles in the sea surface micro-layer: Insights from a wind wave channel experiment, PAN-GAEA, https://doi.org/10.1594/PANGAEA.891025, 2018. UNESCO: Procedure for sampling the sea surface microlaye, in:
IOC Manuals and Guide 15, UNESCO (United Nations Educa-tional, Scientific and Cultural organization), Paris, 1985. Van Vleet, E. S. and Williams, P. M.: Surface potential and film
pressure measurements in seawater systems, Limnol. Oceanogr., 28, 401–414, https://doi.org/10.4319/lo.1983.28.3.0401, 1983. Wilson, T. W., Ladino, L. A., Alpert, P. A., Breckels, M. N., Brooks,
I. M., Browse, J., Burrows, S. M., Carslaw, K. S., Huffman, J. A., Judd, C., Kilthau, W. P., Mason, R. H., McFiggans, G., Miller, L. A., Najera, J. J., Polishchuk, E., Rae, S., Schiller, C. L., Si, M., Temprado, J. V., Whale, T. F., Wong, J. P. S., Wurl, O., Yakobi-Hancock, J. D., Abbatt, J. P. D., Aller, J. Y., Bertram, A. K., Knopf, D. A., and Murray, B. J.: A marine biogenic source of atmospheric ice-nucleating particles, Nature, 525, 234, https://doi.org/10.1038/nature14986, 2015.
Wurl, O. and Holmes, M.: The gelatinous nature of the sea-surface microlayer, Mar. Chem., 110, 89–97, https://doi.org/10.1016/j.marchem.2008.02.009, 2008.
Wurl, O., Miller, L., Ruttgers, R., and Vagle, S.: The dis-tribution and fate of surface-active substances in the sea-surface microlayer and water column, Mar. Chem., 115, 1–9, https://doi.org/10.1016/j.marchem.2009.04.007, 2009.
Wurl, O., Miller, L., and Vagle, S.: Production and fate of transpar-ent exopolymer particles in the ocean, J. Geophys. Res.-Oceans, 116, C00H13, https://doi.org/10.1029/2011JC007342, 2011. Wurl, O., Stolle, C., Van Thuoc, C., The Thu, P., and Mari, X.:
Biofilm-like properties of the sea surface and predicted ef-fects on air–sea CO2 exchange, Prog. Oceanogr., 144, 15–24, https://doi.org/10.1016/j.pocean.2016.03.002, 2016.