Abstract: Stock market forecasting is considered as a challenging task in financial time series forecasting. The core idea of a successful stock market forecast is to get the best results with the least amount of input data required and the least complex stock market model. So in this paper, to achieve these goals, this paper proposes a new algorithm Cuckoo Neural for Financial Market (CN_FM), which integrates Cuckoo Search (CS) with a Feed forward back propagation Neural Network (FFBPNN) and build a stock price forecasting proficient system. This research follows some basic steps to design a model for sentiment analysis from Stock market dataset and firstly data is pre-processed to remove the unwanted text. In pre-processing steps the techniques such as normalization, punctuation, stop word removal and tokenization are applied. The extracted features are optimized using CS and in turns used to train the FFBPNN. The results obtained from experiments in the stock market show that the proposed method can reduce the dimensions and produce accurate results for emotion-based text categorization with an accuracy of 99.44%.
Index Terms: Sentiment Analysis, Stock market, Cuckoo Search, Feed forward back propagation Neural Network
I. INTRODUCTION
Due to the increase in the complexity of financial markets, it is essential to create technical tools to help investors to properly apply their assets to attain significant profits. The stock market represents a way for investors to make a profit, although any investment has risks that make it impracticable to promising an assured profit [1]. It has now become a hot topic for investors to discuss price forecasts and the right time to invest or exit the stock market. However, designing an accurate stock forecasting model remains a challenging issue. In accumulation to historical prices, the existing stock market is affected by social sentiment. The overall social sentiment associated with a particular company may be one of the significant variables that influence the company's stock price. Today, the emergence of online social networks has made a large amount of emotional data available [2]. Therefore, combining information from social media with historical prices can develop the analytical capability of the model. It is observed that almost 80 % of the internet data is available in the form of text, so text analysis has become a key factor in public sentiment and opinion enlightenment. Sentiment analysis, also known as opinion mining, aims to determine
Revised Manuscript Received on August 05, 2019.
Vani Kansal, Department of Computer Science, NITTTR, Chandigarh, India
Rakesh Kumar, Department of Computer Science, NITTTR, Chandigarh, India
people's perceptions of a topic by analyzing their posts on social media and different behaviors. It can categorize the polarity of the posts into dissimilar opposite emotions, namely; positive, and negative [3].
The polarity can be determined by using two techniques named:
A. Lexicon
Lexicon analysis is designed to estimate the polarity of a text file from the semantic direction of a word or phrase in a text file [4].The lexicon-based approach is constructed by utilizing three methods namely; manual approach, dictionary-based approach and corpus-based approach. The manual method depends on the efforts done by human and requires an Annotator to mark the polarity of the text that is whether a word is positive or negative or neutral [5]. The dictionary-based scheme uses very few emotion words along with the synonyms and antonyms links present in a dictionary (eg, WordNet). Corpus-based approach relies on the subsequent statement: "If the text document contains many positive or negative words, the document should be positive (or negative); or if the word appears in many positive (or negative) documents, the word should be positive (Or negative)"[6].
B.Machine learning
In the machine learning method, a classifier that can determine the polarity of a new text is constructed. A classifier is constructed from tag instances of other stuff such as sentences, documents, etc. This is called supervised learning because the classifier indicates the, good or bad examples of the class. The classifier understands certain features that make a distinction between positive and negative text. Classification can be binary (positive and negative) or can include neutral categories. An advantage of the machine learning method is that a given set of marked data, i.e. a document that has previously been determined to be positive
or negative, has
Optimized Feature Extraction Based Artificial
Intelligence Technique for Empirical Analysis of
Stock Market Data
been identified [7]. The general process of machine learning is shown in figure 1.
Fig. 1 Machine Learning Approach
The aim of this research is to design a model to predict
stock market movement on the basis of social sentiments. C.Motivation and contributions
The purpose of stock market data analysis is to find consequential structures and suggestions from the stock data based on their polarity. The assignment of sentiment detection from stock market data overcomes the decision rate of users who are confused to invest in stock market. Sentiment detection from stock market data is a demanding and challenging assignment due to many complicated problems, such as low quality of text feature, high similarity rate, polarity change in the text data. From these types of challenging task we present optimized feature extraction based artificial intelligence technique for empirical analysis of stock market data. In simple words, this paper makes the following contributions.
We design a novel pre-processing technique based on the stock market data which helps to achieve better performance.
For the classification of polarity from stock market data, FFBPNN technique is used with optimized feature using CS which is based on the stock market lexicon dictionary.
We design a novel method for user suggestions to buy or not buy a stock based on their polarity continuity in a specific time period.
II. RELATEDWORK
The stock market data is chaotic, noisy, casual, irregular, and non-linear in nature. Thus, market researchers and investors are always in a very difficult situation to decide at what time the shares can be buy or sell. Based on soft computing and artificial intelligence techniques a number of financial prediction modals are proposed to enhance the prediction
researchers Fama et al. [8], the present stock market completely reflects all accessible information. Therefore, price changes exist simply due to novel information or news. Because news in nature is random and currently unknown, stock prices should follow a random walk pattern, and the best bet for the next price is the current price. To overcome the problem of predictability accuracy, Walczak [9] in 2001 said that their accuracy is unpredictable and cannot be obtained by more than 50% because the lack of sentimental dictionary. In 2008 Pang and Lee worked on finding sentiments by using products as well as a restaurant review. Previously the main source of stock sentiment analysis is considered as news but now a day’s social media become an essential tool for analyzing stock market [10]. For different scenario, Bollen et al. in 2011 worked on the people responding on the president election in 2008. The authors have used a hybrid classification approach namely fuzzy logic with a neural network. The accuracy of up to 86.7 % has been analyzed with an error rate of 6 % [11]. Nguyen et al. have designed a prediction stock price market model that has been used to analyze the stock market on the basis of social media comments. The features from the social text have been extracted by using Latent Dirichlet Allocation (LDA) approach. Initially, the stop words are deleted from the text document and the document is lemmatized by using Core NLP [12]. Chen et al. design a model that finds the relationship between Twitter sentiment data and the flow of the stock market [13]. Chiong et al. used a support vector machine (SVM) to design a financial prediction model. An optimization technique named as particle swarm optimization (PSO) with an appropriate fitness function is used to optimize the parameters [14]. Pagolu et al. have utilized two different text representations namely Word2vec and N-gram to examine the tweets posted by the public. The similarity between the stock market movement and the sentiments posted by various people in the Twitter website by utilizing the concept of supervised learning scheme. It has been analyzed that the positive tweets encourage the people to invest in the stock market and also the relation between rising and fall in the stock market with respect to the public sentiment have been examined [15].
From the analysis of several existing work in sentiment analysis field, we observed that the accuracy of model is not up to mark because the lack of best feature selection according to the sentiment class. The uniqueness and proper feature selection algorithm is necessary steps to achieve better classification accuracy with FFBPNN as a classifier.
III. TECHNIQUESUSED
In this research work mainly two techniques are used one is to optimize the extracted text features and another one is to classify and to distinguished among the sentiments. We select the unique feature from feature sets in each category based on the objective function (fitness function) of the optimization technique. So we define a novel objective function for Cuckoo search algorithm. After the feature optimization process, an FFFBPNN is initialized to train the proposed sentiment classification system for the stock market database. The trained neural network
is stored in the form
Use
-
+
+
Features
Machine learning algorithm
Classifier
?
T
ra
in
in
g
d
a
ta
T
ra
in
in
g
N
ew
D
a
A.Cuckoo Search Algorithm
The inspiration for CS comes from the obligate brooding parasites of some cuckoo species, which produce eggs in the host bird’s nest. Some cuckoos have evolved in such a way that female parasitic cuckoos mimic the colour and pattern of eggs of a few selected host species. This decreases the likelihood of eggs being abandoned, thus escalating their ability to reproduce. It is worth mentioning that some host birds directly conflict with the invading cuckoo. In this case, if the host birds find that they are not their own, they either throw them away or give up their nests and construct new nests elsewhere. The CS algorithm mainly performs three steps as written below:
Every Cuckoo bird chooses a nest arbitrary and then lay an egg in the nest
Higher quality eggs are used for the production of the next generation
The host of Cuckoo birds can search for a foreign egg with a probability P. In this case, the host bird throws away the egg, abandons the whole nest and creates a novel nest [16].
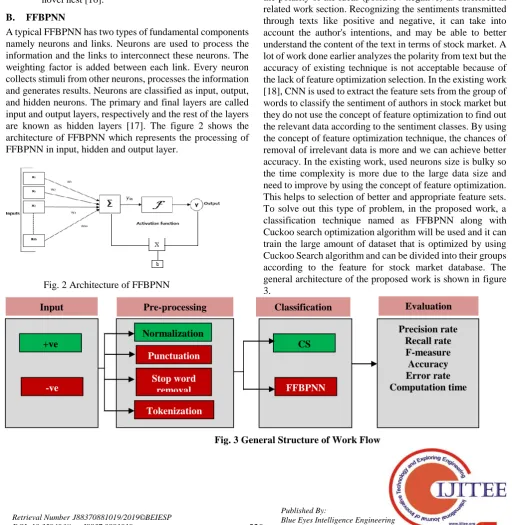
B. FFBPNN
A typical FFBPNN has two types of fundamental components namely neurons and links. Neurons are used to process the information and the links to interconnect these neurons. The weighting factor is added between each link. Every neuron collects stimuli from other neurons, processes the information and generates results. Neurons are classified as input, output, and hidden neurons. The primary and final layers are called input and output layers, respectively and the rest of the layers are known as hidden layers [17]. The figure 2 shows the architecture of FFBPNN which represents the processing of FFBPNN in input, hidden and output layer.
Fig. 2 Architecture of FFBPNN
In the figure 2, the net input can be calculated as follows using the given equation based on the optimized feature set as an input training data.
+
Where, X1, X2, X3…. Xm are optimized feature of text data and W1, W2, W3…. Wm are the initialized weight value, b is the bias input provided to the hidden layer of FFBPNN in order to adjust the input data according to target. On the basis of this, the output can be calculated by applying the activation function over the net input data in hidden layer and the equation of output is given as:
Where, Y/Output of FFBPNN is a structured data which is used in classification process with test data.
IV. PROPOSEDWORK
Most of the current work in this direction usually recognizes the polarity of the ideas (positive / negative) as described in related work section. Recognizing the sentiments transmitted through texts like positive and negative, it can take into account the author's intentions, and may be able to better understand the content of the text in terms of stock market. A lot of work done earlier analyzes the polarity from text but the accuracy of existing technique is not acceptable because of the lack of feature optimization selection. In the existing work [18], CNN is used to extract the feature sets from the group of words to classify the sentiment of authors in stock market but they do not use the concept of feature optimization to find out the relevant data according to the sentiment classes. By using the concept of feature optimization technique, the chances of removal of irrelevant data is more and we can achieve better accuracy. In the existing work, used neurons size is bulky so the time complexity is more due to the large data size and need to improve by using the concept of feature optimization. This helps to selection of better and appropriate feature sets. To solve out this type of problem, in the proposed work, a classification technique named as FFBPNN along with Cuckoo search optimization algorithm will be used and it can train the large amount of dataset that is optimized by using Cuckoo Search algorithm and can be divided into their groups according to the feature for stock market database. The general architecture of the proposed work is shown in figure 3.
Fig. 3 General Structure of Work Flow
Input Pre-processing Classification Evaluation
+ve
-ve
Normalization Punctuation
Stop word removal
Tokenization
CS
FFBPNN
[image:3.595.41.554.297.823.2]Algorithm: Proposed Algorithm (CN_FM)
Input: Feature of Text Sentiment File as Token Value and Fitness Function
Output: Text Polarity as Positive and Negative
Initialize the Cuckoo Search with their operating functions – Egg Size – Current Egg – Respective Eggs
Define fitness function of Cuckoo Search for feature selection Fitness_function = True; if
False; otherwise
Calculate size of Feature in terms of row and columns (R, C) For i=1 to R
For j=1 to C
Fs= Current Egg (i, j) // It is the multiple of current text token values with random travel time (TT)
Ft= Respective Eggs (i, j) // It is the multiple of respective text token values with random travel time (TT) Fit_function =Call Fit_function (Fs, Ft)
Fitdata=CS (Fit_function, Feature of Text) End
End
Training Data (T) = Fitdata
Initialize FFBPNN with parameters – Epochs (E) – Neurons (N) – Performance parameters: MSE Gradient, Mutation and Validation – Training Techniques: Levenberg Marquardt (Trainlm)
– Data Division: Random
For each set of T
If Training Data ɛ Positive
Else if Training Data ɛ Negative
Else // Extra Data
End
Initialized the FFBPNN using Training data and Group Net = newff (Training Data, Group, )
Set the training parameters according to the requirements and train the system
Net = Train ( )
Classification Results = simulate (Net, Optimized Current Text Token Value)
If Classification Results = True
Show classified results in terms of the their polarity Calculate the performance parameters
End
Return: Classified Results End
Based on the above mentioned hybrid algorithm CN_FM, the proposed system helps to classify the polarity of text data and return their connected sentiment for the text data.
Fitness_function is used to optimize extracted feature of text data for training and classification of stock tweets sentiments. Threshold value is defined based on the different other tweets features based on same sentiments and for current text feature,
current text feature is optimal then we consider in a feature set in training and classification process of proposed model. For the simulation of proposed work we used stock twits data which is fetched directly from Twitter site. For the simulation and validation of proposed work, total 936 twit samples are taken from Jan, 2018 to April 2019. Form the 936 twits, 545 samples are belongs to the negative sentiments and rest 391 samples are the positive samples. Based on the Stock twits Database, according to their sentiment, otherwise discard their feature from feature set. After that we find out a complete and appropriate feature set according to sentiment types which are used the simulation results are given with their performance parameters.
A.Input Data
For the experimental analysis, the test data is uploaded from the testing folder that comprises of two types of sentiment positive and negative.
B.Pre-Processing
The pre-processing steps are applied to remove the undesired text. The pre-processing is performed in different steps such as (i) normalization, (ii) Punctuation (iii) Stop word removal and (iv) Tokenization.
C. Optimized Data
After the pre-processing in both phases (Training and Testing), feature extraction technique is applied to find out the appropriate feature sets from the uploaded data set and apply optimization algorithm to select the unique feature from feature sets for each categories based on the objective function of optimization technique.
D.Classification
[image:4.595.304.535.551.719.2]After getting the optimized data, FFBPNN is initialized to train the proposed sentiment classification system. The trained neural network is stored in the form of structure according to the data classes (Target). During testing process, test data is uploaded and converts into feature sets and then going for the classification process based on the FFBPNN structure. Test data is compared with the data stored into the neural trained structure. If the data is matched, then sentiments are classified into positive or negative classes else the sentiments are not classified. Table I, shows the input parameters chosen while using the FFBPNN.
Table I. Input Parameters of ANN
PARAMETERS VALUES
NUMBER OF LAYERS 3
INPUT TRAINING FEATURE 1
OUTPUT TARGET 3
HIDDEN LAYER NEURONS 50
TRAINING LEVENBERG
MARQUARDT
PERFORMANCE MSE
TRAINING EPOCHS 1000
V.RESULTSANDANALYSIS
The simulation of this work is done in MATLAB, using Neural Network Tool Box. This section analysis the results achieved for our proposed work.
A.Performance parameters
[image:5.595.51.287.182.391.2]At last, performance parameters of the test data set are calculated. Table II, shows the performance parameters like error, execution time, precision, recall, f Measure, accuracy of 5 different test data.
Table II. Computational Results
NO.
OF
ITER ATIO NS
ERR OR
EXEC UTIO N
TIME
PREC ISION
REC ALL
F-ME ASUR
E
ACC URA CY
1 0.243
7
0.057 2
0.986 6
0.98 103
0.983 8
99.7 5
2 0.725 0.130
0
0.986 3
0.98 17
0.984 0
99.2 7
3 0.757 0.178
9
0.986 79
0.97 849
0.982 62
99.2 4
4 0.489
9
0.140 6
0.986 46
0.97 954
0.982 99
99.5 1
5 1.264
2
0.106 2
0.986 55
0.98 054
0.983 54
98.4 3
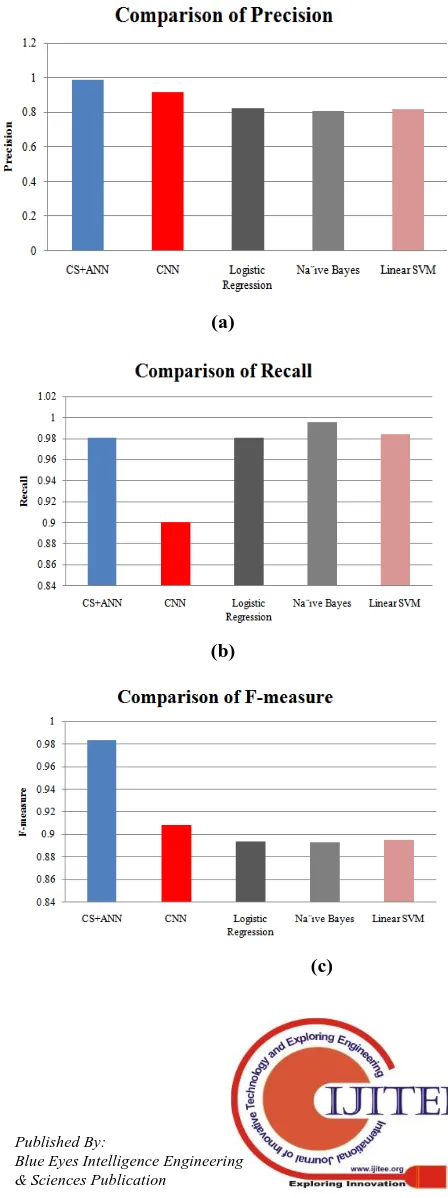
To compare the performance of the proposed work, the performance parameters such as precision, recall and F-measure are compared with the work proposed by Sohangir et al. in 2018[18] and Petty, N et al. (2018) [19] respectively. In [18], the researchers have used deep learning technique such as CNN for the detection of sentiments for stock twits, whereas, in [19] ,the techniques such as Logistic Regression, Na¨ıve Bayes and Linear SVM have been used. Table III. Shows the comparative analysis of parameters between various techniques. The average of Precision, determined using the CNN, Logistic Regression, Na¨ıve Bayes and Linear SVM is 0.9168, 0.822, 0.809, and 0.820 respectively. Thus it is concluded that our sentiment analyzer performs well compared to the existing approach.
Table III. Comparative analysis parameters
PARAME
TERS
PROPOS
ED
WORK
SOHAN GIR ET AL.[18]
PETTY N ET AL.[19]
TECHNIQ
UE USED
CS+ ANN
CNN
LOGISTI
C
REGRESS
ION
NA¨IVE
BAYES
LINE AR
SVM
PRECISIO
N
0.9865 0.9168 0.822 0.809 0.820
RECALL 0.9802 0.9004 0.981 0.996 0.984
F-MEASU
RE
0.9834 0.9086 0.894 0.893 0.895
ACCURAC
Y
99.24 90.93 81.4 80.8 81.4
Figure 4(a) represents the comparison of Precision, determined by different techniques presented by various
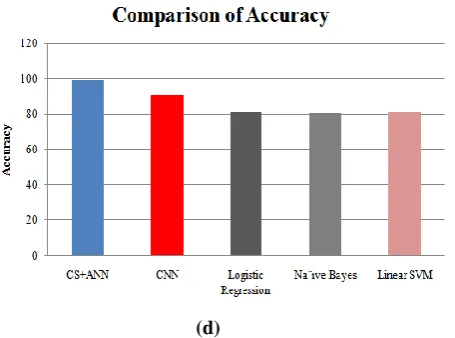
authors in the form of bar graph and it is observed that the precision of proposed work is higher as compared to the other existing techniques. From the figure 4(b), it is observed that the recall rate of naïve Bayes is higher and CNN technique is lowest. The F-measure for the proposed work is higher as compared to the other existing techniques as shown in figure 4(c). The comparison of accuracy investigated during the research work with the existing work performed by authors. The average value of accuracy measured for proposed work and existing work using CNN, Logistic Regression, Na¨ıve Bayes and Linear SVM is 99.24 % and 90.93 %, 81.4%, 80.8%, and 81.4% respectively. Thus, there is an increase of 9.36 %, 22.16%, 20.7% and 22.16% in the accuracy rate of proposed work as shown in figure 4(d).
(a)
(b)
[image:5.595.315.539.237.836.2](d)
Fig. 4 Comparison of Performance Parameters (a) Precision, (b) Recall, (c) F-measure, (d) Accuracy
V.CONCLUSION
For recognition and classification purpose, deep learning/machine learning has better performance in a different domain, like NLP. Deep learning/machine learning has the opportunity to deal with data analysis and learning issues in data mining. In the data mining, deep learning/machine learning algorithm forward data via various layers. The hidden layer present in the NN is utilized to extract features and present data and also find the relation between semantic words. In this research work, sentiments such as positive and negative have been analyzed in social media networks. The designed model is executed in MATLAB simulator with FFBPNN as a classifier which can identify sentiments of the stock market with higher accuracy. We also used different techniques in pre-processing steps that helps to extract features and also reduce the data size. To show the effectiveness of the designed system comparison with existing technique has also been performed which indicates that the proposed system has an accuracy of 9.36 % higher than existing work. This is because CS selects the unique features from different category of sentiment data. If uniqueness of features for different category is high, then classification accuracy is increased automatically by using FFBPNN as a classifier. So the experimental results proved that the designed model has achieved better accuracy with hybridization of CS and ANN.
In future, the work can be done to determine sentiments based on sarcasm and irony tweets. Further, word level and post level contextual information along with domain specific ontology can also be considered for the classification of the stock market tweets. The analysis of stocks can be done on the basis of months.
REFERENCES
1. N. Tabari, A. Seyeditabari, T. Peddi, M. Hadzikadic, & W. Zadrozny,
“A Comparison of Neural Network Methods for Accurate Sentiment Analysis of Stock Market Tweets,” in ECML PKDD, Springer, Cham, 2018 Workshops, pp. 51-65.
2. R. Ren, D. D. Wu, & T. Liu, “Forecasting Stock Market Movement
Direction Using Sentiment Analysis and Support Vector Machine,” IEEE Systems Journal, 2018, pp. 1-11.
3. Y. Ruan, A. Durresi, & L. Alfantoukh, ,“Using Twitter Trust Network
for Stock Market Analysis,” Knowledge-Based Systems, Elsevier,
4. S. Sakphoowadon, , N. Wisitpongphan, & C. Haruechaiyasak,
“Probabilistic Lexicon-Based Approach for Stock Market Prediction: A Case Study of the Stock Exchange of Thailand (SET),” in 2018 18th International Symposium on Communications and Information Technologies (ISCIT), 2018, pp. 383-388.
5. A. Agarwal, & D. Toshniwal, “Application of Lexicon Based
Approach in Sentiment Analysis for Short Tweets,” in 2018 International Conference on Advances in Computing and Communication Engineering (ICACCE), 2018, pp. 189-193.
6. S. L. Rose, R. Venkatesan, G. Pasupathy, & P. Swaradh, “A
Lexicon-Based Term Weighting Scheme for Emotion Identification of Tweets,” in International Journal of Data Analysis Techniques and Strategies, 2018, vol. 10, no. 4, pp. 369-380.
7. K. Chakraborty, S. Bhattacharyya, R. Bag, & A. E. Hassanien,
“Comparative sentiment analysis on a set of movie reviews using deep learning approach,” in International Conference on Advanced Machine Learning Technologies and Applications, Springer, Cham, 2018, pp. 311-318.
8. E. F. Fama, “Efficient Capital Markets: II,” The journal of finance,
Wiley Online Library, 1991vol. 46, no. 5, pp. 1575-1617.
9. S. Walczak, “An Empirical Analysis of Data Requirements for
Financial Forecasting with Neural Networks,” Journal of management information systems, 2001, vol. 17, no. 4, pp. 203-222.
10. B. Pang, & L. Lee, “ Opinion mining and sentiment analysis,”
Foundations and Trends in Information Retrieval, 2008vol. 2, no. 1–2, pp. 1-135.
11. J. Bollen, H. Mao, & X. Zeng, “Twitter Mood Predicts the Stock
Market,” Journal of computational science, 2011, vol. 2, no. 1, pp. 1-8, Elsevier.
12. T. H. Nguyen, & K. Shirai, “ Topic Modeling based Sentiment
Analysis on Social Media for Stock Market Prediction,” in Proceedings of the 53rd FFBPNNual Meeting of the Association for Computational Linguistics and the 7th International Joint Conference on Natural Language Processing, 2015, vol. 1, pp. 1354-1364.
13. R. Chen, & M. Lazer, “Sentiment Analysis of Twitter Feeds for the
Prediction of Stock Market Movement,” Stanford edu. Retrieved January, 2013, vol. 25, pp. 1-5.
14. R. Chiong, Z. Fan, Z. Hu, M. T. Adam, B. Lutz, & D. NeumFFBPNN,
“A sentiment analysis-based machine learning approach for financial market prediction via news disclosures,” in Proceedings of the Genetic and Evolutionary Computation Conference Companion, 2018, pp. 278-279.
15. V. S. Pagolu, K. N. Reddy, G. Panda, & B. Majhi, “Sentiment
Analysis of Twitter Data for Predicting Stock Market Movements,” in 2016 International Conference on Signal Processing, Communication, Power and Embedded System (SCOPES),2016, pp. 1345-1350.
16. A. C. Pandey, D. S. Rajpoot, & M. Saraswat, “Twitter Sentiment
Analysis using Hybrid Cuckoo Search Method,” Information Processing & Management, Elsevier, 2017, vol. 53, no. 4, pp. 764-779.
17. M. Ghiassi, J. Skinner, & D. Zimbra, “Twitter brand sentiment
analysis: A Hybrid System using n-gram Analysis and Dynamic Artificial Neural Network,” Expert Systems with applications, Elsevier, 2013, vol. 40, no. 16, pp. 6266-6282.
18. S. Sohangir, D. Wang, A. Pomeranets, & T. M Khoshgoftaar,” Big
Data: Deep Learning for Financial Sentiment Analysis”. Journal of Big Data, 2018, vol. 5, no. 1.
19. N. Petty, S. Sohangir, & D. Wang, “Financial Sentiment Lexicon
Analysis,” in 2018 IEEE 12th International Conference on Semantic Computing (ICSC,) IEEE, 2018, pp. 286-289.
AUTHORSPROFILE
Vani Kansal, M.E Scholar, Department of Computer Science, NITTTR, Chandigarh. B.tech form Punjabi
University Patiala.
Dr. Rakesh Kumar Ph.D. from NIT Kurukshetra. M.Tech. from GGS INDRAPRASTHA University,
Delhi. , B.Tech. from Punjab Technical
University,Jalandhar