Becoming an Employer of Choice in the
Infrastructure and Construction Sector
Sohan Mohanty
Abstract: Purpose of Research: The aim of the study was to
understand the perception of campus applicants towards employers in the Infrastructure and Construction related sectors. This research further explored, into measuring the extent to which these perceptions translated into employment preferences for the campus applicants. The objectives of the study were to (1) to understand the preference of campus applicants towards different employer-types, (2) to identify the job attributes that campus applicants seek in their prospective employers, (3) to analyse if job-preferences are based on demographics such as gender, work experience etc. An attempt was also made to compare and contrast the EmpAt scale developed by Berthon et al. (2005) in the Indian context.
Methodology:
Descriptive research was undertaken to explore the aforementioned research objectives. Data was collected through a mail-questionnaire administered on a sample comprising the final year students pursuing post-graduate management courses in NICMAR, Pune and RICS, Noida; two of the country’s premier Institutes offering niche courses in the Infrastructure and Construction related sectors. In all, 264 students had participated in the online survey. Various multivariate tools and techniques were used to evaluate and analyze the data collected. Findings:
The survey findings have helped identify those variables that determine a firm’s attractiveness as an employer of choice in the Infrastructure and Construction sector. Given that the survey was restricted to only the aforementioned Institutes, it has helped understand the sectoral specifics, as far as job preferences of campus applicants are concerned.
Implications:
By understanding the drivers and motivators of potential campus recruits, organisations will be better positioned to develop strategies to attract-retain the young workforce and consequently, nurture tomorrow’s leaders. It is worthwhile to understand the millennials, such that it helps Organizations to modify their workplace policies to suit the distinctive tastes, interests and preferences of the young workforce and become employers of choice.
Keywords: employer branding, employer of choice, job attributes, millennials
INTRODUCTION
According to the PwC’s 2017 CEO survey, Chief Executives considered the demand-supply talent gap, as the biggest challenge for their businesses. Fundamentally, the core of competitive advantage of any firm lies in the intellectual and human capital that it possesses (Berthon et al., 2005). This is forcing organisations to compete and position themselves over their competitors as better employers, thereby enhancing their competitiveness (Rampl, 2014). Therefore, a firm’s ability to attract and retain talent becomes fundamental to its success in the marketplace.
Revised Manuscript Received on September 10, 2019.
Sohan Mohanty, Symbiosis International (Deemed University) (SIU), Pune, India, E-Mail: [email protected]
Today’s competitive environment is forcing employers to take cognisance of, and constantly adapt to the evolving trends such that they are perceived as a desirable place to pursue a career. Organisational strategies are getting heavily inclined towards developing strong ‘employer brands’, primarily to attract prospective recruits and to retain existing employees. Building an employer brand, creating an effective employer value proposition and becoming an employer of choice necessitate the recognition and development of the human capital within a firm (Martin et al., 2005).
Behling et al. (1968) had studied those variables that influence applicant decision-making process, employer attractiveness, and job-choice behaviour. Behling et al. (1968) said that applicants will evaluate an employer on the basis of job-characteristics and work-environment, to determine whether or, not, the job and the organisation will meet their expectations. Subsequently, various studies have been conducted to understand applicant behaviour (e.g., Harris and Fink, 1987; Rynes et al., 1997; Collins and Han, 2004; Collins, 2007). It is a known fact that a favourable employer brand positively influences applicant behaviour, which is why it is important for an organisation to position itself as a preferred employer (Backhaus & Tikoo, 2004; Ployhart, 2006).
A Dun & Bradstreet study on the Construction industry has revealed that one of the major shortcomings of the industry is the lack of managerial competence. It is largely understood that owing to site hardships and work-life imbalance, the Infrastructure and Construction sector does not attract many talented and skilled professionals. Sadly, this aspect of the Construction Industry extends across the globe, as well. Companies operating in the construction sector need to be ingenuous to compete and remain relevant in this global inter-sector market (Sedighi & Loosemore, 2012). Further, The Great Place to Work Report – 2018, had a mere 2 percent representation in the Top 100 Companies, from the Construction, Infrastructure and Real Estate sector. While the Indian Construction sector happens to be the second largest employer in India, next only to agriculture, little research exists in the area of employer branding. Attracting prospective employees with talent and projecting the right employer brand image are crucial for becoming an employer of choice in the Construction Industry.
two of India’s premier Institutes offering niche courses in the Infrastructure and Construction domain. This study in an Indian setting is an attempt to understand the perception of professionals towards employers in the Construction Industry. The study investigates those factors that influence the choice decision of campus applicants, with prospective employers in mind, typically, from the Infrastructure and Construction sector.
LITERATURE REVIEW
Organizations, the world over are now engaged in a ‘war for talent’ to attract and retain employees. Most employers would agree that being a compelling employer brand makes this job of attracting and retaining employees, only easier and better. In other words, the brand plays a crucial role in the applicant’s decision-making, while choosing an employer. Many studies have proved the importance of a strong employer brand and how it helps in reducing costs, improving customer satisfaction and yielding better margins for a firm.
Much attention therefore, has been directed towards examining the crucial importance of employer brand and the associated concepts of employer image and employer attractiveness (Ambler and Barrow, 1996; Cable and Turban, 2003; Turban, Forret, and Hendrickson, 1998). Also, past studies suggest the construct of an employer brand and how an employer could become an attractive company with a strong brand (C. J. Collins and Stevens, 2001, 2002).
Few studies have found close association between employer brand dimensions and the employer of choice (EOC) construct (Rampl, 2014; Tanwar and Kumar, 2019). According to Branham (2005), employer branding is a process of applying traditional marketing principles to achieving the status of Employer of Choice. An employer of choice (EOC) means that the company has been able to create an image of being a great place to work in the mind of the prospective applicant pool (Tanwar and Kumar, 2019). An employer of choice therefore, refers to an organization where top talent aspires to work for, as a result of its corporate reputation and employer image.
An employer brand is viewed as a bundle of “functional, economic, and psychological benefits provided by an employing company” (Ambler and Barrow, 1996). While many studies in the past have delved on the construct of the employer brand (Arachchige and Robertson, 2008; Tuzuner and Yuksel, 2009; Srivastava and Bhatnagar, 2010; Alnıaçık and Alnıaçık, 2012; Hillebrandt and Ivens, 2013; Zhu et al., 2014), however, it is believed that these studies have certain limitations such that it demands further research to develop an employer brand scale, that is reliable and valid. While the above scales possess few limitations, the scale developed by Berthon et al. (2005), has been found to be popular and robust in the context of the employer brand. Berthon et al. (2005) developed their 25-item “EmpAt” scale by adopting the Ambler and Barrow (1996) framework. This particular scale has been found to be conceptually and statistically strong and has confirmed not only the three dimensions; functional, economic and psychological (Ambler and Barrow), but also discovered two new ones. The limitation of this scale however, is that it has been developed by
studying a sample comprising final-year students possessing limited work experience. Nevertheless, owing to its reliability and validity, this scale has been adopted by various researchers to measure the employer brand in their respective studies.
Although employer branding is vitally important to attract potential employees, no specific research has been conducted to understand perceptions of management students towards prospective employers in the Infrastructure and Construction Industry, more so in the Indian context. Moreover, crucial factors that influence potential employer branding in the infrastructure and construction industry have not been determined so far. The present study attempts to fill the gaps in the extant literature.
RESEARCH METHODOLOGY
It is believed that campus applicants are equally discerning while choosing the right organisation as much as choosing the right job. Projecting an attractive employer image helps an organization attract the right pool of applicants on campus. This would however, necessitate understanding the tastes, interests and preferences of campus applicants. This study aims to understand the expectations of final year post-graduates who are currently pursuing a degree in a Construction related course at one of the two premier Institutes; NICMAR, Pune and RICS, Noida and would be entering the Construction and Infrastructure sector in six months’ time. An attempt has been made to understand their perceptions of the job market; their preferred employers, employment attributes they seek in their prospective employers and what job preferences do they have, if any.
Objectives
This study examines the prospective employees’ (student job-seekers) perception of companies operating in the Infrastructure and Construction Industry, where they seek to work upon course-completion. This research also attempts to identify those job-attributes preferred by campus applicants. Further, the study also analyses the effects of demographics such as gender and work experience on job-preferences, if any.
The objectives of the study are (1) to understand the preference of campus applicants towards different employer-types, (2) to identify the job attributes that campus applicants seek in their prospective employers, (3) to analyse if job-preferences are based on demographics such as gender, work experience etc. An attempt is also being made to compare and contrast the EmpAt scale developed by Berthon et al. (2005) in the Indian context.
Questionnaire and Scale
This necessitated the adoption of an effective scale to capture various aspects of potential campus applicants.
This study aimed to understand the employer preferences of post-graduate students, who were in the final year of the course and about to enter the workforce, soon. The employer attractiveness scale (EmpAt) developed by Berthon et al. (2005) was adopted for this study. The 25 item-scale developed by Berthon et al. (2005) and subsumed under five (5) factors is considered to be more refined than the employer brand construct proposed by Ambler and Barrow (1996).
The questionnaire for this study was comprised of two sections. Respondents were to rank their top-three preferred employer-types in Section One. The featured options under ‘Employer Type’ were Large Indian Contracting Firm, Large MNC Contracting Firm, Indian Consulting Firm, Global Consulting Firm, Real Estate Developer, Project Management Consultant, Central / State Government Construction and Indian PSU Construction Company. Section Two covered the 25 items of the EmpAt scale proposed by Berthon et al. (2005) and these were measured on a five-point Likert scale (1 = Least Important, 2 = Not So Important, 3 = Neutral, 4 = Important, and 5 = Very Important)
The demographic variables viz., age, gender, work experience, engineering branch and academic course pursued, were obtained through single items in the questionnaire.
Survey Method
To explore and understand the preferences of the representative sample, an electronic survey was undertaken at the two Institutes of India; NICMAR, Pune and RICS, Noida. The final year post-graduate students, who took part in the survey, were expected to join any infrastructure / construction firm, post completion of their course. To this end, the Training and Placement Officers (TPO) of the Institutes were contacted and questionnaires mailed to all the final year students pursuing a Construction Management or, a related course, at these two Institutes.
The online questionnaire was administered on a mix of 264 post- graduates, in their final-year of study at NICMAR, Pune and RICS, Noida. From a total of 264 online respondents, only 227 fully-completed and valid questionnaires were obtained. There by, resulting in an effective response rate of 86 percent, only. Descriptive Research was undertaken to explore the research objectives, listed earlier. The investigation was guided by the following research questions:
RQ 1: Which types of employers are preferred by applicants at the two Institutes?
RQ 2: What are the important job-attributes that campus applicants seek in prospective employers?
RQ 3: What are the job-related perceptions of campus applicants?
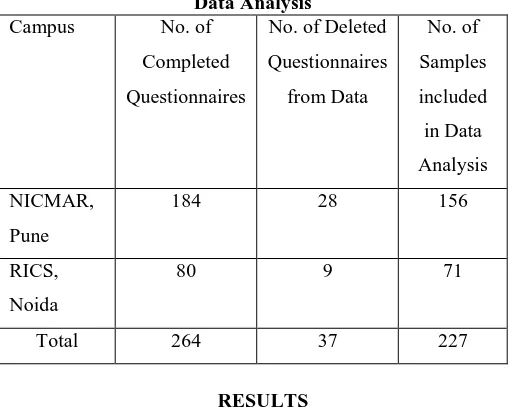
[image:3.595.300.555.200.405.2]The sample is a sound representation of the population of post-graduate students who have specialised in a Construction related course, thereby reinforcing their intention to work in the Infrastructure and Construction Sector, post completion of the Course. Table – 1 summarizes the sample data considered for the study.
Table No. 1 - Summary of Sample Size Included in Data Analysis
Campus No. of Completed Questionnaires
No. of Deleted Questionnaires
from Data
No. of Samples included in Data Analysis NICMAR,
Pune
184 28 156
RICS, Noida
80 9 71
Total 264 37 227
RESULTS
The data collected from the sample was analysed with the help of SPSS package and the results are as below: -
Demographic Characteristics
Out of the 227 respondents, only 20 were female and 85 had some work experience ranging between 1 – 5 years. No student had work experience greater than 5 years. The age of the respondents fell within the range 22 - 28 years. The demographic composition of the 227 respondents is tabulated and presented in Appendix – 1.
Employer-type preferences
Study of job-attributes
A Principle Component Factor Analysis using orthogonal rotation was carried out on the survey data to determine the underlying structure of the job attributes sought in prospective employers. Factor Analysis was used to identify those factors that influence the choice decision of new employees entering the workforce population.
Interpreting the Factor Analysis
[image:4.595.86.523.49.355.2] [image:4.595.309.555.434.700.2]The reliability of the factor analysis output was measured as Cronbach’s Alpha equal to 0.958 (Table No. 2), indicating the output as highly reliable. Further, the Kaiser-Meyer-Olkin, measure of sampling adequacy had a value of 0.937 (see Appendix-2). As the KMO value is greater than 0.5, it shows that factor analysis was appropriate.
Table No. 2: Reliability Statistics
Cronbach's Alpha
N of Items
.958
25
The Factor Analysis output resulted in three factors accounting for 59.69% of the variance in the data. Three factors, all having an eigenvalue greater than ‘1’ emerged as per Table No. 3. All factor loadings greater than 0.6 were included in the relevant factor. The first factor, ‘Functional’ subsumed nine (9) variables and has accounted for 26.072% of the variance. The second factor ‘Economic’ accounted for 16.847% of the variance and has subsumed only three (3) variables whereas, the third factor ‘Psychological’ accounted for 16.771 of the variance and has subsumed only four (4) variables.
Three factors were extracted as shown in the Table below. • Factor 1, covered all those variables which were functional in nature
• Factor 2, consisted of variables associated with economic well-being
• Factor 3, could be termed as psychological as it included intangible variables such as feelings and appreciation
Table No. 3: The 3 Factors The Three (3) Factors
Functional Economic Psychological Having a
good relationship with your colleagues
Job security within the organization
Recognition/appreciatio n from management
Supportive and
encouraging colleagues
An above average basic salary
Feeling good about yourself as a result of working for a particular organization
Working in an exciting environment
An attractive overall compensation package
Feeling more self-confident as a result of working for a particular organization
The
organization produces high-quality products and services
[image:4.595.66.254.561.618.2]The
organization produces innovative products and services Humanitarian organization – gives back to society Opportunity to teach others what you have learned Acceptance and belonging The
organization is customer-oriented
Out of the 25 variables identified and utilized in the questionnaire, only 16 variables had factor loadings greater than equal to 0.6. Therefore, only 16 variables out of the original 25 (Berthon et al., 2005) were found to be relevant for this study (as illustrated in the above Table No. 3) and were included for further analysis. Nine (9) variables, each having factor loading less than 0.6 could not be subsumed under any of the above three factors and have been excluded from further analysis.
The output of the Factor Analysis in SPSS is exhibited in Appendix- 2.
Other Statistical Tests: t-test and ANOVA
[image:5.595.54.295.47.307.2]An attempt was made to conduct few other statistical tests on the 16 items constituting the three factors that have emerged post the Factor Analysis. To check internal consistency among the nine variables constituting Factor-1 (Functional), a reliability analysis was conducted. Cronbach’s coefficient alpha value was 0.916, which is good for use. Similarly, reliability analysis was done for the 3 items subsumed under Factor – 2 (Economic) and 4 items subsumed under Factor-3 (Psychological). The resulting reliability coefficients have turned out to be sufficient for research purposes, as they are greater than 0.6 (Nunnally, 1978), and shown in the table below.
Table No.4: Reliability Coefficients*
Scale
Reliability
Coefficient
Functional
0.916
Economic
0.816
Psychological
0.812
*See Appendix – 3 for the Reliability Analysis of the Factors
One of the study objectives was to analyse if job-preferences were based on demographics such as gender and
work experience. To test the same, the following hypotheses were formulated.
H1. There will be significant difference in students’ perceptions of the employer characteristics between male and female students (gender).
H2. There will be significant difference in students’ perceptions of the employer characteristics based on the amount of students’ work experiences.
Independent t-test: Gender
To determine the preference of Males vis-à-vis Females, a two-independent – samples t test was conducted. Further, independent t-tests and Levene’s test for equality of variance was carried out in the sample sub-category: gender. The results are presented in the Table No.5, as below. Note that the F test of sample variances has a probability less than 0.05 for only four items out of the 16 items, as presented in the table below. Accordingly, the null hypothesis is rejected, and the t test based on the “equal variances not assumed” is used. On further analysis, it emerged that the null hypothesis of equal means is rejected for the said 4 items too. When independent sample t-tests were conducted on the ‘gender’ variable, significant differences between female and male respondents emerged, as captured in Table No. 5. Female respondents have rated these specific job attributes as more ‘important’ than the male respondents, as evident from their higher mean scores.
Table No. 5: Independent Sample t-test (Gender)
Items
T-test for equality of
means Sig. (2-tailed)
Mean Scores
Job security within the
organization 0.004
Male – 4.31 Female – 4.75
Recognition/appreciation from
management 0.000
Male – 4.35 Female – 4.85 Feeling more self-confident as a
result of working for a particular organization
0.013
Male – 4.39 Female – 4.75 Gaining career-enhancing
experience 0.000
Male – 4.64 Female – 4.95 * For the comprehensive results on the t-tests and Levene’s test, refer Appendix -4
ANOVA: Work Experience
[image:5.595.56.271.621.734.2]Since there were four populations, analysis of variance (ANOVA) was conducted. The null hypothesis, typically, is that all means are equal. From the F Distribution Table (Statistical), we see that for 3 and 223 degrees of freedom, the critical value of F is 2.60 for α = 0.05. Since, the calculated value of ‘F’ (values under ‘F’ column in Appendix – 5) is smaller than the critical value (2.60 from F Distribution Table), we do not reject the null hypothesis. It is therefore concluded that the one-way ANOVA test did not yield any significant results as evident from the SPSS output presented in Appendix – 5
DISCUSSION
It is interesting to note that while the ‘EmpAt’ scale involving the same set of 25 variables in the study done by Berthon et al. (2005) resulted in five factors viz., Interest Value, Social Value, Economic Value, Development Value and Application Value, this particular study has resulted in three factors, resonating more with the research outcomes of Ambler and Barrow (1996).
An independent sample t-test was done to check difference in perceptions, basis gender. It was found that female respondents consistently rated four (4) job-characteristics (see Table No.5) as more ‘important’ than did the male respondents. Male and female respondents did not exhibit significant difference of perceptions over the remaining twelve (12) items.
The ANOVA test performed to check difference in perceptions based on the amount of work-experience did not produce any significant results. Meaning, work experience did not influence perceptions about employer characteristics. When compared to the Berthon et al. (2005) study, this particular study had few observable differences and it could be accounted for the following:-
• While Berthon et al. (2005) conducted their study in Australian campuses, this study was conducted at two Indian campuses. The difference in the outcomes could be attributable to possible cultural differences between sample respondents belonging to two different nationalities.
• Both the study samples were drawn from a population representing the final year students, who were to join the workforce soon. While Berthon et al. (2005) had a sample consisting students pursuing business management students, this study involved a sample comprising students pursuing a construction / infrastructure related management course.
• Since this particular survey-study was done almost fourteen (14) years after the Berthon et al. (2005) study got completed, differences arising out of generational cohorts cannot be ruled out.
CONCLUSION
With reference to the research objectives laid down at the beginning of the study, it can be stated that this study has helped identify those job attributes that are valued by campus applicants. Further, this research has helped identify the employment preferences of the young workforce segment about to join the Infrastructure and Construction Industry. Forward looking organizations will be able to engage better with younger campus recruits once they start appreciating their tastes and preferences. Organizations that
are able to adapt to the evolving tastes and preferences of the young workforce will be able to attract and retain talent from campuses, effectively. This study will help those HR Managers who wish to modify their talent acquisition strategy from campuses. This study provides vital cues for HR / OD professionals to refine their employer value proposition to young prospective employees at campuses. Here, in this research, the outcomes from the study of preferred job attributes has certainly opened up research vistas related to the areas of employer branding and employee engagement.
LIMITATIONS AND SCOPE FOR FUTURE RESEARCH
The study was carried out at two Institutes offering niche courses in the Construction and Infrastructure sectors. Therefore, generalisation of the study outcomes to other campus applicants say, general management, pharmaceutical sciences or, journalism students may not be appropriate. Moreover, the sample comprised students, who were in the final-year of their post-graduation course.
Another limitation of this study was the ‘as-is’ adoption of the EmpAt scale, without any further psychometric testing. Berthon et al (2005) recommend use of the EmpAt scale cross-nationally, only after further psychometric testing. Also, the EmpAt scale developed in 2005, may not be relevant for today’s campus applicants viz., Gen Z and the Millennials. As a generation, Millennials are considered to have grown up using technology as part of their everyday lives, and are likely to expect their employers to provide them with the same tools to collaborate and network on the job as they did in their personal sphere (Meister and Willyerd, 2010). The EmpAt scale is limited in terms of addressing this particular need of the technology-savvy generation.
Further, even though the sample size of 227 respondents may have been adequate to base the research findings, a larger sample would have been appropriate for generalization and validation in the context of the Indian Infrastructure and Construction sectors. Since the study was limited to a sample comprising only college students, job-related perceptions would have been a restricted one, as students are expected to possess very limited or, negligible work experience. Going forward, studying an experienced workforce, would produce a better picture of the sought for ‘employer image’.
Various researches on employer branding have identified variables like ethics, diversity, work-life balance, CSR, work culture, environmental reputation as important construct-items of the employer brand (Agrawal and Swaroop, 2009; Iacovou et al., 2011; Tanwar and Kumar, 2019). In terms of the future direction, it may be worthwhile to explore broadening the employer attractiveness (EmpAt) construct, by adding current and relevant variables.
It may be interesting to study the effects of social media on the employer brand too.
Further, the role of existing employees may be studied to determine their influence on the employer brand, in the Infrastructure and Construction Industry.
Appendix – 1: Demographic Characteristics (N=227)
S/No Characteristics Description N Statistics (%)
1 Institute
NICMAR,
Pune 156
68.3
RICS, Noida 71 31.7
2 Gender
Male 207 91.2
Female 20 8.8
3 Work
Experience
Zero 142 62.6
< 1 Year 33 14.5 1 - 2 years 38 16.7 2 - 5 Years 14 6.2
4
Branch of Engineering
during graduation
Civil 212 93.4
Mechanical 9
6.6 Electrical 1
Architecture 3 Construction Tech & Management
2
5
Course Pursued (Post
Graduate)
ACM 105 46.3
PEM 30 13.2
REUIM 14 6.17
IFDM 7 3.03
CPM 56 24.7
CE&QS 15 6.6 Note: Respondents were pursuing the Courses as below:
Post Graduate courses at NICMAR, Pune
MBA Courses at RICS, Noida
ACM – Advanced Construction Management PEM – Project Engineering and Management
REUIM – Real Estate and Urban Infrastructure Management
IFDM – Infrastructure Finance, Development and Management
CPM – Construction Project Management CE&QS – Construction Economics and Quantity Surveying
Appendix – 2: Factor Analysis Factor Analysis Output
KMO and Bartlett's Test
Kaiser-Meyer-Olkin Measure of Sampling
Adequacy. .937
Bartlett's Test of
Sphericity
Approx.
Chi-Square
3895.360
df 300
Sig. .000
Total Variance Explained Com
pone
nt
Initial Eigenvalues Rotation Sums of Squared
Loadings
Total % of
Variance
Cumulative
%
Total % of
Variance Cumul
ative %
1 12.561 50.245 50.245 6.518 26.072 26.072
2 1.254 5.018 55.263 4.212 16.847 42.919
3 1.107 4.427 59.690 4.193 16.771 59.690
4 .977 3.909 63.599
5 .914 3.656 67.255
6 .855 3.421 70.676
7 .770 3.079 73.755
8 .715 2.861 76.617
9 .677 2.706 79.323
10 .598 2.391 81.714
11 .525 2.102 83.816
12 .508 2.031 85.847
13 .422 1.687 87.534
14 .394 1.577 89.111
15 .358 1.433 90.544
16 .338 1.352 91.897
17 .332 1.329 93.226
18 .291 1.162 94.388
19 .283 1.131 95.519
20 .248 .992 96.511
21 .215 .859 97.369
22 .200 .799 98.169
23 .182 .727 98.896
24 .156 .622 99.518
25 .120 .482 100.000
Rotated Component Matrixa
Component
1 2 3
Recognition/appreciation from
management .146 .381 .605
A fun working environment .321 .435 .256 A springboard for future
employment .189 .447 .441
Feeling good about yourself as a result of working for a particular organization
.345 .211 .682
Feeling more self-confident as a result of working for a particular organization
.322 .235 .691
Gaining career-enhancing
experience .184 .285 .724
Having a good relationship
with your superiors .541 .171 .508 Having a good relationship
with your colleagues .615 .117 .502 Supportive and encouraging
colleagues .655 .150 .437
Working in an exciting
environment .604 .229 .419
Innovative employer – novel work practices / forward-thinking
.544 .189 .434
The organization both values and makes use of your creativity
.486 .361 .435
The organization produces high-quality products and services
.673 .311 .219
The organization produces innovative products and services
.716 .319 .191
Good promotion opportunities
within the organization .482 .450 .321 Humanitarian organization –
gives back to society .755 .201 .192 Opportunity to apply what was
learned .591 .309 .387
Opportunity to teach others
what you have learned .642 .415 .211 Acceptance and belonging .651 .321 .346 The organization is
customer-orientted .707 .357
Job security within the
organization .357 .630 .273
Hands-on inter-departmental
experience .465 .572 .164
Happy work environment .478 .556 .277
An above average basic salary .188 .784 .281 An attractive overall
compensation package .212 .792 .202 Extraction Method: Principal Component Analysis. Rotation Method: Varimax with Kaiser Normalization. a. Rotation converged in 9 iterations.
Appendix – 3: Reliability Analysis for Factors
Factor Items Cron
bach ‘Alp ha”
Functional
Having a good relationship with your colleagues
Supportive and encouraging colleagues
Working in an exciting environment
The organization produces high-quality products and services
The organization produces innovative products and services
Humanitarian organization – gives back to society
Opportunity to teach others what you have learned
Acceptance and belonging
The organization is customer-oriented
0.916
Economic
Job security within the organization
An above average basic salary
An attractive overall compensation package
0.816
Psychological
Recognition/appreciation from management
Feeling good about yourself as a result of working for a particular
organization
Feeling more self-confident as a result of working for a particular
organization
Gaining career-enhancing experience
Appendix - 4: Independent Sample t-test (Gender) Levene's Test for Equality of Variances
t-test for Equality of Means
F Sig. t df Sig.
(2-tailed)
Having a good relationship with your colleagues
Equal variances assumed 2.837 .094 -2.014 225 .045 Equal variances not
assumed -3.008 30.068 .005
Supportive and encouraging colleagues
Equal variances assumed 1.259 .263 -1.287 225 .199 Equal variances not
assumed -1.866 29.170 .072
Working in an exciting environment
Equal variances assumed 1.705 .193 -1.496 225 .136 Equal variances not
assumed -2.346 31.762 .025
The organization produces high-quality products and services
Equal variances assumed .045 .833 -.591 225 .555 Equal variances not
assumed -.647 23.807 .524
The organization produces innovative products and services
Equal variances assumed .144 .705 -1.254 225 .211 Equal variances not
assumed -1.400 24.063 .174
Humanitarian organization – gives back to society
Equal variances assumed 2.823 .094 -1.652 225 .100 Equal variances not
assumed -2.541 31.057 .016
Opportunity to teach others what you have learned
Equal variances assumed 1.762 .186 -.342 225 .733 Equal variances not
assumed -.445 26.563 .660
Acceptance and belonging
Equal variances assumed .245 .621 -2.041 225 .042 Equal variances not
assumed -2.408 24.837 .024
The organization is customer-orientated
Equal variances assumed 1.266 .262 -1.946 225 .053 Equal variances not
assumed -2.629 27.358 .014
Job security within the organization
Equal variances assumed 7.684 .006 -2.057 225 .041 Equal variances not
assumed -3.137 30.756 .004
An above average basic salary
Equal variances assumed 3.596 .059 -.461 225 .645 Equal variances not
An attractive overall compensation package
Equal variances assumed 1.741 .188 -.431 225 .667 Equal variances not
assumed -.558 26.469 .582
Recognition/appreciation from management
Equal variances assumed 11.819 .001 -2.694 225 .008 Equal variances not
assumed -4.991 40.734 .000
Feeling good about yourself as a result of working for a particular organization
Equal variances assumed 2.829 .094 -1.633 225 .104 Equal variances not
assumed -2.233 27.639 .034
Feeling more self-confident as a result of working for a particular organization
Equal variances assumed 5.117 .025 -2.007 225 .046 Equal variances not
assumed -2.668 27.002 .013
Gaining career-enhancing experience
Equal variances assumed 16.708 .000 -2.034 225 .043 Equal variances not
assumed -4.533 63.758 .000
Appendix – 5: ANOVA (Work Experience)
Sum of
Squares
df Mean
Square
F Sig.
Having a good relationship with your colleagues
Between Groups .352 3 .117 .186 .906
Within Groups 140.441 223 .630
Total 140.793 226
Supportive and encouraging colleagues
Between Groups .597 3 .199 .317 .813
Within Groups 140.028 223 .628
Total 140.626 226
Working in an exciting environment
Between Groups .454 3 .151 .197 .899
Within Groups 171.845 223 .771
Total 172.300 226
The organization produces high-quality products and services
Between Groups 1.413 3 .471 .553 .647
Within Groups 189.997 223 .852
Total 191.410 226
The organization produces innovative products and services
Between Groups .872 3 .291 .350 .789
Within Groups 185.384 223 .831
Total 186.256 226
Humanitarian organization – gives back to society
Between Groups 2.720 3 .907 .996 .396
Within Groups 202.998 223 .910
Total 205.718 226
Opportunity to teach others what you have learned
Between Groups .705 3 .235 .284 .837
Within Groups 184.705 223 .828
Acceptance and belonging
Between Groups .335 3 .112 .159 .924
Within Groups 156.519 223 .702
Total 156.855 226
The organization is customer-orientated
Between Groups .379 3 .126 .133 .940
Within Groups 211.621 223 .949
Total 212.000 226
Job security within the organization
Between Groups .191 3 .064 .076 .973
Within Groups 187.616 223 .841
Total 187.806 226
An above average basic salary
Between Groups 2.217 3 .739 1.222 .302
Within Groups 134.849 223 .605
Total 137.066 226
An attractive overall compensation package
Between Groups 1.031 3 .344 .529 .663
Within Groups 144.846 223 .650
Total 145.877 226
Recognition/appreciation from management
Between Groups 3.887 3 1.296 2.058 .107
Within Groups 140.430 223 .630
Total 144.317 226
Feeling good about yourself as a result of working for a particular organization
Between Groups 1.095 3 .365 .536 .658
Within Groups 151.980 223 .682
Total 153.075 226
Feeling more self-confident as a result of working for a particular organization
Between Groups .064 3 .021 .035 .991
Within Groups 133.337 223 .598
Total 133.401 226
Gaining career-enhancing experience
Between Groups .588 3 .196 .446 .720
Within Groups 97.967 223 .439
Total 98.555 226
REFERENCES
1. Aaker, D. A. (2009). Managing brand equity. Simon and Schuster.
2. Aaker, D. A., & Joachimsthaler, E. (2000). The brand relationship spectrum: The key to the brand architecture challenge. California management review, 42(4), 8-23. 3. Agrawal, R. K., & Swaroop, P. (2009). Effect of
employer brand image on application intentions of B-school undergraduates. Vision: The Journal of Business Perspective, 13(3), 41-49.
4. Alnıaçık, E., & Alnıaçık, Ü. (2012). Identifying dimensions of attractiveness in employer branding: effects of age, gender, and current employment status. Procedia-Social and Behavioral Sciences, 58, 1336-1343. 5. Ambler, T., & Barrow, S. (1996). The employer brand.
Journal of brand management, 4(3), 185-206.
6. Arachchige, B. J., & Robertson, A. (2011). Business student perceptions of a preferred employer: A study identifying determinants of employer branding. The IUP Journal of Brand Management, 8(3), 25-46.
7. Backhaus, K., & Tikoo, S. (2004). Conceptualizing and researching employer branding. Career development international, 9(5), 501-517.
8. Barber, A. E. (1998). Recruiting employees: Individual and organizational perspectives (Vol. 8). Sage Publications.
9. Barrow, S., & Mosley, R. (2005). The employer brand. England: John Wiley&Sons Ltd, 132-145.
10. Behling, O., Labovitz, G., & Gainer, M. (1968). College recruiting: A theoretical basis. Personnel Journal, 47, 13– 19.
11. Bellou, V., Chaniotakis, I., Kehagias, I., & Rigopoulou, I. (2015). Employer brand of choice: an employee perspective. Journal of Business Economics and Management, 16(6), 1201-1215.
13. Branham, L. (2005). Planning to become an employer of choice. Journal of Organizational Excellence, 24(3), 57-68.
14. Burmann, C., Schaefer, K., & Maloney, P. (2008). Industry image: Its impact on the brand image of potential employees. The Journal of Brand Management, 15(3), 157–176.
15. Cable, D. M., & Turban, D. B. (2003). The value of organizational reputation in the recruitment context: A brand‐equity perspective. Journal of Applied Social Psychology, 33(11), 2244-2266.
16. Catanzaro, D., Moore, H., & Marshall, T. R. (2010). The impact of organizational culture on attraction and recruitment of job applicants. Journal of business and psychology, 25(4), 649-662.
17. Chapman, D.S, Uggerslev,K.L, Carroll,S.A, Piasentin, K.A, and Jones, D.A, (2005). Applicant Attraction to Organizations and Job Choice: A Meta-Analytic Review of the Correlates of Recruiting Outcomes. Journal of Applied Psychology 90(5) 928–944
18. Christiaans, L. (2012). International Employer Brand Management: A Multilevel Analysis and Segmentation of Students' Preferences. Springer Science & Business Media.
19. Collins, C. J. (2007). The interactive effects of recruitment practices and product awareness on job seekers' employer knowledge and application behaviors. Journal of applied psychology, 92(1), 180.
20. Collins, C. J., & Han, J. (2004). Exploring applicant pool quantity and quality: The effects of early recruitment practice strategies, corporate advertising, and firm reputation. Personnel psychology, 57(3), 685-717. 21. Collins, C. J., & Stevens, C. K. (2002). The relationship
between early recruitment-related activities and the application decisions of new labor-market entrants: a brand equity approach to recruitment. Journal of applied psychology, 87(6), 1121.
22. Davies, G. (2008). Employer branding and its influence on managers. European Journal of Marketing, 42(5/6), 667–681.
23. Davison, H. K., Maraist, C., & Bing, M. N. (2011). Friend or foe? The promise and pitfalls of using social networking sites for HR decisions. Journal of Business and Psychology, 26(2), 153-159.
24. Devendorf, S. A., & Highhouse, S. (2008). Applicant– employee similarity and attraction to an employer. Journal of Occupational and Organizational Psychology, 81(4), 607-617.
25. Edwards, M. R. (2009). An integrative review of employer branding and OB theory. Personnel review, 39(1), 5-23.
26. Ewing, M. T., Pitt, L. F., de Bussy, N. M., & Berthon, P. (2002). Employment branding in the knowledge economy. International Journal of Advertising, 21(1), 3– 22.
27. Foster, C., Punjaisri, K., & Cheng, R. (2010). Exploring the relationship between corporate, internal and employer branding. Journal of Product & Brand Management, 19(6), 401-409.
28. Gatewood, R. D., Gowan, M. A., & Lautenschlager, G. J. (1993). Corporate image, recruitment image and initial job choice decisions. Academy of Management journal, 36(2), 414-427.
29. Gehrels, S. A., & de Looij, J. (2011). Employer branding: A new approach for the hospitality industry. Research in Hospitality Management, 1(1), 43-52.
30. Great Place to Work;
https://www.greatplacetowork.in/best-work-places/best-companies-to-work-for-2018/ Website accessed on 22 May, 2019.
31. Grunig, J. (1993) ‘Image and substance: from symbolic to behavioural relationships’,
32. Harold, C. M., & Ployhart, R. E. (2008). What do applicants want? Examining changes in attribute judgments over time. Journal of Occupational and Organizational Psychology, 81(2), 191-218.
33. Harris, M. M., & Fink, L. S. (1987). A field study of applicant reactions to employment opportunities: Does the recruiter make a difference?. Personnel Psychology, 40(4), 765-784.
34. Herman, R. E., & Gioia, J. L. (2000). How to become an employer of choice. Oak Hill Publishing Company. 35. Hieronimus, F., Schaefer, K., & Schroder, J. (2005).
Using branding to attract talent. The McKinsey Quarterly, 3, 12-14.
36. Highhouse, S., Lievens, F., & Sinar, E. F. (2003). Measuring attraction to organizations. Educational and psychological Measurement, 63(6), 986-1001.
37. Hillebrandt, I., & Ivens, B. S. (2013). Measuring employer brands: an examination of the factor structure, scale reliability and validity. In 2013 Winter Marketing Educators Conference.Schlager et al., 2011,
38. Iacovou, C. L., Shirland, L., & Thompson, R. L. (2011). Job selection preferences of business students. Journal of Applied Business Research (JABR), 20(1).
39. Jain, N., & Bhatt, P. (2015). Employment preferences of
job applicants: unfolding employer branding
determinants. Journal of Management Development, 34(6).
40. Jiang, T., & Iles, P. (2011). Employer-brand equity, organizational attractiveness and talent management in the Zhejiang private sector, China. Journal of Technology Management in China, 6(1), 97-110. 41. Johnson, M. (2000). Winning the people wars: Talent
and the battle for human capital. Prentice Hall.
42. Judge, T. A., & Cable, D. M. (1997). Applicant personality, organizational culture, and organization attraction. Personnel Psychology, 50(2), 359-394. 43. Kapferer, J.-N. (2008). The New Strategic Brand
Management: Creating and Sustaining Brand Equity Long Term (4th ed.). London: Kogan Page
44. Karp, H., Fuller, C. and Sirias, D. (2002). Bridging the Boomer-Xer Gap: Creating Authentic Teams for High Performance at Work, Intercultural Press
45. Keller, K. L. (1993). Conceptualizing, measuring, and managing customer-based brand equity. the Journal of Marketing, 1-22.
46. Keller, K. L. (2008). Strategic Brand Management (3rd ed.). Upper Saddle River, NJ: Prentice Hall.
47. Knox, S., & Freeman, C. (2006). Measuring and managing employer brand image in the service industry. Journal of Marketing Management, 22(7-8), 695-716. 48. Kucherov, D., & Zavyalova, E. (2012). HRD practices
and talent management in the companies with the employer brand. European Journal of Training and Development, 36(1), 86-104.
49. Lievens, F. (2007). Employer branding in the Belgian Army: The importance of instrumental and symbolic beliefs for potential applicants, actual applicants, and military employees. Human Resource Management, 46(1), 51-69.
51. Lievens, F., Hoye, G., & Schreurs, B. (2005). Examining
the relationship between employer knowledge
dimensions and organizational attractiveness: An application in a military context. Journal of Occupational and Organizational Psychology, 78(4), 553-572.
52. Lievens, F., Van Hoye, G., & Anseel, F. (2007). Organizational identity and employer image: towards a unifying framework. British Journal of Management, 18(s1), S45-S59.
53. Lloyd, S. (2002). Branding from the inside out. Business Review Weekly, 24(10), 64-66.
54. Madera, J. M. (2012). Using social networking websites as a selection tool: The role of selection process fairness and job pursuit intentions. International Journal of Hospitality Management, 31(4), 1276-1282.
55. Mangold, W. G., & Miles, S. J. (2007). The employee brand: Is yours an all-star?. Business Horizons, 50(5), 423-433.
56. Martin, G., & Hetrick, S. (2009). Employer branding and corporate reputation management in an international context. Handbook of International Human Resource Management. Integrating People, Process, and Context. Chichester, 2009, 293-320.
57. Martin, G., Beaumont, P., Doig, R., & Pate, J. (2005). Branding:: A New Performance Discourse for HR?. European Management Journal, 23(1), 76-88.
58. Maurer, S. D., Howe, V., & Lee, T. W. (1992). Organizational recruiting as marketing management: An interdisciplinary study of engineering graduates. Personnel Psychology, 45(4), 807-833.
59. Meister, J.C. and Willyerd, K. (2010). The 2020
Workplace: How Innovative Companies Attract,
Develop, and Keep Tomorrow's Employees Today, HarperCollins Publishers
60. Minchington, B., & Thorne, K. (2007). Measuring the effectiveness of your employer brand. Human Resources Magazine, 12(4), 14-16.
61. Montgomery, D. B., & Ramus, C. A. (2007). Including
corporate social responsibility, environmental
sustainability, and ethics in calibrating MBA job preferences. Graduate School of Business, Stanford University.
62. Moroko, L., & Uncles, M. D. (2008). Characteristics of
successful employer brands. Journal of Brand
Management, 16(3), 160-175.
63. Moroko, L., & Uncles, M. D. (2009). Employer branding and market segmentation. Journal of Brand management, 17(3), 181-196.
64. Moy, J. W., & Lee, S. M. (2002). The career choice of
business graduates: SMEs or MNCs?. Career
Development International, 7(6), 339-347.
65. Nunnally, J. (1978). C.(1978). Psychometric theory, 2. 66. Ployhart, R. E. (2006). Staffing in the 21st century: New
challenges and strategic opportunities. Journal of Management, 32(6), 868-897.
67. Public Relations Review, 19 (2): 121–39
68. Rampl, L. V. (2014). How to become an employer of choice: transforming employer brand associations into employer first-choice brands. Journal of Marketing Management, 30(13-14), 1486-1504.
69. Reis, G. G., & Braga, B. M. (2016). Employer attractiveness from a generational perspective: Implications for employer branding. Revista de Administração, 51(1), 103-116.
70. Ritson, M. (2002). Marketing and HR collaborate to harness employer brand power. Marketing, 18-18. 71. Rosengren, S., & Bondesson, N. (2014). Consumer
advertising as a signal of employer attractiveness. International Journal of Advertising, 33(2), 253-269.
72. Roy, S. K. (2008). Identifying the Dimensions of Attractiveness of an Employer Brand in the Indian Context. South Asian Journal of Management, 15(4). 73. Rynes, S. L., & Barber, A. E. (1990). Applicant
attraction strategies: An organizational perspective. Academy of Management Review, 15(2), 286-310. 74. Sartain, L., & Schumann, M. (2008). Brand from the
inside: Eight essentials to emotionally connect your employees to your business. John Wiley & Sons. 75. Schiffmann, E., Tambe, N., Gelles, M., Azaroff, R.,
Goldfarb, E., & Siemon, H. (2010). Deloitte millennial model. An approach to Gen Y readiness. Deloitte Development LLC, 3.
76. Schlager, T., Bodderas, M., Maas, P., & Luc Cachelin, J. (2011). The influence of the employer brand on employee attitudes relevant for service branding: an empirical investigation. Journal of Services Marketing, 25(7), 497-508.
77. Sedighi, F., & Loosemore, M. (2012). Employer-of-choice characteristics in the construction industry. Construction Management and Economics, 30(11), 941-950.
78. Sivertzen, A. M., Ragnhild Nilsen, E., & H. Olafsen, A. (2013). Employer branding: employer attractiveness and the use of social media. Journal of Product & Brand Management, 22(7), 473-483.
79. Smith, K., Gregory, S. R., & Cannon, D. (1996).
Becoming an employer of choice: Assessing
commitment in the hospitality workplace. International Journal of Contemporary Hospitality Management, 8(6), 3-9.
80. Sokro, E. (2012). Impact of employer branding on employee attraction and retention. European Journal of Business and Management, 4(18), 164-173.
81. Srivastava, P., & Bhatnagar, J. (2010). Employer brand for talent acquisition: An exploration towards its measurement. Vision: The Journal of Business Perspective, 14(1-2), 25-34.
82. Sutherland, M. M., Torricelli, D. G., & Karg, R. F. (2002). Employer-of-choice branding for knowledge workers. S Afr J of Business Manage, 33(4), 13-20. 83. Tanwar, K., & Kumar, A. (2019). Employer brand,
person-organisation fit and employer of choice: Investigating the moderating effect of social media. Personnel Review.
84. Thornbury, E. E., & Brooks, M. E. (2010). Signals of employer impressiveness and respectability to job market entrants. Corporate Reputation Review, 13(3), 172-183. 85. Turban, D. B. (2001). Organizational attractiveness as an
employer on college campuses: An examination of the applicant population. Journal of Vocational Behavior, 58(2), 293-312.
86. Turban, D. B., & Dougherty, T. W. (1992). Influences of campus recruiting on applicant attraction to firms. Academy of Management Journal, 35(4), 739-765. 87. Turban, D. B., Forret, M. L., & Hendrickson, C. L.
(1998). Applicant attraction to firms: Influences of organization reputation, job and organizational attributes, and recruiter behaviors. Journal of vocational behavior, 52(1), 24-44.
88. Tuzuner, V. L., & Yuksel, C. A. (2009). Segmenting potential employees according to Firm’s employer attractiveness dimensions in the employer brand context . Journal of Academic Research in Economics (JARE), (1), 47-62.
90. Wickham, M., & O'Donohue, W. (2009). Developing ‘employer of choice’status: exploring an employment marketing mix. Organization Development Journal, 27(3), 77-95.
91. Zemke, R., Raines, C., & Filipczak, B. (1999). Generations at work: Managing the clash of Veterans, Boomers, Xers, and Nexters in your workplace. Amacom.
92.
Zhu, F., Wang, Z., Yu, Q., Hu, T., Wen, Y., & Liu, Y.(2014). Reconsidering the dimensionality and