International Journal of Innovative Technology and Exploring Engineering (IJITEE) ISSN: 2278-3075, Volume-8 Issue-11, September 2019
Abstract: Character classification in the handwritten Tamil palm-leaf manuscript is more challenging than the other document character classification due to degradation and ancient characters in the palm-leaf manuscript. In this work, RBF (Radial Basis Function) network and CART (Classification and Regression Tree) were used to classify the Tamil palm leaf segmented characters. This work consists of two phases: In the first phase, the scanned Tamil palm leaf images were preprocessed by converting them into a grayscale image and then the images were allowed to remove noise using a median filter. In the second phase, GLCM (Gray Level Co-occurrence Matrix) feature extraction method was used to extract the statistical features from the segmented characters and these features were used to train the RBF network and CART algorithm. For the RBF network, Nguyen-Widrow weight initialization technique was used to generate the weight instead of random initialization. The dataset used in this work is Kuzhanthai Pini Maruthuvam (Medicine for child-related disease). By comparing RBF using Nguyen-Widrow method with CART algorithm, RBF yields promising result of 98.4% of accuracy whereas CART produced 98.8% of accuracy for character classification. The digitization of the Tamil palm-leaf manuscript will preserve the historical secrets, traditional medicine to cure disease, healthy lifestyle, etc. It can be used in the archeological department and Tamil libraries having a palm leaf script to preserve the manuscript from degrading.
Keywords: RBF, Nguyen-Widrow, CART, Gini, Entropy, GLCM, Adaptive Mean Threshold.
I. INTRODUCTION
Machine Learning (ML) and Deep Learning (DL) is the fastest-growing study area in Artificial Intelligence which empowers us to work as a person with the most trustworthy accuracy and computational time. Some of the research work in the field of AI is character recognition, character classification, sentiment analysis, weather prediction, face recognition, speech recognition, etc. Character recognition and classification present an essential role because it processes the content from various documents in several kinds of literature. So far many types of research have been done in the domain of classification and recognition haracters but yet, require further research in Tamil characters due to century-old or generation based characters.
Here the dataset considered is the Tamil palm-leaf manuscript. Usually, this type of manuscript was written by our forefathers in preserved palm leaves to present the
Revised Manuscript Received on September 03, 2019
* Correspondence Author
M. Sornam*, Department of Computer Science, University of Madras, Chennai, India.
Poornima Devi. M, Department of Computer Science, University of Madras, Chennai, India.
knowledge for the forthcoming generation. Although presently, modern society is incapable to understand the Tamil characters particularly ancient characters. So to grasp the ancestral and historical culture of Tamil spirits, digitization is needed for the Tamil palm-leaf manuscript. The significant effects of the palm-leaf script are:
• At most, the palm leaves are drafted 200 to 300 years before.
• Degraded scripts due to natural hazards, deficiency of preservation, etc.
• Ancient characters in the script. • The presenting manner of individuals.
The Tamil language is the ancient languages in the universe, which is too an authentic language in Tamil Nadu and also standard language in India and the universe. This is spoken by Tamil souls all across the world. The Tamil language is listed as an accepted language of nations like Sri Lanka and Singapore. It is furthermore spoken by nations like Malaysia, South Africa, and Mauritius. The nation following Tamil culture and accepting the Tamil Language yet not formally announced is Reunion and Seychelles in Africa. Nations like Malaysia and Myanmar extends the Tamil language in academies. The month of January was stated as “Tamil Heritage Month” in Canada. The Tamil language comprises 247 characters which were named as Uyirezhuthu (12 characters), Meyezhuthu (18 characters), Uyirmeyezhuthu (12 Uyirezhuthu * 18 Meyezhuthu = 216 characters) and ayudha ezhuthu (1 character). This can be further split into Vallinam, Mellinam, and Idayinam as displayed in Fig.1.
Fig.1. Levels of Tamil language characters.
The Tamil language can be classified as old Tamil (300 BCE – 700 CE), Medium Tamil (700 CE – 1200 CE) and Modern Tamil (1200 – Present). Modern Tamil characters exist currently in practice, which somewhat varies from old and Medium Tamil and further challenging for the current generation to understand the ancient characters. The instances for some characters are presented in Fig.2.
Systematic Classification of Historical
Handwritten Tamil Palm Leaf Manuscript using
CART algorithm and RBF Network
Fig.2. Ancient characters versus present characters.
So far most of the research for Ancient Tamil characters recognition has been done using image processing as in [1] [2]. Some Tamil printed document characters were classified using Neural Network as in [3] and some authors used images processing to segment the images as in [4]. Research work for Tamil palm-leaf manuscript digitization was very less and some work has been done using image processing as in [5] [6]. This paper carrier the research work in Tamil palm-leaf manuscript character classification using RBF and CART algorithm. This work is based on both image processing and neural network. This paper is prepared as follows: Section 2 comprises a literature review, Section 3 includes proposed work, Section 4 holds experimental results and discussion and Section 5 carries a conclusion.
II. RELATEDWORKS
Ramanan et al. [7] introduced a new procedure to identify Tamil characters using binary Support Vector Machine (SVM) toward multiclass classification with Decision Tree. Here Binary rooted Directed Acyclic Graph (DAG) decision was practiced for Unbalanced Decision Trees (UDT). The implementation is based on One Versus One (OVO) with SVM and One Versus All (OVA) with SVM. The Histogram of Oriented Gradients (HOG) and the transition were applied for feature extraction. The dataset comprises 12400 units and reached 98.80% of recognition accuracy.
Aladhahalli et al. [8] offered a design to segment the characters from degraded ancient documents applying the Watershed model. Sobel and Laplacian were done to eliminate the noise from the document image. Various datasets were employed to examine the model, where the proposed techniques gave greater accuracy in expressions of precision, recall, and f-measure.
Aarthi et al. [9] acquired the application for people to assist them technologically which transforms passage to talk in English and Tamil languages. In this method, Optical Character Recognition (OCR) has done to transform the passage present in an image. Then the passage gained from OCR was turned to audio with created speech. Here the Gabor filter algorithm was employed for feature extraction. For classification, SVM was executed.
Karun and Sharma [10] improved the system to understand the online handwritten Gurumukhi characters. In this study, the writing zone identification technique was formed to identify the upper, middle and lower zones of characters. The strokes of characters were recognized using Hidden Markov Model with 95.3% efficiency and the zone identification reached 88.4% efficiency. The dataset comprises 4280 characters of various users.
Santhosh et al. [11] explained the method to analyze and
recognize the Tamil handwritten characters with two ways such as Self Organizing Map (SOM) and RBF with SOM. The mixture of RBF with SOM provides a more satisfying outcome including classification accuracy 89% and 96.9% of recognition accuracy.
Nilesh et al. [12] suggested a method for classification of brain tumor from MRI. To update the tumor detection performance various segmentation approaches were performed such as Fuzzy Classifier Means (FCM), Discrete Cosine Transform (DCT), Watershed and Berkeley Wavelet Transform (BWT) to select the most suitable segmentation approach. The classification with GA generates 92.03% of accuracy applying BWT based segmentation for MR images. Agnel and Merlin [13] acquired a way to recognize Tamil script using HMM with a fuzzy logic classifier. The unnamed characters were identified utilizing frames in feature distance and member function. This recognizes characters with efficiency differ from 89% to 93% with 750 characters.
Munish et al. [14] showed several feature extraction methods for offline handwritten Gurumukhi characters. The feature extraction method involves Consistency Based Analysis (CBA), Correlation Feature Set (CFS), Chi-Squared Attribute (CSA), Independent Component Analysis (ICA), Latent Semantic Analysis (LSA), Principal Component Analysis (PCA) and Random Projection. The classifiers applied were Nearest Neighbors (NN) and SVM. In this paper, CSA feature extraction serves better and classified the characters based on an upper, middle and lower zone including accuracy of 88.3%, 95.2%, and 91.3%.
Lahecen et al. [15] introduced a system to recognize the Tifinagh handwritten characters. This system incorporates image scanning, preprocessing, feature extraction and character recognition. Feedforward neural network was applied for classification with GA and the method for OCR generated 89.5% of accuracy.
III. PROPOSEDWORK
International Journal of Innovative Technology and Exploring Engineering (IJITEE) ISSN: 2278-3075, Volume-8 Issue-11, September 2019
which includes contrast, energy, homogeneity, correlation, dissimilarity and Angular Second Moment (ASM). By obtaining these features, the network was trained using RBF
[image:3.595.63.526.104.200.2][17] with the Nguyen-Widrow weight initialization method [19] and the CART algorithm as shown in Fig. 3 and Fig.4.
Fig.3. Phase 1.
A. GLCM Feature Extraction Technique:
Gray Level Co-occurrence Matrix (GLCM) has been used to extract the statistical features from images, which is also known as Gray Tone Spatial Dependency Matrix (GTSDM) [18]. The GLCM technique computes the texture using second-order statistical degree which mainly concentrates on the relationship between pixels of two different classes, whereas the first order will also calculate the statistical degree but which does not concentrate on the relationship between pixels of two different classes. GLCM consists of two steps; in the first step the co-occurrence matrix has to be computed and in the second step the texture features have to be computed. The texture features used in this work are listed below,
1. Contrast 2. Energy 3. Homogeneity 4. Correlation 5. Dissimilarity
6. Angular Second Moment (ASM)
Some other features are also available but they are secondary and derived from the features listed above. Some of the features are [20]:
Sum average Sum entropy Sum variance Difference variance Difference entropy
GLCM feature for images was computed using displacement vector d, radius γ and the orientation θ. The dimension of the GLCM is based on the maximum gray value pixels in the image. The orientation of θ equal to 0o
is equal to the
orientation of θ equal to 180o
. So that the choice of choosing θ value is 0o
, 45o, 90o and 135o which represents the direction as horizontal, diagonally up, vertical and diagonally down. Computation of the GLCM feature includes two stages: First have to compute the co-occurrence matrix for the grayscale image and secondly, calculate the texture feature. Let us consider the 4x3 matrix to the GLCM features.
[image:3.595.391.457.320.388.2]Stage 1: a) Fig. 5 represents the gray image pixel value.
Fig.5. Gray image pixel value
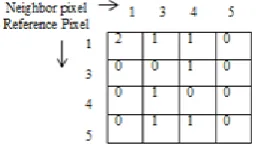
b) Manipulate the co-occurrence matrix with the neighboring pixel and reference pixel for distance d=1 and orientation θ=0o
as shown in Fig.6.
Fig.6.Co-occurrence matrix with neighboring and reference pixel.
[image:3.595.361.490.443.518.2] [image:3.595.62.552.464.806.2]Fig.7.Horizontal GLCM matrix
The horizontal GLCM matrix was obtained by summing all the pixels in the resultant matrix then divide the summed total with each pixel as in Fig.7.
Stage 2:
Compute the texture feature for GLCM statistical feature measures.
For example, Fig.8 represents the computation for Dissimilarity GLCM feature as in (5),
Fig.8. Dissimilarity GLCM feature
Finally sum all the pixel value to obtain dissimilarity matrix, which is D=1.2. Similarly, compute for all GLCM statistical features.
A. Contrast
This GLCM statistical feature measures the spatial frequency of a given image. It is used to measure the quantity of local variation existing in the image. A low contrast image grants low spatial frequency.
(1)
B. Energy
This GLCM statistical measure is also known as uniformity. It is used to quantify the texture uniformity which is termed as pixel recurrences and it also used to identify the disorders in the image. The maximum value for energy is 1. For the constant value of the gray level distribution, the greater the energy value will attain.
(2)
C. Homogeneity
This GLCM statistical measure is also known as Inverse Difference Moment or Local Homogeneity, which is used to compute the image similarity. The GLCM values for the fewer identical images will have a larger number of pixel records. It attains the maximum value when all the pixels in an image are similar. When increase in contrast, the homogeneity of the GLCM will get decrease.
(3)
D. Correlation
This GLCM statistical measure is used to compute the gray level linear dependencies among the pixels at the definite position.
(4)
E. Dissimilarity
This GLCM statistical measure is used to measure the non-homogenous pixels in the GLCM matrix.
(5)
F. Angular Second Moment (ASM)
This GLCM statistical measure is used to compute the homogeneity of an image. The homogenous images will have lesser gray values; it measures the familiarity of the distribution of pixel value.
(6)
B. CART (Classification and Regression Tree):
CART is a decision tree that comes under the supervised learning algorithm. It is used for both classification and regression problems. In this work, CART is used for a classification problem. It can handle categorical and continuous values of input and output. The CART can be classified into two types based on the target variable type. They are the categorical variable tree and continuous variable tree. The most important terminology in the decision tree is the root node, splitting, decision node, leaf or terminal node, branching or subtree, pruning (contradictory to splitting), parent node and child node shown in Fig.9. The advantages of CART are it is easy to understand, useful in data exploration and required less data cleaning. The disadvantage is that it will over fit with the data. In CART, for classification Gini index measure will be used and for regression, entropy will be used. In this work, both attribute selection measures (Gini index and entropy) were used for classification. Entropy was used to compare the result with the Gini index.
a. Gini Index
CART uses the Gini index to generate split points. Gini is used to measure the impurity which means if the impurity is less, the classification is good. If the target variable is binary then it must have two values yes
International Journal of Innovative Technology and Exploring Engineering (IJITEE) ISSN: 2278-3075, Volume-8 Issue-11, September 2019
be 4 groupings; 11, 10, 01 and 00. This can be written as follows,
P(T=1).P(T=1)+P(T=1).P(T=0)+P(T=0).P(T=1)+P(T=0).P( T=0)=1 P(T=1).P(T=0)+P(T=0).P(T=1)= 1- P2(T=0) – P2(T=1) It can be rewritten as
(7) where G is the Gini index, T is the Target variable and P is the proportion of observation of the target variable.
Similarly, for the categorical target variable, the Gini index will be similar only with slight modification as follows,
(8) The maximum value for the binary-valued Gini index can be computed as
G = 1- (1/2)2 – (1/2)2 (9) = 1-2(1/2)2
= 1- 2(1/4) = 1-0.5 G = 0.5
So the maximum value for the binary target variable Gini index is 0.5. Similarly, the maximum value for the nominal variable can be computed using,
(10)
The minimum value of the Gini index is 0 when all the observation fits the single label.
The element with the minimum Gini index will be selected as a splitting element. Gini split can be calculated using the following formula,
– – (11) where s is the split and t is the node,
GINI (t) is the Gini index of input node t.
PLeft is the proportion of observation in the left node after the
split,
GINI (Left_node) is the Gini index of the left node after the split,
PRight is the proportion of observation in the right node after
the split,
GINI (Right_node) is the Gini index of the right node after the split.
b. Entropy
Entropy is another technique to measure the impurity, where higher entropy value will be considered as a good classification. Entropy takes a slightly more computation period than the Gini index because of the logarithmic computation. Entropy can be computed using the following formula,
(12)
.
FIG.9.CART TERMINOLOGIES
IV. EXPERIMENTALRESULTANDDISCUSSION
This work has been proposed to classify a handwritten Tamil palm-leaf manuscript character which contains 18 different character classes which are also known as multiclass classification. This multiclass can be represented using a discriminant function as in (13)
(13) where x is the feature vector and ck is the class, k=1,2,…,n.
For simplicity (13) can be rewritten as,
(14) For the two-class problem that is for binary classification, the discriminant function is represented as in (15) and (16),
(15) (16)
where c1 and c2 are class 1 and class 2.
For multiclass problem, the discriminant function can be represented as in (17),
(17)
where t=1,2,…,T; l ≠ k where x ck.
A. Dataset
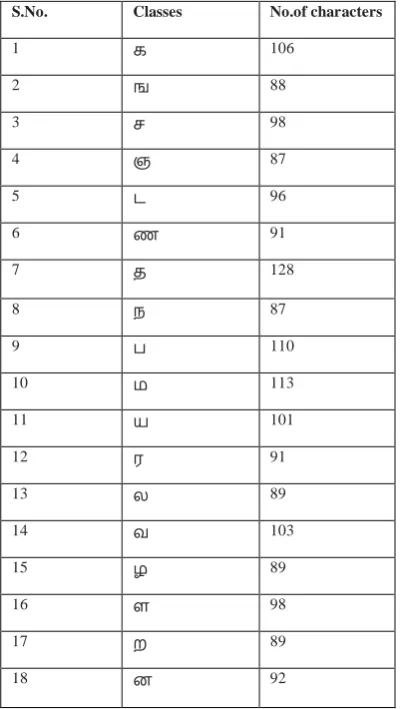
The dataset used in this work is Kuzhanthai Pini Maruthuvam (Medicine for child-related disease) which was collected from U.Ve.Swaminatha Iyer Library at Chennai. For classification, the characters were segmented from the palm-leaf manuscript. There are 1756 different orientation characters for 18 different classes. The classes and the number of characters in each class are given below Table I.
Table I. Classes and no. of characters
Exp erimentation was also carried out using the RBF network- Nguyen-Widrow weight generation with 6 input neurons, 9 hidden neurons and 1 output neuron. The input for the network was features extracted using GLCM feature extraction. Rather than random initialization of weights, Nguyen-Widrow weights were used to generate the weights from hidden to an output unit in the RBF network. Table III describes the parameters and their values in Radial Basis Function (RBF) employed.
[image:6.595.314.556.83.252.2]Fig.10 describes the CART classification using GLCM features for Gini metrics. That each and every character will have similar feature pixel value, those character having similar features will be grouped together based on the Gini measured and classified into a single class.
Fig.10. CART classification using GLCM features.
[image:6.595.311.556.291.437.2]Table II: Tuning parameters for CART algorithm
Table III. Parameters for RBF network with Nguyen-Widrow
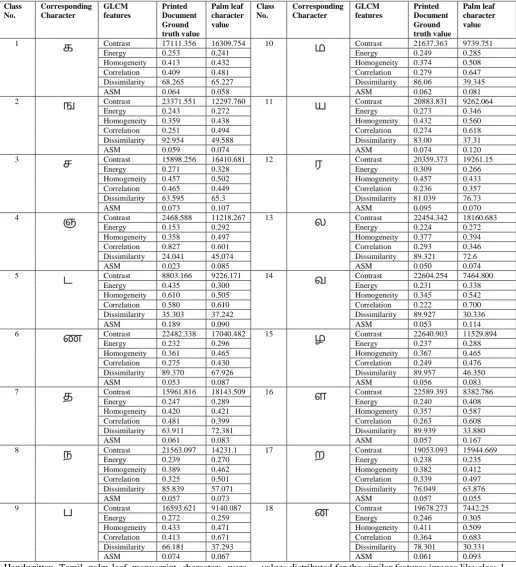
Table IV describes the comparison between the ground truth values of printed document characters with the palm leaf manuscript characters of Tamil language. Table IV contains a class number, characters with the corresponding class number, ground truth values of printed document characters GLCM features value and the palm leaf characters GLCM features value.
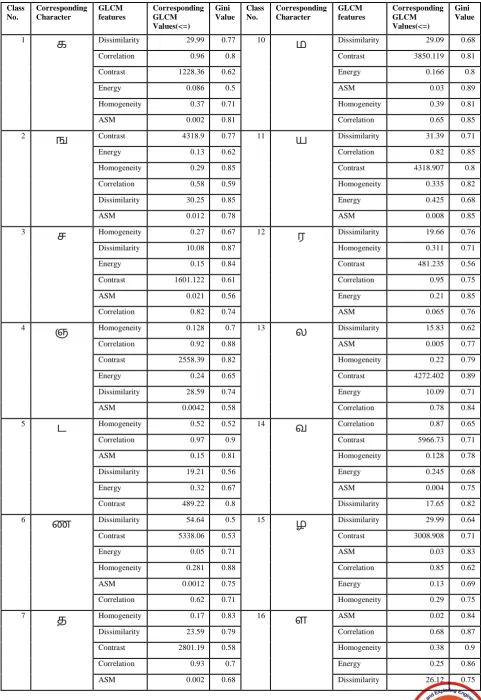
Table V illustrates for which GLCM features values the characters classified into corresponding class labels in the CART algorithm. Table V contains a class number, a character corresponding to the class number, GLCM features and its values, and the Gini value for the corresponding characters.
S.No. Classes No.of characters
1 க 106
2 ங 88
3 ச 98
4 ஞ 87
5 ட 96
6 ண 91
7 த 128
8 ந 87
9 ப 110
10 ம 113
11 ய 101
12 ர 91
13 ல 89
14 வ 103
15 ழ 89
16 ள 98
17 ற 89
18 ன 92
Parameters Values
No. of input neurons 6
No. of hidden neurons 9 No. of output neurons 1 Nguyen-
Widrow Weight Initialization
β 0.7
Initialization range between -0.5 to 0.5
RBF Network Technique Gradient descent learning MSE <0.0003
Accuracy 98.4%
Algorithm
Tuning Parameters
CART (Classification
and Regression Tree)
Attribute selection measure/
Impurity measure
Gini Index Entropy
Maximum features 6 6
Minimum sample split 30 30
Graph Depth 17 11
[image:6.595.43.564.611.806.2]International Journal of Innovative Technology and Exploring Engineering (IJITEE) ISSN: 2278-3075, Volume-8 Issue-11, September 2019
Table IV. Comparison between the ground truth values of printed document characters with the palm leaf manuscript characters
Handwritten Tamil palm-leaf manuscript characters were classified using GLCM features as a feature extraction which computes the statistical features based on the pixel values of an image. Fig. 11 shows the sample characters of statistical
values distributed for the similar features images like class 1 and class 3, class 7 and 8, class 3 and 14, and class 16 and 18 as in Table V. Those values may vary according to individual
writing style.
Class No.
Corresponding Character
GLCM features
Printed Document Ground truth value
Palm leaf character value
Class No.
Corresponding Character
GLCM features
Printed Document Ground truth value
Palm leaf character value
1
க
Contrast 17111.356 16309.754 10ம
Contrast 21637.363 9739.751Energy 0.253 0.241 Energy 0.249 0.285
Homogeneity 0.413 0.432 Homogeneity 0.374 0.508 Correlation 0.409 0.481 Correlation 0.279 0.647 Dissimilarity 68.265 65.227 Dissimilarity 86.06 39.345
ASM 0.064 0.058 ASM 0.062 0.081
2
ங
Contrast 23371.551 12297.760 11ய
Contrast 20883.831 9262.064Energy 0.243 0.272 Energy 0.273 0.346
Homogeneity 0.359 0.438 Homogeneity 0.432 0.560 Correlation 0.251 0.494 Correlation 0.274 0.618 Dissimilarity 92.954 49.588 Dissimilarity 83.00 37.31
ASM 0.059 0.074 ASM 0.074 0.120
3
ச
Contrast 15898.256 16410.681 12ர
Contrast 20359.373 19261.15Energy 0.271 0.328 Energy 0.309 0.266
Homogeneity 0.457 0.502 Homogeneity 0.457 0.433 Correlation 0.465 0.449 Correlation 0.236 0.357 Dissimilarity 63.595 65.3 Dissimilarity 81.039 76.73
ASM 0.073 0.107 ASM 0.095 0.070
4
ஞ
Contrast 2468.588 11218.267 13ல
Contrast 22454.342 18160.683Energy 0.153 0.292 Energy 0.224 0.272
Homogeneity 0.358 0.497 Homogeneity 0.377 0.394 Correlation 0.827 0.601 Correlation 0.293 0.346 Dissimilarity 24.041 45.074 Dissimilarity 89.321 72.6
ASM 0.023 0.085 ASM 0.050 0.074
5
ட
Contrast 8803.166 9226.171 14வ
Contrast 22604.254 7464.800Energy 0.435 0.300 Energy 0.231 0.338
Homogeneity 0.610 0.505 Homogeneity 0.345 0.542 Correlation 0.580 0.610 Correlation 0.222 0.700 Dissimilarity 35.303 37.242 Dissimilarity 89.927 30.336
ASM 0.189 0.090 ASM 0.053 0.114
6
ண
Contrast 22482.338 17040.482 15ழ
Contrast 22640.903 11529.894Energy 0.232 0.296 Energy 0.237 0.288
Homogeneity 0.361 0.465 Homogeneity 0.367 0.465 Correlation 0.275 0.430 Correlation 0.249 0.476 Dissimilarity 89.370 67.926 Dissimilarity 89.957 46.350
ASM 0.053 0.087 ASM 0.056 0.083
7
த
Contrast 15961.816 18143.509 16ள
Contrast 22589.393 8382.786Energy 0.247 0.289 Energy 0.240 0.408
Homogeneity 0.420 0.421 Homogeneity 0.357 0.587 Correlation 0.481 0.399 Correlation 0.263 0.608 Dissimilarity 63.911 72.381 Dissimilarity 89.939 33.880
ASM 0.061 0.083 ASM 0.057 0.167
8
ந
Contrast 21563.097 14231.1 17ற
Contrast 19053.093 15944.669Energy 0.239 0.270 Energy 0.238 0.235
Homogeneity 0.389 0.462 Homogeneity 0.382 0.412 Correlation 0.325 0.501 Correlation 0.339 0.497 Dissimilarity 85.839 57.071 Dissimilarity 76.049 63.876
ASM 0.057 0.073 ASM 0.057 0.055
9
ப
Contrast 16593.621 9140.087 18ன
Contrast 19678.273 7442.25Energy 0.272 0.259 Energy 0.246 0.305
Homogeneity 0.433 0.471 Homogeneity 0.411 0.509 Correlation 0.413 0.671 Correlation 0.364 0.683 Dissimilarity 66.181 37.293 Dissimilarity 78.301 30.331
Table V. Classification of characters using CART algorithm based on GLCM feature values.
Class No.
Corresponding Character
GLCM features
Corresponding GLCM Values(<=)
Gini Value
Class No.
Corresponding Character
GLCM features
Corresponding GLCM Values(<=)
Gini Value
1
க
Dissimilarity 29.99 0.77 10ம
Dissimilarity 29.09 0.68Correlation 0.96 0.8 Contrast 3850.119 0.81
Contrast 1228.36 0.62 Energy 0.166 0.8
Energy 0.086 0.5 ASM 0.03 0.89
Homogeneity 0.37 0.71 Homogeneity 0.39 0.81
ASM 0.002 0.81 Correlation 0.65 0.85
2
ங
Contrast 4318.9 0.77 11ய
Dissimilarity 31.39 0.71Energy 0.13 0.62 Correlation 0.82 0.85
Homogeneity 0.29 0.85 Contrast 4318.907 0.8
Correlation 0.58 0.59 Homogeneity 0.335 0.82
Dissimilarity 30.25 0.85 Energy 0.425 0.68
ASM 0.012 0.78 ASM 0.008 0.85
3
ச
Homogeneity 0.27 0.67 12ர
Dissimilarity 19.66 0.76Dissimilarity 10.08 0.87 Homogeneity 0.311 0.71
Energy 0.15 0.84 Contrast 481.235 0.56
Contrast 1601.122 0.61 Correlation 0.95 0.75
ASM 0.021 0.56 Energy 0.21 0.85
Correlation 0.82 0.74 ASM 0.065 0.76
4
ஞ
Homogeneity 0.128 0.7 13ல
Dissimilarity 15.83 0.62Correlation 0.92 0.88 ASM 0.005 0.77
Contrast 2558.39 0.82 Homogeneity 0.22 0.79
Energy 0.24 0.65 Contrast 4272.402 0.89
Dissimilarity 28.59 0.74 Energy 10.09 0.71
ASM 0.0042 0.58 Correlation 0.78 0.84
5
ட
Homogeneity 0.52 0.52 14வ
Correlation 0.87 0.65Correlation 0.97 0.9 Contrast 5966.73 0.71
ASM 0.15 0.81 Homogeneity 0.128 0.78
Dissimilarity 19.21 0.56 Energy 0.245 0.68
Energy 0.32 0.67 ASM 0.004 0.75
Contrast 489.22 0.8 Dissimilarity 17.65 0.82
6
ண
Dissimilarity 54.64 0.5 15ழ
Dissimilarity 29.99 0.64Contrast 5338.06 0.53 Contrast 3008.908 0.71
Energy 0.05 0.71 ASM 0.03 0.83
Homogeneity 0.281 0.88 Correlation 0.85 0.62
ASM 0.0012 0.75 Energy 0.13 0.69
Correlation 0.62 0.71 Homogeneity 0.29 0.75
7
த
Homogeneity 0.17 0.83 16ள
ASM 0.02 0.84Dissimilarity 23.59 0.79 Correlation 0.68 0.87
Contrast 2801.19 0.58 Homogeneity 0.38 0.9
Correlation 0.93 0.7 Energy 0.25 0.86
International Journal of Innovative Technology and Exploring Engineering (IJITEE) ISSN: 2278-3075, Volume-8 Issue-11, September 2019
Energy 10.08 0.58 Contrast 2558.125 0.56
8
ந
Contrast 533.69 0.88 17ற
Energy 0.17 0.91Dissimilarity 21.849 0.91 Correlation 0.92 0.68
Homogeneity 0.176 0.6 Dissimilarity 26.43 0.76
ASM 0.03 0.51 ASM 0.05 0.81
Energy 0.35 0.75 Contrast 1159.86 0.72
Correlation 10.03 0.8 Homogeneity 0.45 0.69
9
ப
Dissimilarity 23.59 0.83 18ன
Contrast 5338.06 0.6Correlation 0.957 0.76 Energy 0.041 0.67
Homogeneity 0.311 0.66 Homogeneity 0.114 0.74
Energy 0.16 0.79 ASM 0.006 0.85
Contrast 3267.77 0.8 Dissimilarity 20.06 0.67
ASM 0.0012 0.75 Correlation 0.92 0.81
V. CONCLUSION
Fig.11. Sample of GLCM features with similar class characters.
Historical handwritten Tamil palm-leaf manuscript segmented character classification was proposed with the GLCM feature using the CART algorithm and RBF using the Nguyen-Widrow weight generation technique. For feature extraction, GLCM statistical feature extraction technique was used to extract the feature of segmented characters. The statistical features used were contrast, energy, homogeneity, dissimilarity, correlation and ASM. For weight initialization, the Nguyen-Widrow weight generation technique was applied to generate the weights instead of rand initialization for RBF Network. Gini and Entropy are the two impurity measures used in the CART algorithm. Here the CART algorithm was compared with RBF using Nguyen-Widrow (RBF-NW) where CART with Gini index achieved 98.8% of accuracy whereas CART with entropy achieved 98.2% accuracy and RBF-NW achieved 98.4% of accuracy. CART with Gini yields better accuracy than. RBF-NW and CART with entropy.
REFERENCES
1. G. Bhuvaneswari and V. Subbiah Bharathi, “An Efficient Positional algorithm for recognition of Ancient Stone Inscription Characters”, International Conference on Advanced Computing(ICoAC), IEEE, 2015, pp. 1 - 5.
2. G. Janani, V. Vishalini and P. Mohan Kumar, “Recognition and Analysis of Tamil Inscriptions and Mapping using Image Processing Techniques”, International Conference on Science Technology Engineering and Management(ICONSTEM), IEEE, 2016, pp. 181 - 184.
3. Karthigaiselvi. M and T. Kathirvalavakumar, “Recognition of words in Tamil script using Neural Network”,International Journal of Computer Research and Apllication, Vol.7, Issue.3, 2017, pp. 62-70. 4. A.S. Kavitha, P. Shivakumara, G.H. Kumar and Tong Lu, “Text Segmentation in degraded historical document images”, Egyptian Informatics Journal, Vol.17, Issue.2, 2016, pp. 189 - 197.
5. Kavitha Subramani and S. Murugavalli, “A Novel Binarization method for degraded Tamil palm Leaf image”, International Conference on Advanced Computing(ICoAC), IEEE, 2016, pp. 176 - 181.
6. Kiruba. B, Nivethitha. A and Vimaladevi. M, “Segmentation of handwritten Tamil characters from palm script using Histogram approach,” International Journal of Informative and Futuristic Research, Vol. 4, Issue. 5, 2017, pp.6418–6424.
7. Ramanan. M, Ramanan. A and Charles E. Y. A, “A Hybrid Decision tree for printed Tamil character recognition using SVMs,” IEEE, International Conference on Advances in ICT for Emerging Regions, 2015, pp.176–181.
8. Aladhahalli Shivegowda Kavitha, Palaiahnakote Shivakumar, Govindaraj Hemantha Kumar and Tong Lu, “A new watershed based system for character segmentation in degraded text lines”, International Journal of Electronics and Communications (AEU) 71, 2017, pp.45–52.
9. Aarthi. R, Kruthika Devi. N. R and Prithi. S, “ Advanced character based recognition and phone handling for Blind peoples,” International Research Journal of Engineering and Technology (IRJET), Vol. 05, Issue. 03, 2018, pp. 1751– 1755.
10.Karun Verma and Sharma. R. K, “An efficient writing-zone identification technique for Online Handwritten Gurumukhi character recognition,” Proc. Natl. Acad. Sci., India, Sect. A Phys. Sci. 88 (2), 2018, pp.297–307.
11.Santhosh Baboo. S, Subashini. P and Krishnaveni. M, “Combining Self-Organizing Maps and Radial Basis Function networks for Tamil handwritten character recognition,” ICGST-GVIP Journal, Vol. 9, Issue.4, 2009, pp.1–7.
12.Nilesh Bhaskarrao, Arun Kumar Ray and Har Pal Thethi, “Comparative approach of MRI- Based Brain Tumor segmentation and classification using Genetic Algorithm,” Journal of Digital Imaging 31, 2018, pp.477–489.
14.Munish Kumar, Jindal. M. K, Sharma. R. K and Simpel Rani Jindal, “Performance comparison of several feature selection techniques for offline handwritten character recognition,” IEEE, 3rd IEEE International Conference on Research in Intelligent and Computing in Engineering, 2018, pp.1–6.
15.Lahecen Niharmine, Benaceur Outtaj and Ahmed Azouaoui, “Tifinagh handwritten character recognition using Genetic Algorithm,” IEEE, International Conference on Advanced Communication Technologies and Networking (CommNet), 2018, DOI:
http://10.1109/COMMNET.2018.8360267.
16. Poornima Devi. M and M. Sornam, “Contour based Character Segmentation and Nguyen-Widrow Weight Generation for Classification of Tamil Palm Leaf Script Characters- Machine Learning Approach,” International Journal of Computer Sciences and Engineering (IJCSE), vol.7, Special Issue.5, 2019, pp.118-123. 17.Poornima Devi. M and M. Sornam, “A Hybrid RBF Network with GA
for Systematic Classification of Historical Tamil Palm Leaf Manuscript,” International Journal of Research in Advent Technology (IJRAT), 2019, pp. 49-54.
18.Sornam. M and Poornima Devi. M, “Tamil Palm leaf manuscript character segmentation using GLCM feature extraction,” International Journal of Computer Science and Engineering, Vol.6, Issue.6, 2018, pp.167–173.
19.Dino Neinhold, Kilian Schwab, Rolf Dornberger and Thomas Hanne, “Effects of weight initialization in a Feedforward Neural Network for classification using modified Genetic Algorithm,” IEEE, 3rd International Symposium on Computational and Business Intelligence, 2015, pp.6–12.
20.Kanchan Sharma, Er. Priyanka, Er. Aditi Kalsh and Er. Kulbeer Saini, “GLCM and its feature”, International Jorunal of Advanced Research in Electronics and Communication Engineering(IJARECE), Vol. 4, Issue. 8, 2015, pp. 2180-2182.
AUTHORS PROFILE
Miss. Poornima Devi. Mpursed Bachelor of Science in Soka Ikeda College for Women from University of Madras, India in the year 2013, Master of Science in Queen Marys College for Women from University of Madras, India in the year 2015 and Master of Philosophy in University of Madras, India in the year 2016. She is currently pursuing Ph.D. in Department of Computer Science, University of Madras, India since 2017. Her main research work focuses on Artificial Intelligence, Artificial Neural Network, Image Processing, and Deep Learning Neural Network.