InTrans Project Reports Institute for Transportation
6-2012
Development of a Database for Drilled SHAft
Foundation Testing (DSHAFT)
Jessica A. Garder
Iowa State University, [email protected]
Kam W. Ng Iowa State University
Sri Sritharan
Iowa State University, [email protected]
Matthew J. Roling
Iowa State University, [email protected]
Follow this and additional works at:http://lib.dr.iastate.edu/intrans_reports
Part of theCivil Engineering Commons, and theStructural Engineering Commons
This Report is brought to you for free and open access by the Institute for Transportation at Iowa State University Digital Repository. It has been accepted for inclusion in InTrans Project Reports by an authorized administrator of Iowa State University Digital Repository. For more information, please [email protected].
Recommended Citation
Garder, Jessica A.; Ng, Kam W.; Sritharan, Sri; and Roling, Matthew J., "Development of a Database for Drilled SHAft Foundation Testing (DSHAFT)" (2012).InTrans Project Reports. 35.
Development of a Database for Drilled SHAft Foundation Testing
(DSHAFT)
Abstract
Drilled shafts have been used in the US for more than 100 years in bridges and buildings as a deep foundation alternative. For many of these applications, the drilled shafts were designed using the Working Stress Design (WSD) approach. Even though WSD has been used successfully in the past, a move toward Load Resistance Factor Design (LRFD) for foundation applications began when the Federal Highway Administration (FHWA) issued a policy memorandum on June 28, 2000.The policy memorandum requires all new bridges initiated after October 1, 2007, to be designed according to the LRFD approach. This ensures compatibility between the superstructure and substructure designs, and provides a means of consistently incorporating sources of uncertainty into each load and resistance component.
Regionally-calibrated LRFD resistance factors are permitted by the American Association of State Highway and Transportation Officials (AASHTO) to improve the economy and competitiveness of drilled shafts. To achieve this goal, a database for Drilled SHAft Foundation Testing (DSHAFT) has been developed. DSHAFT is aimed at assimilating high quality drilled shaft test data from Iowa and the surrounding regions, and
identifying the need for further tests in suitable soil profiles.
This report introduces DSHAFT and demonstrates its features and capabilities, such as an easy-to-use storage and sharing tool for providing access to key information (e.g., soil classification details and cross-hole sonic logging reports). DSHAFT embodies a model for effective, regional LRFD calibration procedures consistent with PIle LOad Test (PILOT) database, which contains driven pile load tests accumulated from the state of Iowa. PILOT is now available for broader use at the project website: http://srg.cce.iastate.edu/lrfd/. DSHAFT, available in electronic form at http://srg.cce.iastate.edu/dshaft/, is currently comprised of 32 separate load tests provided by Illinois, Iowa, Minnesota, Missouri and Nebraska state departments of transportation and/or department of roads. In addition to serving as a manual for DSHAFT and providing a summary of the available data, this report provides a preliminary analysis of the load test data from Iowa, and will open up opportunities for others to share their data through this quality–assured process, thereby providing a platform to improve LRFD approach to drilled shafts, especially in the Midwest region.
Keywords
Civil Construction and Environmental Engineering, BEC, bridge deep foundations, drilled shaft load tests, electronic database, Load and Resistance Factor Design (LRFD)
Disciplines
Development of a Database for Drilled
SHAft Foundation Testing (DSHAFT)
Final Report
June 2012
Sponsored by
About the Bridge Engineering Center
The mission of the Bridge Engineering Center (BEC) is to conduct research on bridge
technologies to help bridge designers/owners design, build, and maintain long-lasting bridges.
About the Institute for Transportation
The mission of the Institute for Transportation (InTrans) at Iowa State University is to develop and implement innovative methods, materials, and technologies for improving transportation efficiency, safety, reliability, and sustainability while improving the learning environment of students, faculty, and staff in transportation-related fields.
Disclaimer Notice
The contents of this report reflect the views of the authors, who are responsible for the facts and the accuracy of the information presented herein. The opinions, findings and conclusions expressed in this publication are those of the authors and not necessarily those of the sponsors.
The sponsors assume no liability for the contents or use of the information contained in this document. This report does not constitute a standard, specification, or regulation.
The sponsors do not endorse products or manufacturers. Trademarks or manufacturers’ names appear in this report only because they are considered essential to the objective of the document.
Non-Discrimination Statement
Iowa State University does not discriminate on the basis of race, color, age, religion, national origin, sexual orientation, gender identity, genetic information, sex, marital status, disability, or status as a U.S. veteran. Inquiries can be directed to the Director of Equal Opportunity and Compliance, 3280 Beardshear Hall, (515) 294-7612.
Iowa Department of Transportation Statements
Federal and state laws prohibit employment and/or public accommodation discrimination on the basis of age, color, creed, disability, gender identity, national origin, pregnancy, race, religion, sex, sexual orientation or veteran’s status. If you believe you have been discriminated against, please contact the Iowa Civil Rights Commission at 800-457-4416 or Iowa Department of Transportation’s affirmative action officer. If you need accommodations because of a disability to access the Iowa Department of Transportation’s services, contact the agency’s affirmative action officer at 800-262-0003.
The preparation of this report was financed in part through funds provided by the Iowa Department of Transportation through its “Agreement for the Management of Research Conducted by Iowa State University for the Iowa Department of Transportation” and its amendments.
Technical Report Documentation Page
1. Report No. 2. Government Accession No. 3. Recipient’s Catalog No.
InTrans Project 10-366
4. Title and Subtitle 5. Report Date
Development of a Database for Drilled SHAft Foundation Testing (DSHAFT) June 2012
6. Performing Organization Code
7. Author(s) 8. Performing Organization Report No.
Jessica A. Garder, Kam W. Ng, Sri Sritharan, and Matthew J. Roling InTrans Project 10-366
9. Performing Organization Name and Address 10. Work Unit No. (TRAIS)
Bridge Engineering Center Institute for Transportation Iowa State University
2711 South Loop Drive, Suite 4700 Ames, IA 50010-8664
11. Contract or Grant No.
12. Sponsoring Organization Name and Address 13. Type of Report and Period Covered Iowa Department of Transportation
800 Lincoln Way Ames, IA 50010
Federal Highway Administration U.S. Department of Transportation 400 7th Street SW
Washington, DC 20590
Final Report
14. Sponsoring Agency Code SPR 90-00-RB01-010
15. Supplementary Notes
Visit www.intrans.iastate.edu for color pdfs of this and other research reports.
16. Abstract
Drilled shafts have been used in the US for more than 100 years in bridges and buildings as a deep foundation alternative. For many of these applications, the drilled shafts were designed using the Working Stress Design (WSD) approach. Even though WSD has been used successfully in the past, a move toward Load Resistance Factor Design (LRFD) for foundation applications began when the Federal Highway Administration (FHWA) issued a policy memorandum on June 28, 2000.The policy memorandum requires all new bridges initiated after October 1, 2007, to be designed according to the LRFD approach. This ensures compatibility between the superstructure and substructure designs, and provides a means of consistently incorporating sources of uncertainty into each load and resistance component.
Regionally-calibrated LRFD resistance factors are permitted by the American Association of State Highway and Transportation Officials (AASHTO) to improve the economy and competitiveness of drilled shafts. To achieve this goal, a database for Drilled SHAft Foundation Testing (DSHAFT) has been developed. DSHAFT is aimed at assimilating high quality drilled shaft test data from Iowa and the surrounding regions, and identifying the need for further tests in suitable soil profiles.
This report introduces DSHAFT and demonstrates its features and capabilities, such as an easy-to-use storage and sharing tool for providing access to key information (e.g., soil classification details and cross-hole sonic logging reports). DSHAFT embodies a model for effective, regional LRFD calibration procedures consistent with PIle LOad Test (PILOT) database, which contains driven pile load tests accumulated from the state of Iowa. PILOT is now available for broader use at the project website: http://srg.cce.iastate.edu/lrfd/. DSHAFT, available in electronic form at http://srg.cce.iastate.edu/dshaft/, is currently comprised of 32 separate load tests provided by Illinois, Iowa, Minnesota, Missouri and Nebraska state departments of transportation and/or department of roads. In addition to serving as a manual for DSHAFT and providing a summary of the available data, this report provides a preliminary analysis of the load test data from Iowa, and will open up opportunities for others to share their data through this quality–assured process, thereby providing a platform to improve LRFD approach to drilled shafts, especially in the Midwest region.
17. Key Words 18. Distribution Statement
bridge deep foundations—drilled shaft load tests—electronic database—Load and Resistance Factor Design (LRFD)
No restrictions.
19. Security Classification (of this report)
20. Security Classification (of this page)
21. No. of Pages 22. Price
Unclassified. Unclassified. 80 NA
Development of a Database for Drilled SHAft
Foundation Testing (DSHAFT)
Final Report June 2012
Principal Investigator Sri Sritharan
Wilson Engineering Associate Professor and Associate Chair Department of Civil, Construction and Environmental Engineering
Iowa State University
Postdoctoral Researcher Kam W. Ng
Research Assistants Jessica A. Garder Matthew J. Roling
Authors
Jessica A. Garder, Kam W. Ng, Sri Sritharan, and Matthew J. Roling
Sponsored by
the Iowa Department of Transportation and the Federal Highway Administration State Planning and Research Funding
(SPR 90-00-RB01-010)
Preparation of this report was financed in part
through funds provided by the Iowa Department of Transportation through its research management agreement with the
Institute for Transportation (InTrans Project 10-366)
A report from
Bridge Engineering Center Institute for Transportation
Iowa State University 2711 South Loop Drive, Suite 4700
TABLE OF CONTENTS
ACKNOWLEDGMENTS ... ix
EXECUTIVE SUMMARY ... xi
Problem Statement ... xi
Background ... xi
Project Objectives ... xii
Research Description ... xii
Key Features of DSHAFT ... xii
Implementation Readiness ... xiii
Implementation Benefits ... xiii
1.INTRODUCTION ...1
2.BACKGROUND ...4
3.SIGNIFICANCE OF DSHAFT ...7
4.KEY TERMINOLOGY USED FOR DATA QUALITY ASSURANCE ...8
5.DESCRIPTIVE SUMMARY OF DSHAFT DATA SUBSET ...10
6.DSHAFT USER MANUAL ...12
6.1 Accessing DSHAFT...12
6.2 Description of DSHAFT Database Fields...13
6.3 Disclaimer Notice ...26
7.PRELIMINARY ANALYSIS ...27
7.1 Shaft Resistance ...27
7.2 Toe Resistance ...31
7.3 Results ...34
8. IMPLEMENTATION BENEFITS AND READINESS ...37
REFERENCES ...38
APPENDIX A. SUMMARY OF AVAILABLE DSHAFT DATASETS ...41
LIST OF FIGURES
Figure 1.1. Distribution of drilled shaft load tests reported in DSHAFT by location ...3
Figure 2.1. Dry method of construction: (a) drill the hole, (b) clean the base, (c) place reinforcement, and (d) place concrete (FHWA 2010) ...4
Figure 2.2. Construction using casing through slurry-filled starter hole: (a) drill with slurry; (b) set casing and bail slurry; (c) complete and clean excavation, set reinforcing; (d) place concrete to head greater than external water pressure; (e) pull casing while adding concrete (FHWA 2010) ...5
Figure 2.3. Construction using casing advanced ahead of excavation: (a) drive casing into bearing stratum; (b) drill through casing; (c) complete and clean hole, set reinforcing; (d) place concrete to head greater than external water pressure; (e) pull casing while adding concrete (FHWA 2010) ...5
Figure 2.4. Slurry drilling process: (a) set starter casing; (b) fill with slurry; (c) complete and clean excavation, set reinforcing; (d) place concrete through tremie; and (e) pull tremie while adding concrete (FHWA 2010) ...6
Figure 5.1. Distribution of historical drilled shaft data ...10
Figure 5.2. Location of drilled shaft test sites ...11
Figure 6.1. DSHAFT website home page (srg.cce.iastate.edu/dshaft) ...12
Figure 6.2. DSHAFT request form ...13
Figure 6.3. DSHAFT Display Form (Microsoft Office AccessTM 2007) ...14
Figure 6.4. Drilled Shaft Load Test Record Form (DSLTRF) ...15
Figure 6.5. Soil and rock information tab of DSLTRF ...19
Figure 6.6. Osterberg load test details tab of DSLTRF Load and Displacement table: This table allows the user to input the shaft and toe displacement corresponding to an applied O-cell load. This table includes the following columns: ...21
Figure 6.7. Illustration of Statnamic load test details tab of DSLTRF ...22
Figure 6.8. Load transfer details tab of DSLTRF ...24
Figure 6.9. An illustration of CSL test details tab of DSLTRF ...26
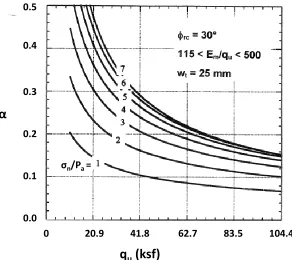
Figure 7.1. Factor α for cohesive IGM (adapted after O’Neill et al. 1996) ...29
LIST OF TABLES
Table 1.1. Summary of 13 drilled shaft datasets collected in Iowa ...3
Table 6.1. Concrete condition rating criteria (MoDOT 2012) ...25
Table 7.1. Side resistance reduction factor for cohesive IGM ...29
Table 7.2. Estimation of αE for equation 7.8 (O’Neill and Reese 1999) ...30
Table 7.3. Estimation of Em based on RQD (adapted after O’Neill and Reese 1999) ...31
Table 7.4. Approximate relationship between rock-mass quality and fractured rock-mass parameters used in defining nonlinear strength (Hoek and Brown 1988) ...33
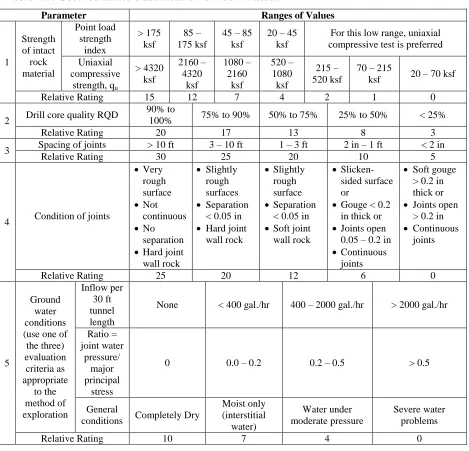
Table 7.5. Geomechanics classification of rock-masses ...34
Table 7.6. Summary of total estimated and measured nominal drilled shaft resistances ...35
Table 7.7. Summary of AASHTO and regionally calibrated resistance factors ...35
Table A.1. Columns 1 through 8 of DSHAFT Display Form ...42
Table A.1. Columns 1 through 8 of DSHAFT Display Form (continued) ...43
Table A.1. Columns 1 through 8 of DSHAFT Display Form (continued) ...44
Table A.1. Columns 1 through 8 of DSHAFT Display Form (continued) ...45
Table A.2. Columns 9 through 15 of DSHAFT Display Form ...46
Table A.2. Columns 9 through 15 of DSHAFT Display Form (continued) ...47
Table A.2. Columns 9 through 15 of DSHAFT Display Form (continued) ...48
Table A.2. Columns 9 through 15 of DSHAFT Display Form (continued) ...49
Table A.3. Columns 16 through 23 of DSHAFT Display Form ...50
Table A.3. Columns 16 through 23 of DSHAFT Display Form (continued) ...51
Table A.3. Columns 16 through 23 of DSHAFT Display Form (continued) ...52
Table A.3. Columns 16 through 23 of DSHAFT Display Form (continued) ...53
Table A.4. Columns 24 through 32 of DSHAFT Display Form ...54
Table A.4. Columns 24 through 32 of DSHAFT Display Form (continued) ...55
Table A.4. Columns 24 through 32 of DSHAFT Display Form (continued) ...56
Table A.4. Columns 24 through 32 of DSHAFT Display Form (continued) ...57
Table A.5. Columns 33 through 38 of DSHAFT Display Form ...58
Table A.5. Columns 33 through 38 of DSHAFT Display Form (continued) ...59
Table A.5. Columns 33 through 38 of DSHAFT Display Form (continued) ...60
Table A.5. Columns 33 through 38 of DSHAFT Display Form (continued) ...61
Table B.1. Subsurface profile and material parameters for data point ID No. 1 ...62
Table B.2. Subsurface profile and material parameters for data point ID No. 2 ...62
Table B.3. Subsurface profile and material parameters for data point ID No. 3 ...62
Table B.4. Subsurface profile and material parameters for data point ID No. 4 ...63
Table B.5. Subsurface profile and material parameters for data point ID No. 5 ...63
Table B.6. Subsurface profile and material parameters for data point ID No. 6 ...64
Table B.7. Subsurface profile and material parameters for data point ID No. 7 ...64
Table B.8. Subsurface profile and material parameters for data point ID No. 8 ...65
Table B.9. Subsurface profile and material parameters for data point ID No. 9 ...65
Table B.10. Subsurface profile and material parameters for data point ID No. 10 ...65
Table B.11. Subsurface profile and material parameters for data point ID No. 11 ...66
Table B.12. Subsurface profile and material parameters for data point ID No. 26 ...66
ACKNOWLEDGMENTS
The authors would like to thank the Office of Bridges and Structures at the Iowa Department of Transportation (DOT) for sponsoring the Drilled SHAft Foundation Testing (DSHAFT) project and the Federal Highway Administration for state planning and research (SPR) funds used for this project.
EXECUTIVE SUMMARY
Problem Statement
Drilled shafts have been used in the US for more than 100 years in bridges and buildings as a deep foundation alternative. For many of these applications, the drilled shafts were designed using the Working Stress Design (WSD) approach. Even though WSD has been used
successfully in the past, a move toward Load Resistance Factor Design (LRFD) for foundation applications began when the Federal Highway Administration (FHWA) issued a policy
memorandum in 2000 requiring all new bridges initiated after October 1, 2007 to be designed using the LRFD approach.
The American Association of State Highway and Transportation Officials (AASHTO) recommends resistance factors based on general soil classification, which results in an overly conservative and less cost-effective drilled shaft design. Because bridge foundation systems generally account for as much as 30 percent of the entire bridge cost, a regional calibration of resistance factors is permitted by AASHTO to improve the economy of foundations and to make the drilled shaft option competitive with the driven pile foundation.
The goal of this project was to develop a quality assured, electronic Database for Drilled SHAft Foundation Testing (DSHAFT), which is intended to establish LRFD resistance factors for the design of drilled shafts in the Midwest region. To achieve this goal, available static load test information was collected, reviewed, and integrated into DSHAFT using Microsoft Office Access™. In doing so, an efficient, easy-to-use filtering and capability was provided to DSHAFT, along with easy access to original field records in an electronic format.
Background
Drilled shaft foundations are large diameter, cast-in-place piles that support axial loads though a combination of shaft and end bearing resistances. They are referred to as bored piles, caissons, cast-in-drilled-hole piles (CIDH), continuous-flight-auger piles (CFA), displacement auger-cast piles, and drilled piers. Since the 1900s several cities in the US have used caissons or shafts to support buildings and transportation structures.
Project Objectives
Provide a means of electronic storage for all past, present, and future Iowa Department of Transportation (DOT) drilled shaft load test data for subsequent reference and analysis
Collect, review, and integrate data from available static load tests in Iowa and other states on drilled shafts into a quality assured, electronic database, using Microsoft Office Access™
Make filtering, sorting, and querying procedures more efficient by using a collective dataset designed in the display form
Be housed on a website so that the information can be shared with designers and researchers
Research Description
Thirty-two drilled shaft load tests were performed and provided by the Iowa, Illinois, Minnesota, and Missouri DOTs and Nebraska Department of Roads (DOR). In addition, the load test
performed in Tennessee was located in a report titled Load Testing of Drilled Shaft Foundation in Limestone, Nashville, TN (Brown 2008).
The detailed information provided in most of the reports includes location, construction details, subsurface conditions, drilled shaft geometry, load testing methods and results, and concrete quality. Because the available information was stored in several different locations and formats, the process to calibrate the LRFD resistance factors would have proved inefficient.
After the available information was implemented into the database, a preliminary calibration of LRFD resistance factors was performed to find if a sufficient amount of information is available for a regional calibration. The preliminary analysis was completed using the 13 datasets collected in Iowa.
From this analysis, it was concluded that more load tests must be included into the database for accurate calibration of suitable resistant factors. As a result, load test information was included from surrounding states.
Key Features of DSHAFT
Because the resistance factors will be calibrated using the information included in the
database, it is vital to have a strict acceptance criteria for reports being entered into DSHAFT to make the LRFD regional calibration of superior quality and consistency.
Not all load test reports found and input into the database contain complete information. This data was included even though some of the information was missing, such as a detailed bore log. The rationale is that each one has the potential to be qualified once the information has been made available. To notify the user when this occurs, the usable data sets are identified by a yes/no category titled usable data.
The distinctions between Osterberg and Statnamic load tests are critical because the data contained in each of the reports is different. The data from either report can be used to determine the capacity of the drilled shaft by using a different technique.
A major aspect when analyzing the results of axial load tests on drilled shafts is the soil profile classification, as each category behaves differently and affects the capacity of the drilled shaft accordingly. The soil profile classification system devised for DSHAFT is a series of guidelines to be used on soil information provided in the load test report.
The performance of a drilled shaft dramatically changes when a portion of the shaft is embedded into rock, known as a rock socket. In DSHAFT, rock sockets are identified by a Rock Socketed? yes/no category to account for the potential increase in end bearing and shaft resistance.
A quality control measure incorporated into the DSHAFT database is to include the Cross-Hole Sonic Logging (CSL) report, when available.
Implementation Readiness
The construction method and quality control of construction still have a large impact on the drilled shaft and should be taken into consideration when calibrating the regional resistance factors. A set of acceptable guidelines for tolerances during construction should be included with the new resistance factors.
Additional load tests, along with detailed analyses, are needed to provide an accurate statistical calibration of the resistance factors for the final calibration.
Implementation Benefits
DSHAFT embodies a model for effective, regional LRFD calibration procedures consistent with the PIle LOad Test (PILOT) database available at http://srg.cce.iastate.edu/lrfd/, which currently contains driven pile load tests accumulated from the state of Iowa.
DSHAFT allows for collecting, reviewing, and integrating data from available static load tests on drilled shafts into an electronic database. In doing so, efficient, easy-to-use filtering and storage capabilities are available to provide a basis for analytical procedures on the datasets.
DSHAFT is housed on a website so that the information can be easily shared with designers and researchers. The value of DSHAFT comes with the use of this website by Iowa State University and can be found at http://srg.cce.iastate.edu/dshaft.
The easy-to-query interface for DSHAFT allows researchers and designers to further filter the data to fit their needs.
1. INTRODUCTION
Most bridges in Iowa are supported on deep foundations, with driven steel H-piles being the preferred option. A survey of 298 state highway officials, Transportation Research Board (TRB) representatives and state and Federal Highway Administration (FHWA) geotechnical engineers, was conducted by the FHWA on the use of various foundation alternatives and found that of those who responded, 64 percent prefer driven piles, compared to only 5 percent preferring drilled shafts (Paikowsky 2004). Even though H-piles are almost always used, it does not imply that they are always the most cost-effective substructure solution under all soil and construction conditions.
Drilled shafts have the potential to become an economical alternative when considering a deep foundation due to many advantages associated with this type of foundation. The shafts are relatively easy to construct in firm cohesive soils, and can be constructed in caving or karstic soils through the use of casing or slurry. Some of the biggest advantages of drilled shafts are that they a) can be built directly on rock, b) normally have a higher load-carrying capacity, and c) generally do not have large settlements (NCHRP Report 360 2006). Drilled shafts also do not require pile cap and associated connections. In many cases, a single drilled shaft can replace a pile group (Paikowsky 2006). Several state departments of transportation (DOTs) are
increasingly using drilled shafts in substructure design. In Iowa, drilled shafts are not used often even though the soil conditions in many of Iowa’s regions are ideal for using this type of
foundation.
The FHWA mandated the use of Load and Resistance Factor Design (LRFD) approach for designing foundation elements on October 1, 2007. The American Association of State Highway and Transportation Officials (AASHTO) recommends resistance factors based on general soil classification, which results in an overly conservative and less cost-effective drilled shaft design. Since bridge foundation systems generally account for as much as 30 percent of the entire bridge cost, a regional calibration of resistance factors is permitted by AASHTO to improve the
economy of foundations and to make the drilled shaft option competitive with the driven pile foundation.
Allen (2005) compared the resistance factors calibrated for drilled shafts with those obtained from fitting to Allowable Stress Design (ASD) and those determined using the Reliability
Theory from various studies. When calibrated from local test data, the regional resistance factors for drilled shafts will produce a more efficient foundation design, with the possibility of
significantly reducing the cost of construction. Consequently, regional calibration of resistance factors will make drilled shafts a competitive foundation option when compared to driven piles.
When calibrating resistance factors for drilled shafts, a few challenges need to be taken into consideration to assure the performance of the substructure. Construction practice is a major issue when it comes to the performance of the drilled shaft because the drilling technique influences the disturbance of the bottom of the excavated hole (Osterberg 1999). In addition, high variability between soil types is a major challenge when predicting the capacity of the drilled shaft. It was found that in harder shale bedrock formations, the shaft and end bearing capacities measured from an Osterberg test were well above the predicted capacity of Colorado Standard Penetration Test (SPT) based design method (Abu-Hejleh 2005), as may be the case in other locations. Finally, lower redundancy than traditional steel H-piles leaves little room for error in design and construction. In order to improve the design of drilled shafts, it is vital to calibrate regional resistance factors with a strict set of criteria and guidelines.
The purpose of this report is to introduce the Database for Drilled SHAft Foundation Testing (DSHAFT), which is intended to establish LRFD resistance factors for the design of drilled shafts in the Midwest region. As illustrated in Figure 1.1. Distribution of drilled shaft load tests reported in DSHAFT by location , a total of thirty-two drilled shaft load tests have been
performed and provided by the Iowa, Illinois, Minnesota, and Missouri DOTs and Nebraska Department of Roads (DOR). Additionally, the load test performed in Tennessee was located in a report titled “Load Testing of Drilled Shaft Foundation in Limestone, Nashville, TN” (Brown 2008). The detailed information provided in most of the reports included location, construction details, subsurface conditions, drilled shaft geometry, load testing methods and results, and concrete quality. Because the available information was stored in several different locations and formats, the process to calibrate the LRFD resistance factors would have proved inefficient. The goal when creating DSHAFT was to collect, review, and integrate data from available static load tests on drilled shafts into a quality assured, electronic database, using Microsoft Office
AccessTM. In doing so, an efficient, easy-to-use filtering and storage location was completed to provide a basis for analytical procedures on the available datasets.
After the available information was implemented into the database, a preliminary calibration of LRFD resistance factors was performed to find if sufficient amount of information is available for a regional calibration. The preliminary analysis was completed using the 13 datasets collected in Iowa. Table 1 provides a brief summary of the information used to complete this calibration. From this analysis, it was concluded that more load tests must be included into the database for calibration. As a result, load test information was included from surrounding states.
database was originally fashioned will also be provided, followed by a comprehensive review of all fields contained within the database.
Figure 1.1. Distribution of drilled shaft load tests reported in DSHAFT by location
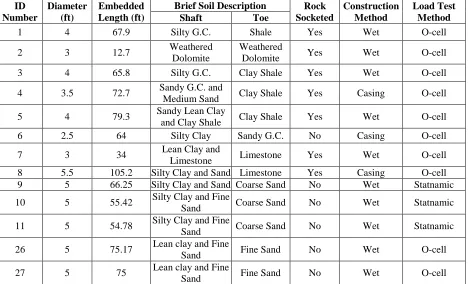
Table 1.1. Summary of 13 drilled shaft datasets collected in Iowa
ID Number Diameter (ft) Embedded Length (ft)
Brief Soil Description Rock Socketed
Construction Method
Load Test Method
Shaft Toe
1 4 67.9 Silty G.C. Shale Yes Wet O-cell
2 3 12.7 Weathered
Dolomite
Weathered
Dolomite Yes Wet O-cell
3 4 65.8 Silty G.C. Clay Shale Yes Wet O-cell
4 3.5 72.7 Sandy G.C. and
Medium Sand Clay Shale Yes Casing O-cell
5 4 79.3 Sandy Lean Clay
and Clay Shale Clay Shale Yes Wet O-cell
6 2.5 64 Silty Clay Sandy G.C. No Casing O-cell
7 3 34 Lean Clay and
Limestone Limestone Yes Wet O-cell
8 5.5 105.2 Silty Clay and Sand Limestone Yes Casing O-cell
9 5 66.25 Silty Clay and Sand Coarse Sand No Wet Statnamic
10 5 55.42 Silty Clay and Fine
Sand Coarse Sand No Wet Statnamic
11 5 54.78 Silty Clay and Fine
Sand Coarse Sand No Wet Statnamic
26 5 75.17 Lean clay and Fine
Sand Fine Sand No Wet O-cell
27 5 75 Lean clay and Fine
Sand Fine Sand No Wet O-cell
G.C. – glacial clay
[image:21.612.74.542.419.703.2]2. BACKGROUND
Drilled shaft foundations are large diameter, cast-in-place piles that support axial loads though a combination of shaft and end bearing resistances. They are referred to as bored piles, caissons, cast-in-drilled-hole piles (CIDH), continuous-flight-auger piles (CFA), displacement auger-cast piles, and drilled piers. Since the 1900s, several cities in the US have used caissons or shafts to support buildings and some transportation structures. Originally these shafts were excavated by hand; it was not until the 1920s that machine-drilled shafts were being developed. Today’s drilling techniques range from small truck mounted equipment to modern machines capable of drilling large, deep shafts through very hard materials.
Using the different construction techniques, drilled shafts can be installed in a variety of soil and rock profiles. The methods for construction of drilled shafts can be grouped into three broad categories of dry method, casing method, and wet method. For firm clays, intermediate
geomaterial (IGM), and rock profiles, the dry method can generally be used for construction. The advantages of using this method are it is the least expensive of the construction methods and it allows the borehole to be visually inspected. The process for constructing a drilled shaft using the dry method is depicted in Figure 2.1. Dry method of construction: (a) drill the hole, (b) clean the base, (c) place reinforcement, and (d) place concrete (FHWA 2010).
Figure 2.1. Dry method of construction: (a) drill the hole, (b) clean the base, (c) place reinforcement, and (d) place concrete (FHWA 2010)
If the possibility of having caving soils, excessive soil, or rock deformation exists while
excavating the drilled shaft is present, the casing method is used. In addition, casing can be used in karstic soils where caves are present below grade and in excavations through water. There are three commonly used methods for installing the casing (FHWA 2010): (1) begin excavation using the dry method and then install the casing into the hole, (2) begin excavation using a starter
hole filled with slurry and install the casing to the bearing stratum as shown in Figure 2., and (3) install casing before excavation, depicted in Figure 2..
Figure 2.2. Construction using casing through slurry-filled starter hole: (a) drill with slurry; (b) set casing and bail slurry; (c) complete and clean excavation, set reinforcing; (d)
place concrete to head greater than external water pressure; (e) pull casing while adding concrete (FHWA 2010)
Figure 2.3. Construction using casing advanced ahead of excavation: (a) drive casing into bearing stratum; (b) drill through casing; (c) complete and clean hole, set reinforcing; (d) place concrete to head greater than external water pressure; (e) pull casing while adding
concrete (FHWA 2010)
For soil conditions that prohibit the dewatering of the shaft excavation, the wet method for construction is used. The wet method uses a mineral or polymer slurry to provide stability and prevent inflow of groundwater (FHWA 2010). The wet method is normally preferred over permanent casing due to the lower cost. Figure 2. shows the process of constructing a drilled shaft using the wet method.
(a) (b) (c) (d) (e)
Figure 2.4. Slurry drilling process: (a) set starter casing; (b) fill with slurry; (c) complete and clean excavation, set reinforcing; (d) place concrete through tremie; and (e) pull tremie
while adding concrete (FHWA 2010)
The most efficient design for a drilled shaft is when a hard bearing layer is present to allow for large axial resistance by means of end bearing with a small footprint. Many times, one single drilled shaft can take the place of a pile group, eliminating the need for a pile cap and pile-to-cap connections. In addition, when the casing method is employed to construct the drilled shaft in water, the permanent casing eliminates the need for a cofferdam. Drilled shafts reduce noise and vibrations that are caused when piles are driven, which is an important consideration in urban settings.
In many cases, drilled shafts are socketed into rock. The Iowa DOT almost routinely requires a drilled shaft to be socketed into rock a minimum distance of 1½ times the shaft diameter (Iowa DOT 2011). Rock sockets are used because they increase the end bearing capacity, significantly enhancing the efficiency of the drilled shaft due to the large end bearing area when compared to that of a driven pile. For example, a typical steel H-pile would be a HP 10x57 with an area of 16.8 in.2, while a diameter of a drilled shaft typically ranges from 3 to 12 ft. A 3-ft diameter drilled shaft would have an area of 1,018 in.2, which is 60 times more than that of HP 10x57. Drilled shafts that are not socketed into rock are known as floating shafts (FHWA 2010). They still have an end bearing resistance, but it is greatly reduced.
The current design philosophy for drilled shafts used by the Iowa DOT is LRFD, but regional resistance factors for drilled shafts have not been calibrated. The Iowa LRFD Bridge Design Manual (Iowa DOT 2011) references AASHTO LRFD Bridge Design Specifications (2007) and
Drilled Shafts: Construction Procedures and LRFD Design Methods (Brown et al. 2010) for general drilled shaft design, unless otherwise specified in the manual. The goal of LRFD
foundation design is to ensure compatibility between superstructure and substructure designs and to facilitate uniformity to reduce errors when passing information, such as loads, to the
foundation designer. In order to incorporate accurate sources of uncertainty into each load and resistance component, regional calibration of resistance factors must be completed.
3. SIGNIFICANCE OF DSHAFT
AASHTO has developed resistance factors for general soil profiles to provide a means to start moving forward in the process of LRFD design of drilled shafts. These resistance factors were calibrated using the WSD factors of safety to maintain consistent results while still ensuring the same level of safety. AASHTO supports the research for calibrating regional resistance factors in accordance with the desired reliability for design, as a means to improve the reliability,
economy, and competitiveness of drilled shafts. In order to accomplish regional calibration, historical drilled shaft load tests must be compiled in order to analyze past experience. Through the use of axial load tests, resistance factors can be developed that will produce a more reliable and economic design.
The PILOT database (Roling et al. 2011), comprising driven pile load tests located in Iowa, provided a template for the design of DSHAFT with the intent for it to embody a model for effective regional LRFD calibration procedures consistent with driven piles. From this database, resistance factors for Iowa were calibrated and are being implemented into the Iowa LRFD Bridge Design Manual (Iowa DOT 2010).
Other state DOTs, such as Florida (McVay et al. 2003), Kansas (Yang et al. 2010), Louisiana (Abu-Farsakh et al. 2010), and Ohio (Nusairat et al. 2011), have calibrated regional resistance factors for drilled shafts, but no database information has been made available for the public to use. In addition, NCHRP 507 (Paikowsky 2004) outlines the calibration of resistance factors using a database developed by University of Florida, but has limited information with regards to the actual load tests. Without the data, it is difficult to determine the quality of the information used to calibrate the resistance factors. DSHAFT is housed on a website so that the information can be shared with designers and researchers. The value of DSHAFT comes with the use of this website by Iowa State University and can be found at http://srg.cce.iastate.edu/dshaft.
4. KEY TERMINOLOGY USED FOR DATA QUALITY ASSURANCE
To ensure the superior quality of DSHAFT, strict acceptance criteria for the available test information was used. The quality assurance of the data is the driving factor when adding each new dataset to the database. The level of quality criteria for each load test, deeming the datasets as usable and complete, were defined by the types of load tests, the soil and rock classification, cross-hole sonic logging (CSL), and the information on where the report was obtained.
It is important to note that not all load test reports found and put into the database meet the expected quality. This data was included even though some the information was missing, such as a detailed bore log. The rationale is that each one has the potential to be qualified once the
information has been made available. To notify the user when this occurs, the usable data sets are identified by a yes/no category titled “Usable Data.” This field can easily be sorted to hide the unusable data.
Another notification along with the “Usable Data” notification mentioned above is the “All Record Data Entered?” warning. The notification informs the user when a complete dataset has been added. An additional benefit of the “Usable Data” notification is that it creates a check for those maintaining the database to help eliminate missing information.
Early in the project, it was decided at this time to exclude any lateral load tests from DSHAFT, but allow for the expansion of the database to include lateral load tests in the future. The reason behind this decision is to simplify the database. Only two axial load test methods, the Osterberg and Statnamic, are included in the database because they are not only the most prevalent load tests in the region, but they are also preferred by most DOTs.
Of the two axial load test methods included in DSHAFT, the Osterberg is the most common axial load test method used in the US. It uses a sacrificial load cell that hydraulically applies a static load at or near the bottom of the drilled shaft (Osterberg 1995). The idea behind the test setup is the shaft above the load cell will move upward and measure the shaft resistance from skin friction, while the shaft below will measure toe resistance. The advantage of performing the Osterberg test is that the two components, shaft and toe resistances, are quantified separately. It is essential to note that once the cell is pressurized internally, the upward force is equal but opposite to the downward force, and that the shaft is assumed rigid. The compression of the shaft is considered negligible and therefore ignored.
A major aspect when analyzing the results of axial load tests on drilled shafts is the soil profile classification, as each category behaves differently and affects the capacity of the drilled shaft accordingly. Thus, it is important to use a dependable classification for the soil profile of the drilled shafts. The soil profile classification system devised for DSHAFT is a series of guidelines to be used on soil information provided in the load test report. The three main categories used when classifying the soil profile are clay, sand, and mixed. To maintain consistency with PILOT soil profile classification (Roling et al. 2011) and due to a rational verification of that soil
classification (AbdelSalam et al. 2011), the 30 percent rule based was used. The rule is based on the Unified Soil Classification System (USCS) as well as Iowa DOT soil descriptions. Therefore, if less than 30 percent of the competent soil along a shaft is classified as cohesive materials, the soil profile of that shaft is categorized as sand. Similarly, if 30 percent or less of the competent soil profile along the shaft is made of cohesionless materials, the soil of that shaft is classified clay. In all other intermediate cases, the soil profile is categorized as mixed.
The performance of a drilled shaft dramatically changes when a portion of the shaft is embedded into rock, known as a rock socket. To classify the material as rock, the unconfined compressive strength (qu) must be greater than 100 ksf. In between rock and soil is a large variation of
material known as intermediate geomaterial (IGM). According to Brown et al. (2010), cohesive IGM is defined as material that exhibits qu in the range of 10 ksf to 100 ksf. Anything below 5
ksf is classified as soil. In DSHAFT, rock sockets are identified by a “Rock Socketed?” yes/no category to account for the potential increase in end bearing and shaft resistance.
5. DESCRIPTIVE SUMMARY OF DSHAFT DATA SUBSET
A descriptive summary of the thirty-two drilled shaft load tests completed and submitted by the Iowa, Illinois, Minnesota, and Missouri DOTs and the Nebraska DOR is provided in the
following sections. Details of tests including soil types, construction method, and testing method are presented.
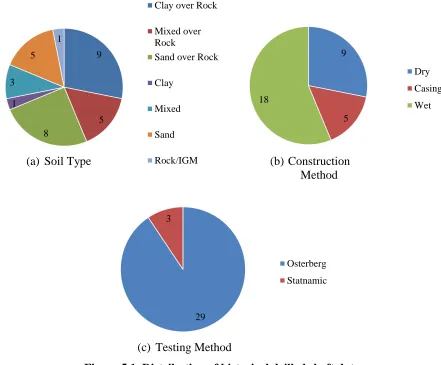
Of the dataset information included in DSHAFT, most of the drilled shaft load tests were performed in clay soils overlaying rock, as illustrated by Figure 5.1(a). Seventy-two percent of all datasets included in DSHAFT are rock socketed. When comparing data sets based on
[image:28.612.84.525.304.669.2]construction method, Figure 5.1(b) shows that 28 percent of the drilled shafts in DSHAFT were constructed using the dry method. Between the wet method and casing method, the wet method was used 78 percent of the time out of 23 load test cases. Overall, out of all 32 data sets, the wet and casing method combined were used 72 percent of the time, as compared to the dry method.
Figure 5.1. Distribution of historical drilled shaft data
9
5 8
1 3
5 1
Clay over Rock
Mixed over Rock
Sand over Rock
Clay
Mixed
Sand
Rock/IGM
9
5 18
Dry
Casing
Wet
29 3
Osterberg
Statnamic
(a) Soil Type (b) Construction
Method
The distinctions between Osterberg and Statnamic load tests are critical because the data
contained in each of the reports is different. The data from either report can be used to determine the capacity of the drilled shaft by using a different technique. For example, the Osterberg test gives the static load versus shaft displacement and toe displacement, while the Statnamic test gives a Statnamic load versus Statnamic displacement that has to be regressed to static loads and corresponding displacements. Figure 5.1(c) indicates that the most utilized load test is the Osterberg load test. All three Statnamic tests available in DSHAFT were performed on the same project site in Council Bluffs, Iowa, by Applied Foundation Testing.
In order to see the grouping of drilled shaft load tests by location, a map is included in Figure 5.2. The significance of the figure is to illustrate natural breaks in the regional grouping of information included in the database for resistance factor calibration. The natural breaks indicate where more load tests may need to be performed. At some of the locations identified by stars in Figure 5.2, multiple load tests were performed, but the purpose of the map is to show where more drilled shaft load tests need to be performed in order to obtain a true regional calibration.
Figure 5.2. Location of drilled shaft test sites Utah
Tennessee Kentucky Indiana Illinois Minnesota
Missouri Iowa South
Dakota
Kansas Colorado
Nevada
6. DSHAFT USER MANUAL
DSHAFT was developed to provide a means of electronic storage for all past, present, and future Iowa DOT drilled shaft load test data for subsequent reference and analysis. The purpose of the following user manual is to provide a comprehensive explanation of the features incorporated into DSHAFT, the details of how the quality of data was assured, information on how to add new load test data, and the minimum required extent of details for new data.
6.1 Accessing DSHAFT
To download and save a copy of the most recent version of DSHAFT, follow the steps listed below:
1. Set Internet Explorer as your default web browser to access PDF files, which contain project information and load test data, via hyperlinks in DSHAFT.
a) Open Internet Options by clicking the “Start” button, clicking “Control Panel”, clicking “Network and Internet”, and then clicking Internet “Options.”
b) Click the “Programs” tab, and then “Default Programs.”
c) Click “Set Default Programs”, select “Internet Explorer”, and then click “Set this program as default.”
d) Click “OK”, and then close the window.
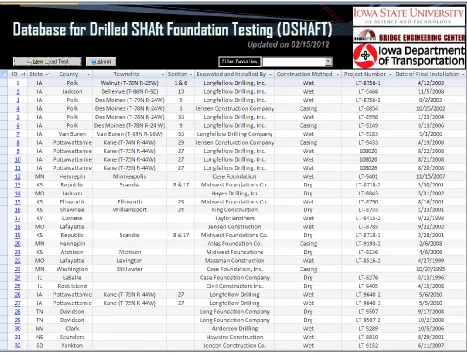
[image:30.612.175.439.459.701.2]2. Open Internet Explorer and go to srg.cce.iastate.edu/dshaft. The home page of the website is shown in Figure 6.1. Click on the “Download D-Shaft” tab.
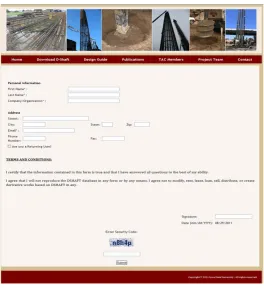
3. Complete DSHAFT request form as shown in Figure 6.2.
Figure 6.2. DSHAFT request form
4. A link to download DSHAFT will be emailed to you. 5. Click the link to download a copy of DSHAFT. Click Open.
6.2 Description of DSHAFT Database Fields
DSHAFT was developed using Microsoft Office AccessTM 2007 with the intent of creating an archive of drilled shaft testing information. The design of the database is to make filtering, sorting, and querying procedures more efficient by using a collective dataset. The database consists of two main forms: DSHAFT Display Form and Drilled Shaft Load Test Record Form.
Figure 6.3. DSHAFT Display Form (Microsoft Office AccessTM 2007)
A unique hyperlinked identification number is created for each available load test to provide a porthole to the second of the two forms, the Drilled Shaft Load Test Record Form (DSLTRF). Here, six descriptive categories are displayed to organize the detailed information contained in the load test report to provide an easy-to-use interface. The DSLTRF consists of general information and five tabbed subforms, as shown in Figure 6.4. The database fields included in this form are explicitly described below.
6.2.1 General Drilled Shaft Load Test Record Form Information
Figure 6.4. Drilled Shaft Load Test Record Form (DSLTRF)
A. ID: A unique cataloging number automatically assigned by Microsoft Office Access ™ to each record within DSHAFT.
B. State: The initials of the state in which the load test was performed is input into this text database field.
C. County: The name of the county corresponding to the location of the specified load test is input into this text database field.
E. Section: The section number of the location of the specified load test is input into this numerical database field.
F. Bridge Contractor: The name of the contracting company responsible for the construction of the specified bridge project is input into this text database field.
G. Project Number: The unique DOT cataloging number assigned to each construction project is input into this text database field.
H. Design Number: For every construction project in each state, all bridge projects are assigned a unique design number. The bridge design number corresponding to a specified drilled shaft load test is entered into this text database field.
I. Drilled Shaft Location: This text database field allows the user to enter a short description of the drilled shaft location in relation to the features of the bridge under construction. For instance, a typical description will specify if the drilled shaft was located near an abutment or a pier. Either the drilled shaft number or a detailed narrative identifying the exact position of the pile within the abutment or pier is usually provided.
J. Construction Method of Drilled Shaft:The method used to construct the drilled shaft is chosen from a drop down menu in this text database field. The options available are: Casing, Dry, or Wet.
K. Installed By: The name of the construction company responsible for installing the drilled shaft is input into this text database field.
L. Project Number: The unique project number for the load test is entered in this text database field.
M. Date of Installation: The date that the drilled shaft was constructed is recorded in this date/time database field. The format to accept dated entries is month/day/year (e.g., 3/8/1984).
N. Tested By: The names of the people who were responsible for carrying out the drilled shaft load test on the specified drilled shaft is input into this text database field.
O. Date Tested: The date when the drilled shaft load test was performed is recorded in this date/time database field. The format to accept dated entries is month/day/year (e.g., 3/8/1984).
P. Date Reported: The date on which the drilled shaft load test results were reported is input into this date/time database field. The format to accept dated entries is
month/day/year (e.g., 3/8/1984).
R. Total Length of Drilled Shaft (ft): The total length of the drilled shaft is recorded in this numerical database field. This is measured from the top of the concrete to the toe of the shaft.
S. Depth to Toe of Shaft (ft): The embedded depth of the drilled shaft is input in this numerical database field. This is measured from the ground surface elevation to the toe of the shaft.
T. Unconfined Compressive Concrete Strength (psi): The measured 28-day unconfined compressive concrete strength of the drilled shaft is input into this numerical database field.
U. ReBar Cage Diameter (in.): The diameter of the ReBar cage used to reinforce the drilled shaft is input into this numerical database field.
V. Number of Longitudinal Reinforcing Bars: The number of longitudinal reinforcing bars used in the construction of the drilled shaft is input into this numerical database field.
W.Bar Size: A bar size chosen from a drop down menu specifying the size of the
longitudinal reinforcement used in the construction of the drilled shaft in this numerical database field. The available options for selection are as follows: #3, #4, #5, #6, #7, #8, #9, #10, #11, #14, and #18.
X. Tensile Yield Strength (ksi): The tensile yield strength of the longitudinal reinforcing bars used in the construction of the drilled shaft is specified in this text database field.
Y. Spacing of Transverse Reinforcing Bars (in.): The spacing of the transverse reinforcement along the drill shaft is input in this numerical database field.
Z. Bar Size: The bar size is selected from a drop down menu to define the size of the transverse reinforcement used in the construction of the drilled shaft in this numerical database field. The available options for selection are as follows: #3, #4, #5, #6, #7, #8, #9, #10, #11, #14, and #18.
AA. Tensile Yield Strength (ksi): The tensile yield strength of the transverse reinforcing bars used in the construction of the drilled shaft is specified detailed in this text database field.
BB. Elevation of Ground Surface (ft): The measured ground elevation at the site of the tested drilled shaft is input in this numerical database field.
CC. Elevation of Water Table (ft): When applicable, the water table elevation at the location of the tested drilled shaft is inserted in this numerical database field.
DD. Elevation of Top of Shaft Concrete (ft): The measured elevation of the top of shaft concrete is entered into this numerical database field.
numerical database field.
FF. Load Test Method: The method used to perform the load test on the drilled shaft is chosen from the drop down menu in this text database field. The options available for selection are as follows: Osterberg Test and Statnamic Test. Based on what the user selects the corresponding tab “Osterberg Load Test Details Tab” or the “Statnamic Load Test Tab” should be completed by the user.
GG. Record Comments: Any important information regarding the records is included in this text database field.
HH.-MM. Attachments (1) - (6): These six hyperlink database fields were created so that important information related to each drilled shaft load test could easily be accessed from DSLTRF. The hyperlink text descriptions found within these database fields maintain a direct path to the file of interest.
To add a new hyperlink to the DSLTRF, follow the steps outlined below:
1. Open the desired DSLTRF to which a new hyperlink will be added.
2. Position the cursor over the preferred location, attachments (1) through (6), for the new hyperlink.
3. Right click with the mouse and select Hyperlink. Then click Edit Hyperlink. 4. Locate the file to which the hyperlink will be tied and provide a concise, but
meaningful description of the files in the “Text to Display:” option.
NN. All Record Data Entered?: This yes/no database field was created for the one(s) responsible for the data entry procedures, so that an easy distinction could be made between those records still requiring data to be entered and those that had been termed complete. When all available information has been entered for a specific record, this field receives a check mark.
OO. Usable Data?: This yes/no database field was created for the user, so that an easy identification could be made between usable and unusable datasets. When the available information is deemed complete and acceptable for calibration of resistance factors, this field receives a check mark.
6.2.2 Soil and Rock Information
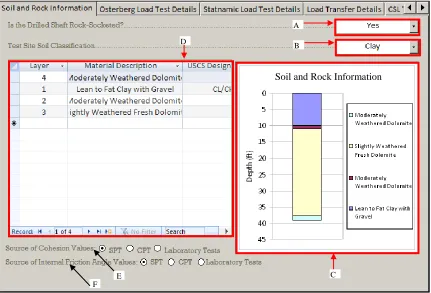
Figure 6.5. Soil and rock information tab of DSLTRF
A. Is the Drilled Shaft Rock-Socketed?: The information regarding if the drilled shaft is rock-socketed is specified in the drop down menu for this yes/no database field.
B. Test Site Soil Classification: The soil at the test site is classified in the drop down menu for this text database field. The options available are clay, sand, and mixed.
C. Soil and Rock Information Profile: This bar graph is generated from the data that has been input into the Soil and Rock Information Table. It uses the Material Description as well as the thickness of the layer to generate the soil profile.
D. Soil and Rock Information Table: The table allows the user to input information about the soil and rock. The available categories are:
Layer: The layer number is input by the user for the main purpose of keeping the soil and rock layers in order. Layer “1” should be the layer closest to the ground surface.
Material Description: The material description serves the purpose of describing the soil or rock layer. (i.e., Firm Glacial Clay or Moderately Weathered Dolomite). This information can be found in the “Soil Boring Log” in the load test report provided.
USCS Designation: This designation allows the user to input the soil type using the USCS for each layer specified in the Soil Boring Log Report.
A B
E F
D
Soil and Rock Information
Thickness (ft): This category is a measure from the top to the bottom of each soil layer. This is useful when classifying the overall soil type.
Cohesion (psf): The measurement of the shear strength of the soil can be recorded by the user into this category.
Internal Friction Angle (degrees): In this category, the measurement of the soil to withstand a shear stress can be entered by the user.
Unit Weight (pcf): The measure of the soil’s weight versus volume can be input into this field.
Moisture Content (%): The measurement representing the amount of water present in the soil can be input into the Moisture Content category as a percentage.
Relative Density (%): In this category the void ratio of sands and gravels is represented as a percentage.
SPT N-Value: The Standard Penetration Test (SPT) N value is the sum of the blow counts for 12 inches of SPT hammer penetration is included into this category.
Unconfined Compressive Strength (psi): The strength of the soil or rock tested uniaxially without lateral restraint is input into this category.
Elastic Modulus (psi): The elastic modulus of the soil can be input into this category.
Core Recovery (%): The length of the core recovered from a borehole, compared with the depth of the hole cored can be recorded in this category as a percentage.
Modified Core Recovery (%): The modified core recovery can be represented in this category as a percentage.
Rock Quality Designation (%): The rock quality designation can be input into this category as a percentage.
a. Source of Cohesion Values: This field allows the user to identify how the cohesion of the soil was tested by marking the appropriate circle. The methods available are SPT, cone penetration test (CPT), and laboratory testing.
b. Source of Internal Friction Angle Values: This field allows the user to identify how the internal friction angle was calculated by marking the appropriate circle. The methods available are SPT, CPT, and laboratory testing.
6.2.3 Osterberg Load Test Details
A. O-Cell Diameter (in.): The diameter of the O-cell is input into this numerical database field.
B. Depth of O-Cell Base (ft): The location of the O-cell with respect to the ground surface is defined in this numerical database field.
C. Load vs. Shaft Displacement Graph: The load vs. shaft displacement graph is automatically created when the user enters the appropriate information into the table described below in subsection E. It depicts the shaft displacement corresponding to the applied O-cell load.
D. Load vs. Toe Displacement Graph: The load vs. toe displacement graph is
automatically created when the user inputs the information into the table described in subsection E. It illustrates the toe displacement of the drilled shaft corresponding to the applied O-cell load.
Figure 6.6. Osterberg load test details tab of DSLTRF Load and Displacement table: This table allows the user to input the shaft and toe displacement corresponding to an applied
O-cell load. This table includes the following columns:
Applied Cell Load (kips): This column consists of the measured applied cell load reported in the testing information.
Shaft Displacement (in.): This column contains the shaft displacement corresponding to the applied cell load that was reported in the testing information.
Toe Displacement (in.): This column specifies the toe displacement of the drilled shaft
E D
B A
corresponding to the applied cell load that was reported in the testing information.
6.2.4 Statnamic Load Test Details
The third tab found on the DSLTRF (i.e., Statnamic Load Test Details) will only be filled out if a Statnamic test was performed. If not, it will be left blank. Illustrated in Figure 6.7, this tab
contains the fields listed below.
Figure 6.7. Illustration of Statnamic load test details tab of DSLTRF
A. Displacement vs. Statnamic Load Graph: This displacement vs. Statnamic load graph is automatically created when the user records information into the table specified in C. It depicts the displacement of the drilled shaft corresponding to the applied Statnamic load.
B. Displacement vs. Static Load Graph: This displacement vs. static load graph is automatically created when the user enters information into the table specified in C. It portrays the displacement of the drilled shaft corresponding to the applied static load.
C. Displacement and Load Table: This table allows the user to input the loads with the corresponding displacement. This table includes the following columns:
Statnamic Displacement (in.): This column represents the displacement corresponding to the Statnamic load.
Statnamic Load (kips): This column represents the load applied to the drilled shaft
A
during Statnamic testing.
Static Displacement (in.): This column details the displacement corresponding to the static load.
Static Load (kips): This column denotes the load applied to the drilled shaft during the static testing.
6.2.5 Load Transfer Details
The fourth tab found on the DSLTRF (i.e., Load Transfer Details) is illustrated in Figure 6.8. It contains the fields listed below.
A. Load vs. Depth Graph: This load vs. depth graph is automatically created when the user inputs information into the table specified in subsection B. It depicts the load increment versus the depth of the drilled shaft.
B. Depth and Load Increments Table: This table allows the user to define the loads for each of the gauges and O-cell, as well as record the corresponding depth of each of the gauges. This table includes Depth(ft) and Load at Increment #1 through Load at Increment #10.
Depth (ft): This column represents the depth of the strain gages, including the O-cell, with respect to the ground surface.
Figure 6.8. Load transfer details tab of DSLTRF
6.2.6 Cross-Hole Sonic Log (CSL) Test Details
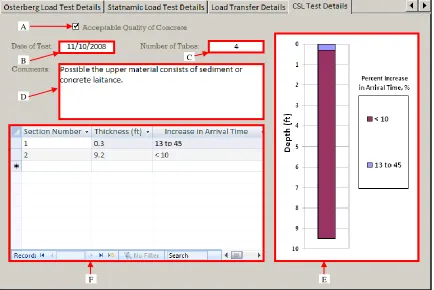
The fifth tab found on the DSLTRF (i.e., CSL Test Details) is illustrated in Figure 6.9. It contains the fields listed below.
A. Acceptable Quality of Concrete: Based on the results from the CSL test, the concrete will be determined to be acceptable or not acceptable by marking the check box for this yes/no database field. Likins (2004) found that the interpretation of CSL results can lead to different conclusions depending on the person interpreting the data. The criteria shown in Table 6.1 will be used to quantify the quality of concrete. Flaws are considered
between the 20 percent to 30 percent velocity reduction and should be addressed if they are found in more than 50 percent of the CSL profiles. Anything greater than a 31 percent velocity reduction is considered a defect and should be addressed if found in more than one profile (Likins et al. 2007)
B. Date of Test: The date on which the CSL test was performed is recorded in this date/time field. The format to accept dated entries is month/day/year (e.g., 3/8/1984).
C. Number of Tubes: The number of tubes used to perform the CSL test is input into this numerical database field.
D. Comments: Any important information regarding the CSL test is included in this text
database field.
E. Percent Increase in Arrival Time Graph: This bar graph is automatically created when the user enters information into the table specified in subsection F. It depicts the percent increase in arrival time along the drilled shaft.
F. Percent Increase in Arrival Time Table: This table allows the user to detail the velocity reduction for a given section of the drilled shaft. This table includes:
Section Number: The section number is input by the user for the main purpose of keeping the section numbers in order along the length of the drilled shaft. Section “1” should be the layer at the top of the drilled shaft.
Thickness (ft): The thickness is the length of the drilled shaft corresponding with the range of increase in arrival time specified in the CSL Test report.
Increase in Arrival Time (%): The time it takes for the signal produced by the sound source to travel to the receiver is measured as the devices are lowered through access tubes along the drilled shaft. The time at one point is compared with the average time it takes the signal to travel as a percentage.
Table 6.1. Concrete condition rating criteria (MoDOT 2012)
Concrete Condition Rating
Rating Symbol
Velocity
Reduction Indicative Results
Good G 0 to 10% Acceptable concrete
Questionable Q 10 to 25%
Minor concrete contamination or intrusion. Questionable quality concrete.
Poor/Defect P/D >25%
Defects exist, possible water or slurry contamination, soil intrusion and/or poor quality concrete.
Water W Velocity = 4760
to 5005 ft/sec
Water intrusion, of water filled gravel with few or no fines present.
No Signal NS No Signal
Received
Figure 6.9. An illustration of CSL test details tab of DSLTRF
6.3 Disclaimer Notice
DSHAFT was established as part of a research project funded by the Iowa DOT and has
compiled data from different DOTs. The Iowa DOT, other DOTs, or the authors of this report do not make any warranty, expressed or implied, or assume any legal liability or responsibility for the accuracy, completeness, or usefulness of any information contained in DSHAFT. If a problem arises during the usage of DSHAFT or more knowledge is required, contact the Iowa DOT or those currently maintaining the database via http://srg.cce.iastate.edu/dshaft/.
B C
D A