International Journal of Innovative Technology and Exploring Engineering (IJITEE) ISSN: 2278-3075, Volume-8 Issue-8, June, 2019
Abstract: Data aggregation has come out as a major approach to lessen the number of sensor nodes transmission and thus minimizing overall power consumption in the network. This process is important because of the limited resources available in the network. Path discovery process and energy utilization in a significant manner are important so that all the data can be collected properly and least energy is utilized. This paper presents a grouping mechanism with advanced route discovery process optimized by Cuckoo Search Algorithm and cross-validated by Neural Network. An improved LEACH has been proposed with an aim to decrease energy consumption. To check the efficiency of the proposed work, varied Quality of Service parameters have been considered, such as Throughput, Packet delivery Ratio, Delay and Energy consumption. A comparative analysis has been performed using MATLAB to verify the efficiency of the proposed work with the existing work. The enhancement in the parameters is due to the sophisticated cross-validation of the proposed model by Artificial Intelligence and optimized CS Algorithm.
Index Terms: Cluster Head, Cuckoo Search, Data Aggregation, LEACH, ANN, Wireless Sensor Network
I. INTRODUCTION
Data Aggregation in Wireless Sensor Network (WSN) is a method of combining and collecting significant information in some appropriate region of interest. The efficacy of the communication between the nodes relies on the techniques of the data aggregation being utilized. It could be taken as an elementary processing method for the reduction of energy consumption and for saving limited resources. The enhancement of network lifetime and energy efficiency is dependent on an efficient data aggregation technique[1]. This paper introduces a clustering mechanism adopted from Low-energy adaptive clustering hierarchy (LEACH) protocol in the data aggregation architecture [2]. LEACH is a method of cluster formation by means of energy conserving. It utilizes the process of randomization for the dispersing of energy expenditure between the sensor nodes. The cluster-based mechanism is considered to carry out data aggregation and Cluster head (CH) and is contemplated as Aggregator. It also utilizes the radio energy model for the proportionate energy utilization structure [3]. The aggregation model also requires a root discovery process and
Revised Manuscript Received on June 15, 2019
Simarjeet Kaur, Assistant Professor, Department of Computer Science & Engineering, Chandigarh University, Gharaun, and Research Scholar, Sri Guru Granth Sahib World University, Fatehgarh Sahib, Punjab, India.
Navdeep Kaur, Professor, Department of Computer Science, Sri Guru
Granth Sahib World University, Fatehgarh Sahib, Punjab, India.
Kamaljit Singh Bhatia, Assistant Professor, Department of Electrical
Engineering, IK Gujral Punjab Technical University, Batala Campus,
then in case of distortion or failure in the network, Cuckoo Search (CS) will be applied [4].
This paper combines the route discovery model with optimized CS and data aggregation [5]. The fitness function of the CS is cross-validated using Artificial Neural Network (ANN) [9]. The general steps according to which the research would be carried out are:
Cluster Mechanism and Route Discovery Optimization Utilizing CS and Data Aggregation Cross-Validation of CS
LEACH Topology
LEACH is a routing protocol which is hierarchical Cluster dependent. In this, the information of every node is sent to Cluster Heads (CH) that is integrated and the reduction of data size is taken place and transferred to the Base Station (BS). In the set-up phase, each node selects while it has to be CH or not. Selecting CH is dependent on the node assessment with arbitrary number selection between zero and one. As the number is not greater from the default threshold Q(n), then the node is taken as CH in case of the isting round. Q(n) being a threshold and that could be described as:
(1)
Here, is an arbitrary number lies between 0 and 1; Probability is the amount of node which is selected as a CH whereas packet data transmission and as the nodes group that were not CHs for traditional rounds.
Improved LEACH
The aim of this research is to decrease energy consumption using LEACH routing protocol to resolve the energy consumption issue. Improved LEACH has a similar method to traditional LEACH. In case of traditional LEACH routing protocol, the CHs amount is the major feature which manipulates the routing protocol performance. When the CH amount is not more, then each CH needs coverage of big regions that addresses the issues that less of Cluster members get isolated from the CH that leads to more energy consumption.
Cluster Head Inspired Energy Efficient Data
Aggregation Scheme for Wireless Sensor
Network
CH and BS communication needs more energy as contrasted to common nodes, more CH amount can improve the energy consumption of full network and then decrease the network lifetime. Therefore, it is needed to select CH for less energy consumption. For improved LEACH, CS has been utilized for choosing CH with new residual energy.
LEACH algorithm arbitrary selection could lead to energy imbalance of sensory nodes that improves the energy consumption. For balanced energy insurance in the network, more measures, such as residual energy by means of consumed energy for data transmission for CH selection process optimization. The objective of the Enhanced CH selection algorithm is not to select less residual energy nodes with more energy nodes consumption of CH. New could be delineated as beneath:
As shown in equation (2), is the residual energy being optimized for communicating nodes and being the nodes preliminary energy as generated in WSN initialization.
(2) With , the probability of decreased residual energy nodes as CH is fewer and probability for additional residual energy nodes as CH improves. Selecting CH depends on the improved residual energy. For residual energy optimization of nodes, CS fitness function has been described as beneath:
(3)
As shown in equation (3), as the remaining energy of selected node as a current egg and as the threshold energy of each other communicating nodes.
(4)
(5)
II. LITERTAUREREVIEW
An existing concept with their theories has been explained below analyze the evident hole in the existing hypothesis of data aggregation in WSN. A novel technique for the safety of data prediction in a wireless sensor network with the concept of Time Series Trust Model (TSTM) on the basis of Toeplitz matrix with Trust based Auto-Regressive (TAR) procedure is given by [7]. Basis Pursuit (BP) is considered to have the best performance. The proposed method has shown a performance with compromised nodes from 10 to 40 % because of the worse mouthing attack. A novel Multi-functional secure Data Aggregation (MODA) scheme is presented by [8]. The homomorphic encryption method is used for enabling in ciphertext aggregation with an end to
end security. Random selected encryption
based Data Aggregation (RODA) and Compression based Data Aggregation (CODA) are considered for the enhancement of results. The outcome has shown an outperformance from theoretical reviews with three real datasets in varied circumstances. The proposed scheme has
International Journal of Innovative Technology and Exploring Engineering (IJITEE) ISSN: 2278-3075, Volume-8 Issue-8, June, 2019
The results have depicted that these parameters have performed well because of decreased collision and redundancy.
Due to random nature, sensor nodes adjust their properties like co-ordinates, transfer rate, energy consumption etc, after initial distribution within the network. Sensor node variability and node failure affects the transmission path, which impacts connectivity in WSN. Unplanned variability can create coverage problem, whereas planned variability can be applied to improve connectivity and for enhancing the lifetime of the network by selecting appropriate CHs. According to the survey, only two types of connectivity is possible in WSN, first is, LEACH based on the node distribution and second is, LEACH based on the energy level of nodes. The first concept is applicable to the static sensor nodes environment. In this paper, the energy level based LEACH routing protocol is presented with Cuckoo Search Algorithm, termed as Improved-LEACH. We have proposed a probabilistic connectivity model to compute connectivity among neighbouring nodes based on the CHs selection technique using the fitness of nodes. The most important contributions of this research work are given below:
We have proposed Improved-LEACH, where the connectivity and remaining energy of mobile sensor nodes are used as properties for selection of CHs. This proposed scheme has significantly improved the performance as compared with the existing schemes which are well described in the results section.
The proposed Improved-LEACH is analyzed under different variability like a different number of nodes and to validate the CHs selection, Artificial Neural Network is used.
III. PROPOSEDWORKMODEL
The proposed work model is segmented in three parts as follows:
1. Cluster Mechanism
Algorithm 1: Identify_Clusterheads (N, ESA, CH count)
// ESA is the list of Energy associated, N Node Count, CH Cluster Head
1. for i=1: N
2. currESA t_Node=1; // ESA of current node currESA
3. t_energy=Energy(i) // Energy of current node 4. for j=1: N
5. If(Energy(i)<E(j)// Condition to become a CH 6. Temp_Value=E(j);
7. Temp_Value=Energy(i); 8. Energy(i)=Temp_Value; 9. End if
10. End for 11. End for
12. SE=E(Select(CH_count)); 13. Find Nodes associated with SE; 14. End Algo
Above given algorithm is used to select a CH in each cluster of network using CS. Sorting the energy in descending order and then within each region one cluster head will be appointed so that each node has to communicate with one cluster head only [10]. The cluster heads will communicate with other cluster head only. The search space and communication range is also shortened to preserve energy [11]. The cluster heads will have to follow the nearest neighbour mechanism to find the nearest cluster head [12].
Algorithm 2: Nearest Neighbor
Let λ be the area covered by any node for communication within the network.
1. λ= Network_width * 28/100; 2. Communication_List=[ ];
3. Communication_dist =[ ]; // List of distance of nodes from other nodes.
4. For each n_d in nodelist
5. x_i= xloc (n_d); // finding the xlocation of the node
6. y_i= yloc (n_d); // finding the ylocation of the node;
7. Communicationcount=0; 8. For each n_j in the node list
9. If n_d != n_j // if both the nodes are not same 10. x_p= xloc (n_j); // x-co-ordinate of node 11. y_p= yloc (n_j); // y-co-ordinate of node 12. d = sqrt ( (〖x_i-x_p)〗^2+(y_i-y_p )^2); 13. if d<=λ
14. Communication_list[n_d,Communicationcount]=n _j;Communication_dist
15. [n_d,Communicationcount]=d;
16. Communication_count=Communicationcount+1; 17. end if
18. end for 19. end for
20. Communication_list = [Node d, Node p, Node j, Node l]- Node x
21. Communication_dist = [220,240,250,245];
2. Optimization Utilizing Cuckoo Search and Data Aggregation
Every cuckoo lays one egg at a time and dumps it in an arbitrarily chosen nest.
The best nests with high-quality eggs will be carried over to the next generations.
The number of available host nests is fixed and the egg laid by a cuckoo may be discovered by the host bird with a probability pa (0, 1). In this case, the host bird can either get rid of the egg or simply abandon the nest and build a completely new nest. According to the rule, every egg in the nest indicates a candidate solution [16]. Thus in original form, one candidate can lay only one egg in their nest but in general, multiple eggs representing a set of solution. The main aim of CS is to provide a better solution in the current net population. On the basis of objective function, their quality has been measured [17].
Algorithm 3: Application of CS
Input: Node_enegy (ALL), N: Total Nodes
Output: SuspectList 1. For i: 1;N
2. Ecurr=Node.Energy(i); //energy of current node 3. Eavg= /N;
4. Time_variation(tv)=Mathematical random (); 5. If (Ecurr>tv>Eavg*tv); //average energy of node 6. SLcount++;
7. SuspsectList[SLcount]=Ecurr.Id; 8. End if
9. End for
Above mentioned algorithm is delineating the procedure of CS in the proposed mechanism. Its aim is to decide which node is CH and which is not. In this algorithm, CH is selected from total number of nodes using fitness function.
3. Cross-validation of CS
[image:4.595.307.548.313.668.2]The selection for the data aggregation node is decided by CS but it has to be cross-validated [18]. Hence a Feed Forward Back Propagation Neural Network (FFBPNN) is utilized. NN is a 3-way propagation model with the sigmoid function at the hidden layer [19] [20]. Fig. 1 shows the NN propagation model.
Figure 1: Propagation Model of Neural Network
IV. RESULTS AND DISCUSSIONS
The evaluation of the result is based on the following parameters:
Average Throughput: Average Throughput is the average of the total received packets in the given time frame.
Packet Delivery Ratio (PDR): It is the ratio of total received packets to the total sent packets. Delay: Total produced a delay in the procedure of
data transfer from one end to another end.
Energy Consumption: Total consumed energy in a given interval of time.
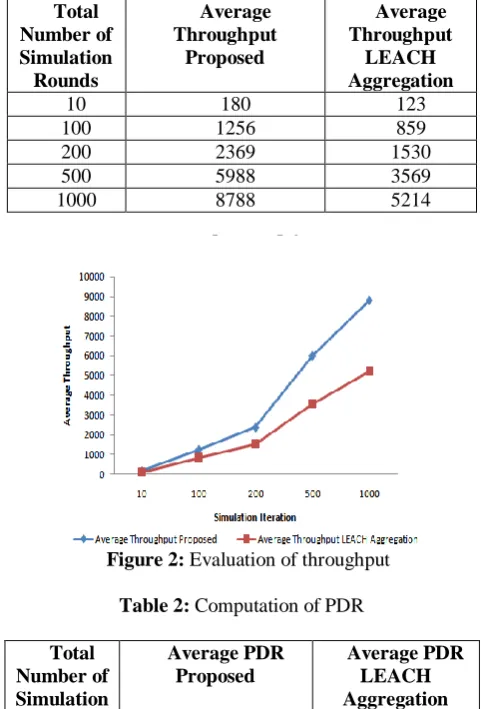
For the computation, parameters, such as Throughput, PDR, Delay and Energy Consumption are considered. The evaluation of throughput is shown in Table 1 and Figure 2, evaluation of PDR is shown in Table 2 and Figure 3, evaluation of Delay is shown in Table 3 and Figure 4 and the evaluation of energy consumption is shown in Table 4 and Figure 5.
Table 1: Computation of Throughput
Total Number of Simulation Rounds
Average Throughput
Proposed
Average Throughput
LEACH Aggregation
10 180 123
100 1256 859
200 2369 1530
500 5988 3569
1000 8788 5214
Figure 2: Evaluation of throughput
Table 2: Computation of PDR
Total Number of Simulation Rounds
Average PDR Proposed
Average PDR LEACH Aggregation
10 0.65 0.32
100 0.69 0.41
200 0.6922 0.42
500 0.6952 0.4236
[image:4.595.50.283.581.756.2]International Journal of Innovative Technology and Exploring Engineering (IJITEE) ISSN: 2278-3075, Volume-8 Issue-8, June, 2019
[image:5.595.325.524.110.248.2]Figure 3: Evaluation of PDR
Table 3: Computation of Delay
Total Number of Simulation Rounds
Average Delay Proposed in ms
Average Delay LEACH Aggregation in
ms
10 13 42
100 16 45
200 17.2 49
500 18.1 52
1000 23 53
Figure 4: Evaluation of Delay
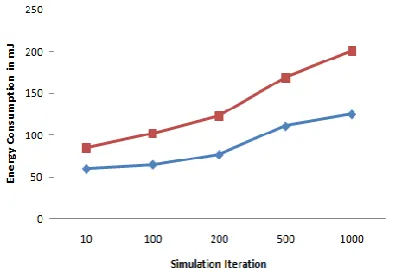
Table 4: Computation of Energy Consumption
Total Number of Simulation Rounds
Energy Consumption Proposed in mJ
Energy Consumption
LEACH Aggregation in
mJ
10 60 85
100 65 102
200 77 123
500 111 169
1000 125 201
A total of 1000 simulation iterations are propagated. The proposed algorithm is also compared with LEACH aggregation mechanism [24].
Figure 5: Evaluation of Energy Consumption The maximum throughput attained by the proposed algorithm is 8788 whereas, for the same scenario, LEACH aggregation mechanism demonstrates a total value of 5214. In a similar fashion, PDR for proposed is .6966 whereas for the LEACH it stands a value of .4311. The proposed algorithm stands a total improvement of
is noticed. In a similar way, PDR improves by
. The story is similar for energy consumption and delay.
IV. COMPARISONOFPROPOSEDWORKWITH
EXISTINGWORK
In this section, we have compared proposed work with existing work based on energy consumption, PDR and delay with respect to packet size.
Table 5: Comparison of Energy Consumption
Packet Size
Proposed Work
Nitin Goyal et al. (2017) [25]
50 92 210
100 96 211
150 93 210
200 90 210
[image:5.595.42.275.271.576.2]Figure 6: Comparison of Energy Consumption Table 5 and Figure 6 are depicting the comparison of energy consumption with proposed and existing work [25] to check the efficiency of the proposed work. The comparison has been drawn on the basis of packet size that ranges from 50 to 250. The average value of energy consumption for proposed work is 93.6 whereas the average value of energy consumption for existing work is 210.4. The reduction of energy consumption in the proposed work is 50%. So it is evident that the proposed work has less energy consumption rate than the existing one.
Table 6: Comparison of PDR
Packet Size
Proposed work
Nitin Goyal et al. (2017)
50 0.359 0.124
100 0.406 0.125
150 0.415 0.123
200 0.435 0.126
250 0.445 0.125
Figure 7: Comparison of PDR
Table 6 and Figure 7 are depicting the comparison of PDR with proposed and existing work [25] to check the efficiency of the proposed work. The comparison has been drawn on the basis of packet size that ranges from 50 to 250. The average value of PDR for proposed work is 0.412 whereas the average value of PDR for existing work is 0.124. The enhancement in PDR in proposed work is of 30% as compared to the existing work; therefore, it is clear that
Table 7: Comparison of Delay
Packet Size
Proposed work
Nitin Goyal et al. (2017)
50 0.044 0.059
100 0.046 0.058
150 0.050 0.057
200 0.055 0.059
250 0.054 0.056
[image:6.595.317.541.80.349.2]Figure 8: Comparison of Delay
Table 7 and Figure 8 are depicting the comparison of Delay with proposed and existing work [25] to check the efficiency of the proposed work. The comparison has been drawn on the basis of packet size that ranges from 50 to 250. The average value of Delay for proposed work is 0.049 whereas the average value of Delay for existing work is 0.057. The percentage decrement of delay in proposed work is 14.14, which is very much better as compared to the existing work.
V. CONCLUSIONANDFUTURESCOPE
[image:6.595.57.288.385.655.2]International Journal of Innovative Technology and Exploring Engineering (IJITEE) ISSN: 2278-3075, Volume-8 Issue-8, June, 2019
Author-1 Photo
Therefore, it is evident that the proposed system has outperformed as compared to traditional work.
The current research work opens a lot of possibility for future research workers. The proposed work can be combined with other cross-validation techniques like Support Vector Machine (SVM), Linear Discriminant Analysis (LDA) etc. A simulation environment varying a total number of nodes can also be checked.
REFERENCES
1. M. Preetha and K. Sivakumar, “An Energy Efficient Sleep Scheduling Protocol for Data Aggregation in WSN,” Taga Journal, 14, 404-414, 2018.
2. F.A. Khan, A. Ahmed and M. Imran, “Energy optimization of PR-LEACH routing scheme using distance awareness in internet of things networks,” International Journal of Parallel Programming, Springer, 1-20, 2018.
3. M. Patil and C. Sharma, “Energy-Efficient Packet Routing Model for Wireless Sensor Network,” In Advances in Electronics, Communication and Computing, Springer, Singapore, pp. 341-350, 2018.
4. G. P. Gupta, “Improved Cuckoo Search-based Clustering Protocol for Wireless Sensor Networks,” Procedia Computer Science, 125, 234-240, 2018.
5. M. Jayekumar and V. Nagarajan, “A novel DEA-OR algorithm for route failure recovery in dense wireless sensor networks,” Cluster Computing, Springer, 1-9, 2018.
6. J. Cui, L.Shao, H. Zhong, Y. Xu and L. Liu, “Data aggregation with end-to-end confidentiality and integrity for large-scale wireless sensor networks,” Peer-to-Peer Networking and Applications, 11(5), 1022-1037, 2018.
7. E. P. K. Gilbert, B. Kaliaperumal, E. B.Rajsingh and M.Lydia, “Trust-based data prediction, aggregation, and reconstruction using compressed sensing for clustered wireless sensor networks, Computers & Electrical Engineering,”72, pp. 894-909, 2018. 8. P. Zhang, J. Wang, K. Guo, F. Wu and G. Min, “Multi-functional
secure data aggregation schemes for WSNs, Ad Hoc Networks,” 69, 86-99,2018.
9. H. R. Roth, L. Lu, N.Lay, A. P.Harrison, A. Farag, A.Sohn and R. M.Summersm, “Spatial aggregation of holistically-nested convolutional neural networks for automated pancreas localization and segmentation,” Medical image analysis, 45, 94-107, 2018. 10. V. S. Devi and N. P. Hegde, “Multipath Security Aware Routing
Protocol for MANET Based on Trust Enhanced Cluster Mechanism for Lossless Multimedia Data Transfer,” Wireless Personal Communications, 100(3), 923-940,2018.
11. M. Asif, S. Khan, R. Ahmad , M.d Sohail and D. Singh, “Quality of Service of Routing Protocols in Wireless Sensor Networks: A Review,” IEEE Access, 5, 1846-1871, 2017.
12. J. Anzola, J. Pascual, G. Tarazona and R. G. Crespo, “A Clustering WSN Routing Protocol Based on k-d Tree Algorithm,” Sensors, 18 (9), 2-26,2018.
13. S. Hu and G. Li, “Fault-Tolerant Clustering Topology Evolution Mechanism of Wireless Sensor Networks,” IEEE Access, 6, 28085-28096, 2018.
14. G. P.Gupta and S. Jha, “Integrated clustering and routing protocol for wireless sensor networks using Cuckoo and Harmony Search based metaheuristic techniques,” Engineering Applications of Artificial Intelligence, 68, 101-109, 2018.
15. M. Kaur and B. S. Sohi, “An Optimized Approach of Routing Enhancement Using Hybrid ABC and Cuckoo Search and Analysed by FFNN,” International Journal of Applied Engineering Research, 13(11), 8913-8921, 2018.
16. H. T. T. Binh, N. T. Hanh, L. V. Quan and N. Dey, “Improved cuckoo search and chaotic flower pollination optimization algorithm for maximizing area coverage in wireless sensor networks,” Neural computing and applications, 30(7), 2305-2317, 2018.
17. J. Zhang , S.J. Liu, P.W. Tsai, F.M. Zou and X.R. Ji, “Directional virtual backbone based data aggregation scheme for Wireless Visual Sensor Networks,” PloS one, 13(5), 1-27,2018.
18. X.S. Yang, S. Deb and S. K. Mishra, Multi-species “Cuckoo Search Algorithm for Global Optimization,” Cognitive Computation, 10 (6), 1085-1095, 2018.
19. J. Ahn, J. Park, D. Park, J. Paek and J. K, “Convolutional neural network-based classification system design with compressed wireless sensor network images,” PloS one,13(5),1-25,2018.
20. S.P. Tirani and A. Avokh, “On the performance of sink placement in WSNs considering energy-balanced compressive sensing-based data aggregation,” Journal of Network and Computer Applications, 107, 38-55, 2018.
21. G.Dhanda an S.S.Tyagi, “Data aggregation techniques in WSN: Survey,” Procedia Computer Science, 92, 378-384, 2016.
22. S. Brown, “An analysis of loss-free data aggregation for high data reliability in wireless sensor networks,” In 2017 28th Irish Signals and Systems Conference (ISSC), IEEE, 1-6, 2017.
23. A. S. Bhatlavande and A. A. Phatak, “Data aggregation techniques in wireless sensor networks: literature survey,” International Journal of Computer Applications, 115(10), 21-24, 2015.
24. M. Elshrkawey, S. M.Elsherif and M.E Wahed, “An enhancement approach for reducing the energy consumption in wireless sensor networks,” Journal of King Saud University-Computer and Information Sciences, 30(2), 259-267, 2018.
25. N. Goyal, M. Dave, A. K. Verma, “Data aggregation in underwater wireless sensor network: Recent approaches and issues,” Journal of King Saud University-Computer and Information Sciences, 1-17,2017.
AUTHORSPROFILE
Simarjeet Kaur completed her BTech(IT) in 2010 and
MTech(CSE) in 2012. Currently she is pursuing her PhD (CSE) in Wireless Sensor Networks from Sri Guru Granth Sahib World University and is also serving as Assistant Professor (CSE) at Chandigarh University, Gharuan. She has published 20 research papers in various international journals.
Dr Navdeep Kaur did her PhD from Indian Institute
of Technology (IIT) Roorkee and now she is working as Professor in Computer Science Department at Sri Guru Granth Sahib World University. Her area of research are Information Security and Mobile Computing. She has published 136 research papers in various refereed International journals and conferences. She is a life member of Indian Society of Technical Education (ISTE).
![Table 7 and Figure 8 are depicting the comparison of Delay with proposed and existing work [25] to check the efficiency of the proposed work](https://thumb-us.123doks.com/thumbv2/123dok_us/8201458.260969/6.595.57.288.385.655/table-figure-depicting-comparison-proposed-existing-efficiency-proposed.webp)
