“ANALYSIS OF THE
ASPERGILLUS NIDULANS
TRANSCRIPTOME USING HIGH-THROUGHPUT RNA
SEQUENCING”
Thesis submitted in accordance with the requirements of the University of Liverpool for the degree of Doctor in Philosophy
by
Christopher John Sibthorp
2 Abstract
The filamentous fungus, Aspergillus nidulans is a well-characterized model organism which has been used extensively for the study of eukaryotic cell biology and genetics over the past
60 years. The A. nidulans genome was sequenced in 2005, and various genome annotations have been released since, the majority of which rely heavily on in silico gene prediction. The development of high-throughput next generation sequencing technologies has revolutionised
transcriptomics by allowing RNA-analysis of whole transcriptomes through massively
parallel cDNA sequencing (RNA-seq). This sequencing approach has been applied to the A. nidulans transcriptome, and augmented by the development of a novel strategy for selectively sequencing the 5′ ends of RNAs on the ABI SOLiD platform. This aimed to produce a more robust resource for gene interrogation and the investigation of regulatory elements which
impact on the transcriptomal landscape in A. nidulans. Bioinformatic analysis RNA-seq data was used to define 15,375 transcription start site (TSS) regions, which have been
characterised by statistical analysis of mapped 5′ end distribution. Motif finding within sequence regions surrounding these TSS identified 16 putative functional promoter motifs
based on overrepresentation and distributional analysis within promoters, and GO annotation
found significant functional enrichment amongst genes associated with two of these motifs
(AARARAAA and TTTYTTY). Transcript assembly of RNA-seq data has also revealed
16065 putative transcripts, 1112 of which were mapped to regions annotated as intergenic.
From these transcripts we identified 38 strong candidates for novel protein coding genes (six
of which contained non-canonical translation start sites), and over 400 additional transcripts
containing putative coding regions. Separation of RNA-seq data in two sets of strand specific
reads was shown to greatly increase the quality of transcript assembly and facilitated the
identification of 2291 occurrences of sense:antisense overlap between assembled transcripts,
3
used to detect multiple transcript isoforms arising from alternative splicing events. 374
distinct loci were identified as the origins of alternatively spliced transcripts, and six of these
4 List of contents
1. Introduction and aims
1.1. Importance of the Aspergilli 19
1.2. The Aspergillus nidulans genome 20
1.3. Transcription of mRNA in eukaryotes 22
1.4. Nitrogen metabolism in Aspergillus nidulans 26
1.5. The development of high-throughput sequencing 27
1.6. The challenges of high-throughput RNA-seq 29
1.7. The ABI SOLiD system 32
1.8. Aims 39
2. Materials and methods
2.1. Synthetic oligonucleotides 41
2.2. Aspergillus nidulans strains and maintenance. 43
2.2.1. Aspergillus nidulans strains 43
2.2.2. Growth media 43
2.2.3. Aspergillus nidulans solutions and media 43
2.2.4. Maintenance of Aspergillus nidulans cultures 43
2.3. Molecular techniques for the manipulation of nucleic acids
2.3.1. Aspergillus nidulans RNA extraction 44
2.3.2. Nucleic acid quantification 45
2.3.3. Agarose gel electrophoresis of DNA 46
5
2.3.5. Phenol:chloroform isolation 47
2.3.6. Poly(A) selection using oligo(dT) 47
2.3.7. DNA depletion with DNase I 47
2.3.8. 5′ decapping of RNA with tobacco acid pyrophosphatase 48
2.3.9. RNA fragmentation with zinc acetate 48
2.3.10. End repair with T4 polynucleotide kinase 49
2.3.11. RNase H degradation of RNA in RNA/DNA duplexes – manufacturer’s
protocol 49
2.3.12. RNase H degradation of single stranded RNA in RNA/DNA duplex –
modified protocol 50
2.3.13. First strand cDNA synthesis with random priming P2 50
2.3.14. P1 adaptor ligation 51
2.3.15. Second strand synthesis with proofreading TAQ 51
2.3.16. Chemically fragmented library amplification with primers P1 and P2 52
2.3.17. Size selection of RNA fragments by FlashPAGE fractionators 53
2.3.18. TA cloning 54
2.4. Bioinformatics and computational biology
2.4.1. Motif finding with YMF and MEME 54
2.4.2. Building a Bowtie reference index 55
2.4.3. Mapping of SOLiD RNA-seq reads with Tophat 56
2.4.4. Indexing and sorting of BAM files with SAMtools 58
2.4.5. SamTools pileup from BAM read alignment data 58
6
2.4.7. Quantification of uniquely mapped reads from Tophat alignment data 60
2.4.8. Cufflinks assembly of transcripts 60
2.4.9. Counting unique genetic loci and numbers of alternative isoforms
predicted by Cufflinks assembly 61
2.4.10. Converting BAM to SAM format 62
2.4.11. Splitting BAM files by strand 62
2.4.12. Cuffcompare of transcripts to reference 63
2.4.13. Alignment of ORFs to the Pfam protein database 63
2.4.14. Alignment of ORFs to the Kyoto Encyclopaedia of Genes and Genomes 64
2.5. Novel Software
2.5.1. Use of Perl 64
2.5.2. Pileup software for Corona lite aligned RNA-seq reads 64
2.5.3. Gene expression using SOLiD version 2 libraries 65
2.5.4. Antisense estimation 65
2.5.5. Masking positions with low readhead coverage 66
2.5.6. Association of TSS and motifs to gene models 67
2.5.7. Generating statistics for production of consensus sequences surrounding
transcription start sites 68
2.5.8. Selection of uniquely mapping reads with complete 5' end alignments 69
2.5.9. Generating readhead pileups from selected read data 69
2.5.10. Comparison of read head mapping positions 70
2.5.11. Analysis of intron lengths 71
7
2.5.13. Remove RH pileup positions covered by annotated gene models 74
2.1.14. Software to obtain transcript positions 75
2.1.15. Software to obtain transcript sequences 76
2.5.16. Counting of ORFs and their associated transcripts 76
2.5.17. Remove duplicates and newline characters from multi-FASTA
sequence lists 77
2.5.18. Comparison of Pfam and KEGG protein database alignments 78
2.5.19. Identification and classification of antisense transcripts 79
3. High-throughput whole transcriptome RNA-seq in Aspergillus nidulans on the ABI SOLiD version 2 platform
3.1. Sequencing of SOLiD Total-RNA-seq libraries 81
3.2. Creation of two SOLiD libraries with SREK 81
3.3. Investigation of mapping quality in SOLiD libraries 84
3.4. Analysis of RNA-seq data 87
3.5. Addressing fragmentation bias 93
3.6. Discussion 103
4. 5′ specific RNA-seq
4.1. Identification of transcription start sites and functional promoter elements 109
4.2. Development of 5′ specific RNA-seq 111
4.3. Modifying the 5′ specific RNA-seq protocol to reduce sample loss 113
4.4. 5′ specific RNA-seq library 117
8
4.6. Conversion of mapped read data to readheads 122
4.7. Identification of TSS regions 125
4.8. Global analysis of RH frequency 126
4.9. Global analysis of TSS distribution within segments 129
4.10. Characterising TSS regions 131
4.11. Global analysis of TSS distribution 136
4.12. Motif finding and analysis 138
4.13. Association of TSS regions and motifs with annotated gene models 150
4.14. Consensus sequences around gene associated start sites 152
4.15. Further development of 5′ specific RNA-seq protocols 154
4.15.1. Investigation of mRNA decay 154
4.15.2. Increased library quality using a shorter Random priming P2
oligonucleotide 160
4.16. Discussion 164
5. New whole transcriptome libraries
5.1. Introduction 170
5.2. Library preparation and sequencing 171
5.3. SOLiD read mapping 172
5.4. Assessment of Tophat junction mapping 176
5.5. Modified Tophat mapping 181
5.6. Genome utilisation indicated by Tophat mapping of RNA-seq reads 183
9
6. Identification of putative novel and antisense genes in Aspergillus nidulans
6.1. Previous observations 190
6.2 Initial estimation of novel genes using SOLiD V2 RNA-seq libraries 191
6.3. Transcript assembly with Cufflinks 195
6.4. Novel gene finding using Cufflinks assembled transcripts from SOLiD V4
RNA-seq libraries 199
6.5. Functional analysis of putative novel transcripts 200
6.6. Identification of novel transcripts with non-AUG start codons 203
6.7. Investigation of antisense transcripts using Cufflinks assembly 204
6.8. Discussion 209
7. Investigation of alternative splicing in Aspergillus nidulans
7.1. Alternative splicing 214
7.2. Analysis of alternative splicing events identified by whole transcriptome
RNA-seq in A. nidulans 218
7.3. Discussion 229
8. Further work
8.1. Availability of data as a community resource 233
8.2. Improving the analysis of novel protein coding genes 234
8.2. Improving the analysis of non-coding and antisense transcripts 234
8.4. Aspergillus nidulans RNA-seq in the future 235
References 236
10 List of Figures
1. Introduction and aims
1.1. SOLiD sequencing and the colour space format.
1.2. Creation of SOLiD fragment libraries.
1.3. Emulsion PCR and bead enrichment for SOLiD sequencing.
2. Materials and Methods
2.1. Process for extraction of intron lengths and largest intron data.
3. High-throughput whole transcriptome RNA-seq in Aspergillus nidulans on the ABI SOLiD version 2 platform
3.1. Observation of potentially novel genes.
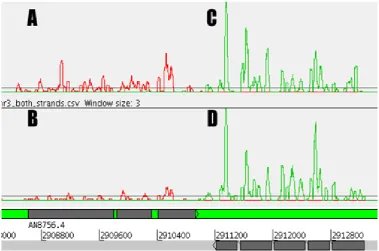
3.2. Artemis display of reads from two strains of A. nidulans grown in different conditions.
3.3. Demonstration of sense-antisense overlap.
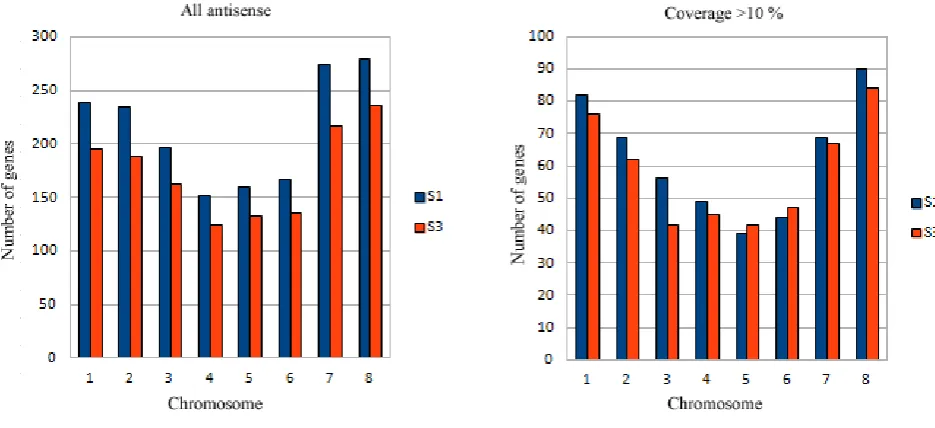
3.4. Histogramsof estimated antisense transcript occurrence by chromosome.
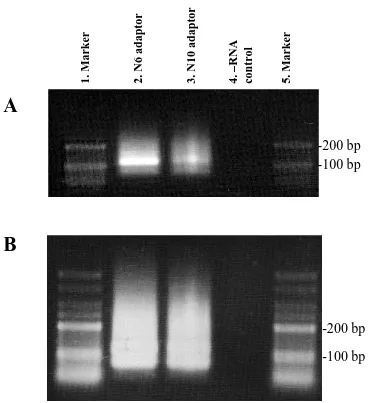
3.5. Trial libraries made with chemical fragmentation before (A) and after (B) PCR amplification.
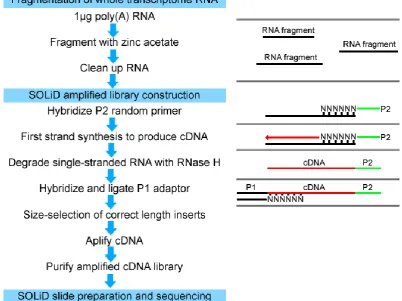
3.6. SOLiDlibrary preparation protocol with zinc acetate fragmentation.
3.7. Size selection of amplified libraries on 2% agarose gel.
3.8. Amplified libraries created with chemical fragmentation and size selected by FlashPAGE.
4.5′ Specific RNA-seq
11 4.2. PCR cleanups with Minelute and Purelink kits.
4.3. Effect of PCR over-amplification on SOLiD libraries.
4.4. Protocol for 5′ specific RNA-seq on the SOLID platform.
4.5. Agilent 2100 bioanalyzer plot of 5′ specific RNA-seq library.
4.6. Correction of mis-annotation.
4.7. Conversion of mapped read alignments to RH frequencies.
4.8. Box-plots of RH peak distribution for 4 chromosomes of A. nidulans.
4.9. Readhead position distribution in TSS regions on chromosomes 1-4.
4.10. Examples of readhead mapping variance in transcription start sites.
4.11. Chromosome map of identified TSS regions. 4.12. Motifs identified from DS1.
4.13. Classes of motif arranged from strongest to weakest.
4.14. Histograms of enrichment relative to TSS location for 13 identified motifs.
4.15. Distribution of motif classes by kernel density estimates.
4.16. Motif classes ordered by level of distributional enrichment.
4.17. Combined strong motifs from both datasets.
4.18. 16 strongest candidates for functional motifs.
4.19. Sequential alignment of motifs to promoter sequences.
4.20. Sequence logo for the region surrounding transcription start sites in A. nidulans.
4.21. Comparison of 5′ specific RNA-seq readhead data from libraries produced with and without alkaline phosphatase (ALP) treatment.
12
4.23. Agilent bioanalyser plots for samples prepared with the barcoded and non barcoded Random Priming P2 oligonucleotide.
5. New whole transcriptome libraries
5.1. Tophat based mapping of extremely long splice junctions displayed in IGV.
5.2. Box and whisker plot of intron lengths in A. nidulans.
5.3. Histogram of intron lengths in A. nidulans.
5.4. RNA-seq and junction data for gene AN4390.4 (CADANIAG00006067).
6. Identification of putative novel and antisense genes in Aspergillus nidulans 6.1. Cufflinks assembly of transcripts using aligned reads from both strands.
6.2. Strand specific transcript assembly with Cufflinks.
6.3. Novel antisense regions selected for experimental investigation.
6.4. Confirmation of an antisense transcript in meaB.
7. Investigation of alternative splicing in Aspergillus nidulans 7.1. Types of alternative splicing.
7.2. First example of alternative splicing by intron retention.
7.3. Second example of alternative splicing by intron retention.
7.4. Third example of alternative splicing by intron retention.
7.5. Example of alternative splicing utilising competing 5' splice sites.
13
7.7. Example of alternative 5' start site utilisation resulting in alternative transcripts from a single locus.
7.8. PCR oligo design and products for investigating 5 sets of differentially spliced transcripts.
List of Tables
2. Materials and Methods
2.1. List of custom oligonucleotides names and sequences. 2.2. Large scale cultures.
2.3. Reaction components for reverse transcription.
2.4. Incubation temperatures and times for reverse transcription.
2.5. Reaction components for second strand synthesis.
2.6. Reaction components for PCR amplification of chemically fragmented libraries.
2.7. PCR cycle for amplification of chemically fragmented libraries.
3. High-throughput whole transcriptome RNA-seq in Aspergillus nidulans on the ABI SOLiD version 2 platform
3.1. Summary of whole transcriptome pipeline mapping results.
4.5′ specific RNA-seq
4.1. TSS location confidence intervals and Length(bp) values.
4.2. Significance of motif occurrences in different datasets.
4.3. Motif:gene matches.
5. New whole transcriptome libraries
14 5.2. Read quality assessment mapping.
5.3. Mapping and splice junction identification by Tophat with a maximum intron length of 5000 bp.
5.4.Mapping and splice junction identification by Tophat with alternative settings.
5.5. Nucleotide specific alignments to the A. nidulans genome and proportion of the genome transcribed
15 List of abbreviations
3'. Three Prime
5'. Five Prime
ABI. Applied Biosystems
ALP. Alkaline Phosphatase
AspGD. Aspergillus Genome Database
ATP. Adenosine triphosphate
bp. Base Pair
CADRE. Central Aspergillus Resource
cDNA. Complimentary DNA
CGR. Liverpool Centre for Genomic Research
CM. Complete Media
DNA. Deoxyribonucleic Acid
dNTPs. Deoxynucleotide Triphosphates
DPE. Downstream Promoter Element
DTT. Dithiothreitol
EDTA. Ethylene Diamine Tetra Acetic Acid
ePCR. Emulsion Polymerase Chain Reaction
g. gravity
GO. Gene Ontology
IGV. Integrative Genomics Viewer
Inr. Initiator Element
Kb. Kilobase
mg. Milligram
ml. Millilitre
µg. Microgram
16 MM. Minimal Media
mRNA. Messenger Ribonucleic Acid
ncRNA. Non-Coding Ribonucleic Acid
NAT. Natural Antisense Transcript
NGS. Next Generation Sequencing
nt. Nucleotide
ORF. Open Reading Frame
PCR. Polymerase Chain Reaction
PNK. Polynucleotide Kinase
PTGS. Post-transcriptional Gene Silencing
RH. Readhead
RNA. Ribonucleic Acid
RNAi. Ribonucleic Acid Interference
RNA-seq. Ribonucleic Acid Sequencing
RO. Reverse Osmosis
rpm. Revolution per Minute
rRNA. Ribosomal Ribonucleic Acid
siRNA. Short interfering Ribonucleic Acid
snRNP. Small Nuclear Robonucleoprotein
SOLiD. Sequencing by Oligonucleotide Ligation and Detection
SREK. Small RNA Expression Kit
sRNA. Small Ribonucleic Acid
TAP. Tobacco Acid Pyrophosphatase
TF. Transcription Factor
Tris. Tris (Hydroxymethyl) Aminomethane
TSS. Transcription Start Site
17 UV. Ultraviolet Light
WT. Wild Type
19 1. Introduction and aims
1.1. Importance of the Aspergilli
The Aspergilli are a group of approximately 200 species of fungi, with roles in disease and
food spoilage (including 20 known to be human pathogens), as well as a number of beneficial
species used in the biotechnology industry and for the production of foodstuffs (Timberlake
& Marshall, 1989). As a result, the Aspergilliare one of the most important and widely
studied groups in the field of fungal research, and the genomes of many species have been
sequenced (Ward et al., 2006).
Aspergillus nidulans, is a filamentous fungus which has played a central role in eukaryotic cell research for over 60 years (Martinelli & Kinghorn, 1994). During this time, A. nidulans
has been developed as an experimental genetics system, and played a particularly important
role in the study of mitosis, being utilised for the first studies targeted specifically at nuclear
division (Morris, 1976a; Morris 1976b). Morris demonstrated the utility of the sexual and
parasexual cycles of A. nidulans, and it's homothallic nature meant that mutants could be directly tested for complementation without the problems of genetic mating types. This was
aided by the fact that haploid, diploid and heterokaryotic vegative states had all been defined,
along with eight well-marked linkage groups representing the eight chromosomes
(Pontecorvo et al., 1953; Kafer, 1977). These studies helped to establish A. nidulans as a model genetic system for future studies, including the investigation of gene organisation and
regulation (Timberlake, 1980). It is important to note the existence of multiple wild-type
stains of A. nidulans (Jinks et al., 1966), however all commonly used mutant strains are derived from a single strain selected as a genetic model in 1953, often referred to as the
20
As a model organism, developing our understanding of the A. nidulans genome can provide valuable insight into other Aspergillus species. This work therefore has the potential to aid research not only in A. nidulans, but other Aspergilli of social and economic importance, such as A. oryzae, used in the production of soy sauce, sake and miso, and A. fumigatus, a human pathogen which presents an ever increasing risk to immunocompromised patients due
to mutations resulting in antifungal drug resistance (Chamilos & Kontoyiannis, 2006).
1.2. The Aspergillus nidulans genome
The first eukaryotic organism to have its genome sequenced was Saccharomyces cerevisiae
in 1996(Goffeau et al., 1996). It was not until 2005 that the A. nidulans genome was sequenced and published by the Broad Institute. This genome was found to contain
approximately 30 million base pairs in eight chromosomes or linkage groups (Galagan et al., 2005). The genome sequence was annotated with the Calhoun annotation system, utilising
protein homology searches and numerous gene prediction algorithms, including FGENESH
(Salamov & Solovyev, 2000), FGENESH+, and GENEWISE (Birney et al., 2004). A. nidulans EST data was not incorporated into gene predictions, but was used separately for validation, and 9,541 protein-coding genes were predicted (Galagan et al., 2005).
The genomes of two other Aspergillus species (A. fumigatus and A. oryzae) were also sequenced in 2005, and described in two companion papers (Nierman et al., 2005; Machida
et al., 2005). All three assembled genomic sequences were produced by different sequencing centres, each using a separate and diverse annotation process. This produced inconsistencies
in gene model and functional annotation, while additional attributes such as Enzyme
21
A. niger (CBS 513.88) were manually reviewed by their respective research communities, prompting a reannotation of the A. nidulans genome by the Eurofungbase community, published in 2008 (Wortman et al., 2008).The primary goal of this reannotation was to increase the number of A. nidulans proteins with accurate functional assignments. The percentage of A. nidulans gene products with informative names was increased from 3 % to approximately 19 %, which was subsequently increased to 58 % by the transfer of
information from orthologous genes annotated in A. fumigatus or A. niger. Manual curation of gene model annotations also led to an increase in the number of predicted genes, from
9,541 to over 10,500 (Wortman et al, 2008). While this represented an iterative improvement over previous annotations, it was by no means a finished product, and further demonstrated
the high level of inaccuracy associated with in silico gene prediction, which was still the primary method of annotation for the majority of A. nidulans genes.
The sequencing of the A. nidulans genome allowed for major advances in our understanding of the Aspergilli through comparative genetic studies between species. Comparative study of
the A. nidulans genome with A. fumigatus and A. oryzae led to a major discovery, in that until that point A. nidulans was the only one of the three with a known sexual cycle, while the other two were only known to reproduce through asexual mitotic spores. In conjunction with
other work (Nierman et al., 2005; Paoletti et al., 2005), 215 genes inplicated in the mating process, meiosis, fruiting body development and pheromone response in fungi were
investigated and all (with the exception of mating-type genes) genes identified in A. nidulans
were also found in both A. fumigatus and A. oryzae. While it is possible that these genes are present due to sexual reproduction being lost only recently in these species, these data
suggested that A. fumigatus and A. oryzae may be capable of sexual reproduction, which may result in a massive increase in the potential for developing genetic tools for these fungi in
22
and small scale evolutionary processes in eukaryotes are species specific and can occur at
different relative rates. These findings contrasted those in vertebrate, nematode and arthropod
systems, where structural and nucleotide evolution are shown to be correlated (Galagan et al., 2005; Coghlan & Wolfe., 2002; Burt et al., 1999; Sharakhov et al., 2002).
Since this update to the A. nidulans genome, annotations have been constantly evolving as work continues to more accurately identify gene models and functions. Work is currently
being undertaken by the group responsible for the Aspergillus Genome Database (AspGD)
(Arnaud et al., 2010), with the aim of reannotating the A. nidulans genome using high-throughput sequencing data.
1.3. Transcription of mRNA in eukaryotes
Transcription is the first step of gene expression,in which the enzyme RNA polymerase is
used to create a new molecule of RNA with a sequence complimentary to that of a region of
DNA. The regulation of transcription is vital for the control of gene expression, and can
occur at numerous points throughout the process. Firstly, for genes to be actively transcribed,
the locus needs to be accessable to the machinery of transcription, which includes various
enzymes and transcription factors. In eukaryotes, transcription is constitutively repressed by
nucleosomes, in which a length of approximately 146 bp of DNA is wrapped around a
complex of histones H3, H4, H2A and H2B (Struhl, 1999). Activation of transcription
requires decondensation of the chromatin structure around the relevent locus (Chambeyron &
23
promoter region of the gene to be transcribed (Boeger et al., 2003, Reinke & Horz, 2003). There is also evidence for a relationship between regulation of transcription and the position
of genes within chromosome territories, with highly expressed genes located more commonly
at the periphery (Kurz et al., 1996; Dietzel et al., 1999) or within loops which extend outside of these territories (Volpi et al., 2000; Williams et al., 2002).
In eukaryotes, a complicated system of transcription factors is required for binding of RNA
polymerase II to the promoter. These transcription factors were originally in identified in
Drosophila and S. cervisiae (Matsui et al., 1980), are collectively known as general
transcription factors and have been are named TFIIA, TFIIB, TFIID, TFIIE, TFIIF and TFIIH,
where TF stands for transcription factor. These factors are recruited sequentially onto the
DNA promoter to form a nucleoprotein complex capable of recruiting RNA polymerase II.
This process is regulated by the action of activator and repressor proteins, which respectively
aid or inhibit recruitment of the general transcription factors (Orphanides et al., 1996). This regulation has been shown to occur at cis-regulatory elements shortly upstream of the core
promoter, which are often binding sites for other regulatory elements produced in trans
elsewhere in the genome (Gilad et al., 2008).
Transcription itself is initiated by the binding of RNA polymerase to a promoter sequence
within DNA. The core promoter consists of a short region immediately upstream and/or
downstream of the transcription start site (TSS), and contains binding sites which interact
directly with components of transcriptional machinery. The vast majority of core promoters
studies have been performed on promoters containing a TATA box as an essential element.
This conserved motif binds TFIID (lee & Young, 2000), however promoters have been
24
motif. This indicates that other factors along with TFIID are responsible for directing and
binding the machinery of transcription to the core promoter (reviewed by; Smale &
Kadonaga, 2003), and this diversity makes an important contribution to the regulation of gene
expression (Butler & Kadonaga, 2002; Smale, 2001). Other core promoter elements capable
of binding TFIID include the motif 10 element, the TFIIB recognition elements, the X core
promoter element 1 and the initiator element (Inr), which can act alongside of independantly
of a TATA motif. In TATA-less promoters, an alternative core promoter motif known as the
downstream promoter element (DPE) is often (but not always) found downstream of the Inr,
at a precise distance of +28-32 bp. TFIID has been shown to bind cooperatively to these
motifs, with the efficiency of binding and therefore transcriptional activity being highly
dependant on the distance between the Inr and DPE (Juven-Gershon & Kadonaga, 2010;
Kutach & Kadonaga, 2000). This is supported by the work of Jin et al., 1995 and Tan &
Richmond (1998), who showed that the insertion of a single base pair between transcription
factor binding motifs can cause a rotational shift of up to 35°. Some transcription factors are
able to tolerate a degree of flexibility in the distance between binding sites, showing only a
lowering of binding affinity, while for others this rotational shift leads to steric
incompatability and abolishing cooperative binding. This demonstrates the importance of
conserved functional motifs and their position relative to the TSS and each other in the
initiation and regulation of transcription.
Following the successful recruitment of RNA polymerase II to the promoter and initiation of
transcription, the RNA polymerase travels along the template strand of the DNA from 3'-5',
using complimentary base pairing to create an mRNA copy of the coding strand. This process
is known as elongation, and ends in termination of transcription and the release of the fully
25
processing occurs during elongation, such as the addition of the 5' cap structure, which
consists of a 7-methylguanosine moiety attached to the 5' end of the mRNA during early
elongation (Takagi et al., 2002). This structure has several functions, including regulation of export from the nucleus, promotion of translation and protection of the mRNA molecule from
degradation by 5'-3' exonucleases (Konarska et al., 1984; Caponigro & Parker, 1996).
Another modification vital for the stability of mRNA is the addition of a poly(A) tail at the 3'
end upon termination of transcription (Guhaniyogi & Brewer, 2001). Newly synthesised
mRNAs are cleaved at the 3' end and the poly(A) tail added based on the presence of a
polyadenylation signal motif recognised by a complex of cleavage and polyadenlyation
factors (Hunt et al., 2008). Genes have also been identified with multiple polyadenylation sites, suggesting that a single gene may code for several transcripts with alternative 3' ends,
contributing to diversity of the transcriptome (Proudfoot et al., 2002; Shen et al. 2008). Removal of the poly(A) tail and 5' cap are a vital processes in the control of mRNA
expression through transcript degradation, and are discussed further in Chapter 4.16 of this
thesis.
Splicing is another mechanism which can occur during elongation of the mRNA, and which
also occurs after termination on transcription. This process assembles eukaryotic mRNAs
from the longer, newly synthesised precursor mRNA. Alternative splicing patterns give rise
to different protein isoforms with unique chemical and biological properties based on the
inclusion or exclusion of coding sequences in the mature mRNA (Grabowski & Black, 2001).
This facilitates a huge amount of diversity in the proteome, as a single transcript may have
multiple splice patterns, with some known examples being alternatively spliced into
thousands of different mature mRNAs (Black, 2000; Graveley, 2001). The mechanism of
26 1.4. Nitrogen metabolism in Aspergillus nidulans
Nitrogen is a vital resource for all organisms, used in the production of proteins, nucleic acids,
lipids and in the fungal cell wall. Aspergillus nidulans has been extensively utilised in the study of nitrogen metabolism and regulation, alongside another fungal species, Neurospora crassa (Caddick et al., 1994). The processing of various nitrogen sources has been linked to genes involed in the nitrogen utilisation pathway of these two organisms, and this work has
contributed greatly to the understanding of nitrogen metabolism regulation through gene
expression (Wiame et al., 1985).
A. nidulans is able to utilise a wide range of nitrogen sources, although not all nitrogen-containing compounds are used equally. Generally, nitrogen sources can be classified into
two subgroups, distinguished on the basis of preference for their utilisation: Primary nitrogen
sources (ammonia and glutamine) and secondary nitrogen sources, which includes all other
compounds which can be utilised. When they are available, the uptake and metabolism of
primary nitrogen sources is preferred to secondary sources, the processing of which generally
requires additional cellular mechanisms. These mechanisms are tightly regulated by a number
of genes associated with each metabolic pathway (Caddick et al., 1994), and primarily
controlled by expression of the GATA transcription factor AreA (Platt et al., 1996). AreA is a positive regulator of secondary nitrogen metabolism, and the expression of areA mRNA is repressed in the presence of an abundant primary nitrogen source, effectively blocking the
utilisation of secondary nitrogren sources in a process known as nitrogen metabolite
repression (Arst & Cove, 1973; Wiame et al., 1995). In contrast, growth on secondary nitrogen sources has been shown to result in higher levels of the transcript and the effective
27
act in opposition to AreA, being optimally expressed in response to nitrogen sufficiency and
rapidly localized to the nuclei in the presence of primary nitrogen sources, with this being
reversed on transfer to nitrogen limiting conditions. While MeaB has been proven capable of
independantly mediating nitrogen metabolite repression, the expression of many genes
regulated by MeaB are dependant on AreA, and that areA is able to partially regulate meaB
(Wagner et al., 2010), however the method of this regulation was not clear.
1.5. The development of high-throughput sequencing
The recent development of “next generation” high-throughput sequencing using next
generation technologies such as the ABI SOLiD and Illumina Genome Analyzer II has
completely transformed quantitative transcriptomics. These next generation sequencing
(NGS) technologies have significantly reduced the cost-per-reaction and time required, while
simultaneously increasing the amount of data produced by each experiment. This has led to a
number of experimental techniques being developed to directly survey the RNA content of
cells without the traditional cloning requirements of EST sequencing. Such approaches have
been shown to generate quantitative expression scores that are comparable to microarrays,
but allow the entire transcriptome to be surveyed with no prior knowledge of transcribed
regions (Wilhelm & Landry, 2009). This provides an unprecedented potential for global
transcriptome analysis and the discovery of previously unidentified transcripts.
As high-throughput sequencing became more prevalent, the data produced has provided
information on non-coding transcripts, untranslated regions and gene structures, facilitating
iterative improvements to existing genome annotations. Investigation of sequence reads
28
across introns and genes, as well as changes in splicing observed in alternative growth
conditions (Wilhelm et al., 2008).
Cloonan et al., (2008), showed that high-throughput sequencing can be used to survey the complexity, dynamics and sequence content of transcriptomes in a near-complete fashion.
Using a combination of tag maps with existing genome and transcriptome annotations, they
developed a protocol to study the genomic landscape of gene expression and both known and
novel alternative splicing events. This clearly defined the location of exons, as well as
addressing transcriptional activity, transcriptional complexity from active loci, transcriptional
activity outside currently defined annotations, and allowing for the discovery of previously
unidentified nonsynonymous single-nucleotide polymorphism (SNP) expression (Cloonan et al., 2008). This work also showed the use of tag counts to define differential expression between various states, finding good concordance with previously published expression
profiles (Bruce et al., 2007) and work by Wilhelm et al., (2008) who have also shown a strong correlation between RNA expression levels determined from sequence-read numbers
and those determined from hybridization signals. This indicates that data obtained from high
throughput sequencing provides quantitative analysis of transcript levels and may do so more
accurately than previous techniques. Expression levels measured by Lyne et al., (2003) using cDNA microarrays produced measurable signals from only 80-90% of genes in proliferating
cells, with the remaining 10-20% shown to be highly expressed only under specific
conditions such as meiosis or response to stress (Chen et al., 2003; Mata & Bähler, 2003). In comparison, expression levels in proliferating cells measured by analysis of sequencing data
showed an average coverage of 94.9 %, and Lyne et al., (2003) suggest that the sequencing approach is sensitive enough to detect genes with low expression levels and even basal
“transcriptional noise” from genes which are not actively expressed.
29
sequencing using high-throughput NGS technology offers a near-complete snapshop of the
transcriptome, including rare and hard to detect transcripts with regulatory roles.
High-throughput sequencing has therefore become the primary method for the discovery and
characterization of non-coding RNAs (ncRNA). ncRNA describes a broad class of functional
RNAs which are not translated into proteins. Combined with the fact that ncRNAs are often
poorly conserved over evolutionary time, this made identification and sequencing of ncRNAs
extremely difficult using previous technologies. Therefore, the prediction of both mature and
precursor ncRNAs using in silico methods is of limited use, and the majority of ncRNA discovery relies on the sequencing of small RNA fragments (Mardis, 2008). Next generation
high-throughput sequencing is therefore ideally suited to the global discovery of ncRNAs,
and has been utilized for this purpose in a number of species ranging from Chlamydomonas
(Zhao et al., 2007) to human and chimpanzee brain (Berezikov et al., 2006).
1.6. The challenges of high-throughput RNA-seq
While high-throughput RNA-seq has been shown to have many advantages over traditional,
low-throughput EST sequencing, there are a number of complications associated with these
experiments. Sequence reads produced by RNA-seq using next generation sequencing (NGS)
technologies are predominantly very short. For example, reads produced by SOLiD
sequencing at the start of this thesis were only 35 bp in length, and while this has been
improved over time, current iterations of the SOLiD system are still limited to the production
of 75 bp fragment libraries.
To achieve the short read length which can be sequenced using NGS technology, transcripts
must be fragmented prior to sequencing, then reassembled from the resulting fragments (with
30
This leads to loss of information as there is no definitive way of determining the structure of
the full length transcripts, which must be predicted by assembly of reads mapped to a target
genome. Transcriptome assembly is extremely challenging to perform accurately as
algorithms must take into account factors such as strand specificity, read and mapping quality,
and the fact that transcript variants from a single gene can share much of the same exon
sequence, making them difficult to resolve. Using the SOLiD NGS sequencer we have
observed an additional complication in that the distribution of read mapping can be highly
uneven across a transcribed sequence, and sufficient depth of sequencing must therefore be
obtained to ensure complete coverage of transcribed regions and robust transcript assembly.
This issue has also been reported in other NGS technologies (Hansen et al., 2010), so does not seem to be limited to the SOLiD, indicating the need for further development and
improvement of NGS technology across all platforms.
The choice of whether to guide transcript assembly is also important, as this is largely
dependent on the quality of the reference genome. In the case of A. nidulans supplying a reference was shown to greatly reduce the number of novel transcripts identified compared de novo transcript assembly. Previous studies such as the sequencing of the Anopheles funestus
transcriptome by Crawford et al. (2010) have combined these two methods where the quality of reference genome was called into question, and findings from this thesis propose that a
similar approach may be beneficial in A. nidulans (Chapter 5.7). Even when an assembly strategy has been developed, the choice of algorithm poses yet more challenges, as most
transcript assembly software is developed using distinct organisms on a single NGS platform,
so different algorithms can produce a variety of transcript assemblies from the same data. In
some cases the choice of assembler may also be limited, as specific data formats (such as SOLiD colour space) are not accepted by all assemblers, and even where they can be used,
31
that there is currently no standard criteria for quality assessment of transcriptome assemblies,
although the need for such criteria has been acknowledged and they are currently being
developed (Salzberg et al., 2005; Meader et al., 2010).
The result of high-throughput coupled with short read length is extremely large datasets,
ranging from several gigabases to terabases of data produced from a single transcriptome.
Manual data-handling is therefore impossible, and researchers must develop new skills in
bioinformatics and the production of novel software to facilitate automated manipulation and
interrogation of these massive datasets. Hardware limitations are also a consideration, as
analysis of these data requires high-power computing systems with large memories and
sufficient processing capability to run parallel algorithms.
During the course of this thesis, advances have been made in NGS technology and data
analysis. Throughput, read length, mapping and assembly algorithms have all been improved,
resulting in greater read coverage and higher quality transcript assembly. However, this
technology is still reliant on cDNA synthesis or hybridization steps, the efficiency of which is
dependent on RNA sequence and structure. This can result in spurious second-strand cDNAs
through template switching (Cocquet et al., 2006) and primer-independent cDNA synthesis due to self-priming thought to occur through cDNA secondary structure (Ozsolak & Milos,
2011). Furthermore, reverse transcriptases have been shown to have lower fidelity than other
polymerases due to their lack of proofreading mechanisms, and can add nontemplated
nucleotides to cDNAs (Chen & Patton, 2001). These factors together pose limitations on the
quality and accuracy of strand-specific RNA-seq using standard NGS techniques.
Current work in the field of NGS aims to address many of the issues through development of
32 1.7. The ABI SOLiD system
Early comparisons of high-throughput NGS technologies such as those conducted by
Harismendy et al. (2009) suggested that platforms such as the ABI SOLiD and Illumina sequencers were extremely similar in terms of accuracy and throughput. This work suggested
that the major factors influencing choice of sequencing platform were therefore time, cost and
availability. However, each system was shown to have minor advantages in certain
applications. The ABI SOLiD system was shown to produce lower coverage variability and
therefore higher accuracy at low coverage. This was of particular importance for the
identification and characterization of transcripts with very low expression, and of rare
intergenic transcripts such as ncRNAs (Harismendy et al., 2009). Combined with the in-house availability of SOLiD sequencing, this made it the system of choice for this analysis.
The applied Biosystems (ABI) SOLiD (Sequencing by Oligo Ligation and Detection) system
was commercially released in 2007. This system offers a unique sequencing methodology
based on sequential ligation of fluorescently labeled semi-degenerate oligonucleotide probes.
Each probe queries two adjacent base positions at a time, with four fluorescent dyes used to
encode for the sixteen possible di-base combinations. After the ligation step, a fluorescent
readout records the colour of the dye. The fluorescent group is then removed from the ligated
oligonucleotide probe by chemical cleavage, allowing a subsequent round of ligation. The use
of di-base probes is referred to as “2 base encoding” and contributes to the high accuracy of
the SOLiD system. Cycling of ligation, detection and cleavage determines the eventual read
length. Following a series of ligation cycles, the extension product is removed and the
template reset with a primer complimentary to the n-1 position for a 2nd round of ligation
cycles. A total of 5 cycles are performed for each sequence tag and the final sequence
33
This method of sequencing provides numerous advantages compared to other systems:
1. Interrogation of two bases in each ligation provides increased specificity.
2. Each base in interrogated twice providing increased confidence in each call.
3. The primer is reset for five independent rounds of extension, improving signal to
noise ratios.
4. The design of the four dyes encoding sixteen possible two base combinations enables
built in error checking.
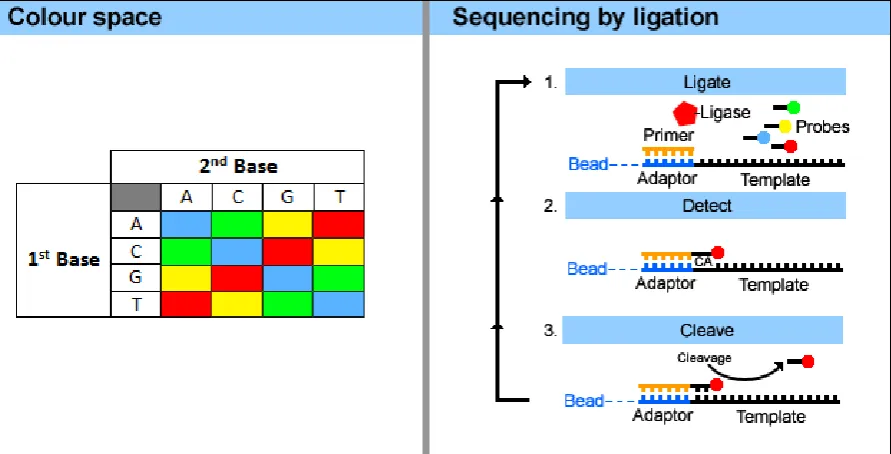
The sequencing process and colour space format are detailed in Fig 1.1. An overview of the
SOLiD workflow is presented at:
http://marketing.appliedbiosystems.com/images/Product/Solid_Knowledge/
34
Figure 1.1. The colour space format and SOLiD sequencing by ligation. The SOLiD system uses a set of semi-degenerate and fluorescently labelled di-base probes to create
sequences in colour space. A key for converting di-base sequences to colour space is
illustrated in the left pannel. The SOLiD sequencing process is shown in the right panel, and
begins with hybridization of primers to the P1 adapter sequence within the library template.
The four probes then compete for ligation to the sequencing primer. The fluorescent label
attached to the ligated probe is detected by the SOLiD, the probe is then removed by cleavage
and the process repeated for the next base in the template. Specificity of the di-base probe is
35
RNA samples can be prepared for sequencing on the ABI SOLiD platform in a number of
different ways, depending on the application and desired outcome. SOLiD sequencing of the
whole transcriptome utilizes fragment libraries created from mRNAs, which must be isolated
from total RNA by poly(A) selection or ribosomal RNA depletion. Prior to fragmention with
RNase III, the mRNA library is treated with tobacco acid pyrophosphatase (TAP) to cleave
the cap structure present at the 5' end of the mRNA molecules, leaving a 5'-monophosphate
and a 3'-hydroxl. These structures are characteristic of RNase III cleavage products and are
required to make the mRNA competent for adaptor ligation by RNA ligase which selectively
ligates synthetic oligoribonucleotides to the phosphate at the 5' end. The adaptors used are
sets of RNA/DNA oligonucleotides with a single-stranded degenerate sequence at one end
and a defined sequence required for SOLiD sequencing at the other. Preparation of libraries
36
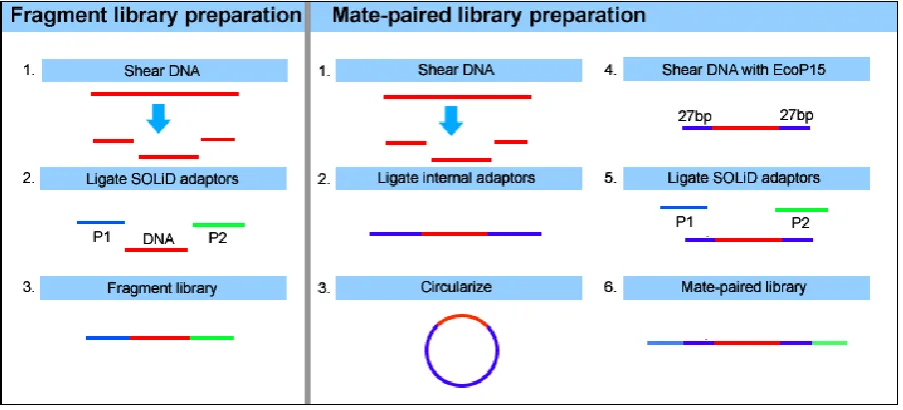
Figure 1.2. Creation of SOLiD fragment libraries. The SOLiD system can use two types of libraries, fragmented (left panel) or mate-paired (right panel). The fragment libraries
utilized in this thesis are prepared by fragmenting mRNAs with RNase III, followed by
37
Following the ligation of the adaptor to the fragmented RNA, reverse transcription is
performed to synthesise a cDNA library of fragments containing the P1 and P2 adaptors
required for sequencing. The RNA/cDNA duplex is then denatured and the library is selected
by size for fragments with sequence inserts of sufficient length to generate full-length SOLiD
RNA-seq reads. The products of size-selection are then amplified by PCR to increase
quantity of fragments, using the lowest possible number of cycles to maintain an accurate
expression profile. PCR products are then purified and subjected to quality control (QC)
checks, ensuring that the library is of sufficient quality and concentration. Libraries which
pass QC are prepared for SOLiD sequencing by emulsion PCR (ePCR) of the template with
P1 coupled beads. In this process, the template is annealed to the P1-coupled beads, and a
polymerase extends from the P1 adapter to generate a complimentary sequence extending
from the beads surface. Following ePCR, templates are denatured and bead enrichment
performed using a glycerol gradient to separate beads with extended templates from the
undesirable non-templated beads. Templated beads are 3' modified to facilitate covalent
linkage to the SOLiD slide, where they are deposited in a random array (Fig. 1.3). Deposition
chambers offer the ability to segment the slide into multiple chambers during the loading
process, allowing increased densities of beads per slide and resulting in a higher level of
38
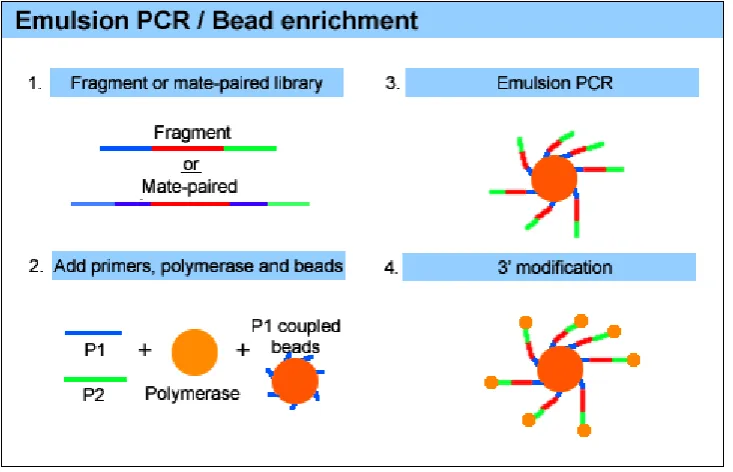
[image:38.595.114.481.229.465.2].
Figure 1.3. Emulsion PCR and bead enrichment for SOLiD sequencing. Emulsion PCR is used to capture the templates on P1-coupled beads. The templates are then denatured and
bead enrichment is performed to separate beads with extended templates from undesirable
39 1.8. Aims
The aim of this thesis was to develop modern, high-throughput strategies to investigate the A. nidulans transcriptome. These strategies aimed to identify key sequence elements within the genome which may be used to predict and/or regulate gene expression. This included in silico
prediction of promoters as well as the identification of specific DNA or RNA motifs
associated with regulatory proteins.
Through interrogation of high-throughput sequencing data, this thesis also aimed to assess the
use of high-throughput sequencing for the identification and characterization of novel genes,
intergenic non-coding RNAs, antisense genes, and to provide new insights into the
integration of different biological processes. While the aim was not to reannotate the A. nidulans genome, a priority was placed on collaboration with CADRE and AspGD to make the resultant high-throughput sequencing data publicly available as a community resource to
41 2. Materials and Methods
[image:41.595.70.531.145.759.2]2.1. Synthetic oligonucleotides
Table 2.1. List of custom oligonucleotide names and sequences.
Name Sequence (5′ - 3′)
P1 (comp) Phosphate- ATCACCGACTGCCCATAGAGAGGAAAGCGGAG GCGTAGTGGTT -biotin TEG
P1 random (6) CCACTACGCCTCCGCTTTCCTCTCTATGGGCAGTCGGTGAT NNNNNN -phosphate
P1 random (10) CCACTACGCCTCCGCTTTCCTCTCTATGGGCAGTCGGTGAT NNNNNNNNNN -phosphate
Random priming P2 (barcoded)
CTGCCCCGGGTTCCTCATTCTCTAAGCCCCTGCTGTACGGC CAAGGCGNNNNNC
Random priming P2
(non-barcoded) CTGCTGTACGGCCAAGGCGNNNNNC
P1 PCR CCACTACGCCTCCGCTTTCCTCTCTATG
P2 PCR CTGCCCCGGGTTCCTCATTCT
Antisense A
(AN8048.4) GTCCGCCAGATATACTA Antisense B
(AN8040.4) GAACTGGCTCTTAATG Antisense C
(AN4023.4) ATCACCGAACTGAGACT Antisense D
(AN4058) CCACCGTATATCATCAG
Splicing A forward 1 GAGCATCGCTACGCTGTT
Splicing A forward 2 CACCTCAAGGAAGCTACA
Splicing A reverse CGATACGACGCCTCTTCT
Splicing B forward TAGAGGTCGGGAGTGATG
Splicing B reverse TTTGTAGAAGGCGGGCTC
Splicing C forward CAGCCAGAGGAGATCAAG
Splicing C reverse GGGGACTCTGTCGAATCT
Splicing D forward AAGGTCGTCGGTTAAGCG
Splicing D reverse AACCCGGTTCTTTCTCCG
42
Splicing E reverse TGCTAGAACGATTTGACC
meaB F1 ATCTTGCGTCAAGACCT
meaB F2 CTTCCGCTTCTGTGTCT
43
2.2. Aspergillus nidulans strains and maintenance.
2.2.1. Aspergillus nidulans strains
Aspergillus nidulans wild-type strain is designated G00 in the Glasgow collection and is a
natural isolate and therefore has no explicit genotype (Pontecorvo et al., 1953).
2.2.2. Growth media
Growth media were as described by Cove (1966) and are listed in Appendix 1.2.1.
2.2.3. Aspergillus nidulans solutions and media
For a list of solutions and media used throughout this thesis, as well as their compositions.
See Appendix 1.2.1.
2.2.4. Maintenance of Aspergillus nidulans cultures
A. nidulans stock cultures were kept as conidia at -80 °C. Strains were grown on minimal media (MM) containing 3 % agar (w/v), with appropriate supplements for 2-3 days at 37 °C.
Conidial suspensions were created by scraping conidia from confluent plates and
resuspending in 20 ml of 0.1% Tween. The approximate concentrations of the resultant
suspensions were determined using a hemocytometer, and 108-109 spores used to inoculate 1 l
flasks containing appropriate media and supplements for each growth condition described in
Table 2.2. Incubations were at 37 °C in an orbital incubator at 200 rpm. Mycelia were
44
washed again with RO filtered water and dried by blotting on paper towels. Dried mycelia
were snap frozen in liquid nitrogen and stored at -80 °C.
Table 2.2.Large scale cultures. This table describes the growth conditions for large scale liquid A. nidulans cultures used throughout this thesis.
Growth condition Media and Supplements Incubation
MM + nitrate 250 ml MM + sodium
nitrate (final concentration 10 mM NO3-)
16 hours
MM + ammonium 250 ml MM + Ammonium
D tartrate (final concentration 10 mM NH4+)
16 hours
Complete medium 250 ml CM 16 hours
4 hour nitrogen starvation
250 ml MM + sodium nitrate (final concentration 10 mM NO3-)then transfer
to 250 ml MM
16 hours then transfer to unsupplemented MM and incubate for a further 4 hours
72 hour nitrogen starvation
250 ml MM + sodium nitrate (final concentration 10 mM NO3-) then transfer
to 250 ml MM
16 hours then transfer to unsupplemented MM and incubate for a further 72 hours
Oat 1 % ground oat in 500 ml
water
72 hours
2.3. Molecular techniques for the manipulation of nucleic acids
2.3.1. Extraction of RNA from Aspergillus nidulans
Mycelia harvested from liquid culture and stored at -80 °C was transferred to liquid nitrogen.
Mycelia were ground to fine powder using a pestle and mortar with the addition of liquid
nitrogen to maintain a fully frozen state. Approximately 1 g of dry, powdered mycelium was
transferred to a 30 ml centrifuge tube containing 1 ml phenol (pH 5.0) and 1.5 ml lysis buffer
45
to mix and centrifuged at 4500 x g for 15 minutes. 0.75 ml supernatant was transferred into a
fresh 1.5 ml Eppendorf tube, to which was added 0.5 ml phenol (pH 5.0). Tubes were
vortexed prior to centrifugation for 15 minutes at 15,000 x g. Approximately 0.5 ml of
supernatant was collected and transferred to a fresh 1.5 ml Eppendorf tube. An equal volume
of 5 M LiCl was deed and tubes left overnight at 4 °C. Precipitated RNA was pelleted by
centrifugation at 4 °C for 60 minutes at 15,000 x g. Pelleted RNA was washed twice with 180
µl 70 % ethanol, dried for 10 minutes in a fume cupboard to prevent contamination, then
dissolved in 400 µl SDW. Ethanol precipitation was performed by the addition of 40 µl 3M
sodium acetate and 1 ml 70 % ethanol, then incubating for at least 1 hour at -20 °C.
Precipitated RNA was pelleted by centrifugation for 15 minutes at 15,000 x g. The
supernatant was removed and pellets washed with 180 µl 70 % ethanol, then re-centrifuged
for 5 minutes at 13,000 x g to ensure retention of the pellet. Pellets were dried for 10 minutes
in a fume cupboard, then dissolved in 50 µl RNA storage solution (5 mM EDTA, 5 % SDS)
and stored at -20 °C, or 50 µl nuclease free water for immediate use.
2.3.2. Nucleic acid quantification
Concentrations of DNA and RNA solutions were measured by Nanodrop [Thermo Scientific]
spectrophotometer, using 2 µl of sample per measurement. Where sample concentration was
expected to be greater than 5 µg/ml samples were diluted by a factor of 10 to achieve greater
46 2.3.3. Agarose gel electrophoresis of DNA
Agarose gel electrophoresis of DNA was performed using horizontal electrophoresis gel
tanks [Fisher Scientific] with 1 X TAE (0.4 M Tris-acetate; 1 mM EDTA) buffer. Gels were
composed of 1.0 to 2.0 % (w/v) agarose in 1 X TAE buffer. Where required, 1 in 5 volumes
of loading buffer was added to DNA samples prior to loading of the gel. Gels were run at 50
to 200 V depending on the size of apparatus and required resolution of DNA size bands, until
the bromophenol dye had travelled 3/4 of the gel length. DNA was stained by the addition of
ethidium bromide to the molten agarose gel at a final concentration of 0.5 µg/ml. Stained
DNA was visualised under ultraviolet (UV) light.
2.3.4. Ethanol precipitation
Nucleic acids were purified and concentrated from solution by ethanol precipitation in the
presence of sodium ions. To improve the efficiency of nucleic acid recovery, DNA or RNA
samples under < 100 µl were diluted to 100 µl volume using nuclease-free water. Sodium
ions were introduced by the addition of 1/10 volumes of sodium acetate solution (3M, pH
5.2), followed by 3 volumes of 100% ethanol. Precipitation reactions were incubated for at
least 2 hours at -20 °C. Samples containing small nucleic acid fragments were incubated
overnight to give the highest possible yield (Zeugin and Hartley, 1985). Precipitate was
collected by centrifugation at 14,000 x g at 4 °C for 30 minutes. The supernatant was
discarded and the pellet washed with 200 µl of 70 % ethanol. A second centrifugation at
14,000 x g for 5 minutes ensured that the pellet was at the bottom of the tube before the
supernatant was discarded. Pellets were dried for 10 minutes in a laminar flow cabinet to
prevent contamination. Dried pellets were dissolved in the appropriate volume of nuclease
47
2.3.5. Phenol:chloroform extraction of nucleic acids
Phenol:chloroform extraction was used to isolated polynucleotides from aqueous solutions
containing proteins. This method relies on phase separation by centrifugation of a mix of the
aqueous sample and a solution containing water-saturated phenol, chloroform and a
chaotropic denaturing solution (guanidinium thiocyanate) (Chomczynski & Sacchi, 1987).
Equal volumes of phenol:chloroform (1:1; v/v) and an aqueous solution containing
polynucleotides to be isolated, were mixed vigorously by vortexing for 20 seconds. Phase
separation was achieved by centrifugation at 13,000 x g for 5 minutes. This resulted in an
upper aqueous phase (containing polynucleotides) and a lower phase (containing proteins
dissolved in phenol and lipids dissolved in chloroform). The aqueous phase was extracted and
ethanol precipitation performed to purify the polynucleotides for downstream applications.
2.3.6. Poly(A) selection using oligo(dT)
Enrichment for mRNA from total RNA samples was performed by Poly(A) selection using
an Oligotex direct mRNA midi kit (QIAGEN) following the manufacturer’s protocols for
purification of mRNA from samples containing starting material of ~500 µg total RNA.
2.3.7. DNA depletion with DNase I
DNase I is an endonuclease that nonspecifically cleaves DNA to release di-, tri- and
oligonucleotide products (Kunitz, 1950; Vanecko and Laskowski, 1961). This enzyme was
used for the depletion of contaminating DNA in total RNA samples extracted from cell
48
degradation. The following components were combined and incubated at 37 °C for 1 hour: 2
μl 10X DNase I buffer (Invitrogen), 0.5 μl RNasein RNase inhibitor (Promega), 0.5 µl DNase
I (Invitrogen) and 17 μl Total RNA sample.
Reactions were stopped by phenol:chloroform extraction and ethanol precipitation.
2.3.8. 5′ decapping of RNA with tobacco acid pyrophosphatase
The 5′ cap structure was removed from mRNAs by treatment with Tobacco Acid
Pyrophosphatase (TAP). The following components were combined and incubated at 37 °C
for 1 hour: 2 μl 10X TAP buffer (Epicentre), 0.5 μl RNasein RNase inhibitor (Promega),
15.75 μl RNA in nuclease free water and 0.25 μl TAP (10 u/µl) (Epicentre).
Reactions were stopped with phenol:chloroform extraction and ethanol precipitation of the
RNA.
2.3.9. RNA fragmentation with zinc acetate
Poly(A) selected RNA was fragmented using the RNA Fragmentation Reagents kit (Ambion)
to achieve fragment sizes of approximately 50-200 nt. This kit uses a form of heat
fragmentation catalyzed by metal ions in the form of Zn2+. 0.9 µl of 10X fragmentation
reagent (zinc acetate solution) was added to 300 µg of poly(A) selected RNA dissolved in 8
µl of nuclease-free water and incubated for 5 minutes at 70 °C. The reaction was terminated
by the addition of 0.9 µl of stop solution (metal chelating agent) and chilling the solution on
ice. The stopped reaction mix was diluted to 500 µl with nuclease-free water and purified by
49
2.3.10. End repair with T4 polynucleotide kinase
To facilitate SOLiD library preparation, T4 polynucleotide kinase (T4 PNK) end repair was
conducted for RNA fragments produced by chemical shearing. The dual functionality of T4
PNK allows it to act as both a 5′-kinase and 3′phosphatase, producing both the 5′ phosphate
group and 3′ hydroxyl group required for SOLiD adaptor ligation. The following reaction mix
was incubated for 10 minutes at 37 °C: 12.5 μl RNA sample in nuclease free water, 2 μl 10X
T4 PNK buffer (Fermentas), 0.5 μl RNasein RNase inhibitor (Promega), 3 μl T4 PNK (10
u/μl) (Fermentas) and 2 μl 5 mM ATP.
Reactions were stopped by the addition of 4 µl of 0.5 M EDTA. RNA was purified by
phenol-chloroform extraction and isolated by ethanol precipitation. The resultant pellet was
dissolved in 8 µl of nuclease-free water for use in SOLiD library preparation.
2.3.11. RNase H degradation of RNA in RNA/DNA duplexes – manufacturer’s protocol
RNase H (Fermentas) was used to selectively degrade the RNA strand in the RNA/cDNA
duplexes created by first strand cDNA synthesis (Vorobjev & Zarytova, 2000) in modified
SOLiD library preparation protocols.
RNA/cDNA hybrids were purified from first strand synthesis reactions by ethanol
precipitation and pellets dissolved in 8 µl of nuclease free water. The following reagents were
mixed and incubated at 37 °C for 20 minutes: 8 μl RNA/cDNA hybrid solution, 1 μl 10X
RNase H reaction buffer (Fermentas) and 1 μl RNase H (Fermentas),
50
2.3.12. RNase H degradation of single stranded RNA in RNA/DNA duplex - modified protocol
1 µl of RNase H (Fermentas) was added to 10 µl of first strand synthesis solution containing
RNA/DNA hybrids and the reaction mix incubated at 37 °C for 20 minutes. Stopping of the
reaction was not required for downstream applications.
2.3.13. First strand cDNA synthesis with random priming P2
Hybridisation of the degenerate N6 sequence of random primer P2 was performed by
combining the following reagentsand incubating the reaction at 65 °C for 5 minutes then
snap cooling on ice for 2 minutes: 10 μl (~1 µg) Fragmented RNA sample, 5 μl Random
primer P2 (10 nm/µ1) and 2 μl dNTPs (10 μM),
First strand synthesis was performed using Superscript III reverse transcriptase (Invitrogen).
An RT master mix was created with the reagents in Table 2.3. 23 µ1 of RT master mix was
added to each hybridisation reaction and RT incubation performed in a thermal cycler as
shown in Table 2.4.
Table 2.3. Reaction components for reverse transcription.
Volume Component
9 μl Nuclease-free water 8 μl 5X First Strand buffer 2 μl DTT (0.1 M)
2 μl RNasin
51
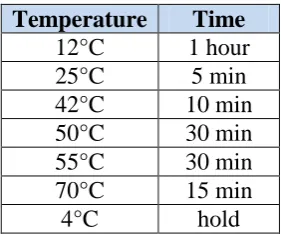
Table 2.4. Incubation temperatures and times for reverse transcription. Temperature Time
12°C 1 hour
25°C 5 min
42°C 10 min
50°C 30 min
55°C 30 min
70°C 15 min
4°C hold
2.3.14. P1 adaptor ligation
Ligation of the P1 adaptor to cDNA was performed using DNA ligase (Promega). The
following reagents were combined and incubated for 16 hours at 16 °C in a thermal cycler: 7
μl cDNA, 2 μl Adaptor N6 or N10 (10 nm/µ1), 10 μl 2X ligation buffer and 1 μl DNA ligase (Promega).
2.3.15. Second strand synthesis with proofreading TAQ
Second strand synthesis of cDNA ligated to the P1 adaptor using KOD hot start DNA
polymerase (Novagen). The components in Table 2.5 were combined and incubated at 95 °C
[image:51.595.66.207.96.213.2]for 4 minutes to activate the enyzme.
Table 2.5. Reaction components for second strand synthesis.
Volume Component
6 μl MgSO4 (25 mM)
10 μl DNTPs (2 mM)
10 μl 10 X buffer
2 μl KOD hot start polymerase 52 μl Nuclease-free water
52
2.3.16. Chemically fragmented library amplification with primers P1 and P2
PCR amplification of libraries was conducted using KOD hot start polymerase (Novagen).
KOD hot start polymerase is a premixed complex of KOD DNA Polymerase and two
monoclonal antibodies that inhibit the DNA polymerase and 3´→ 5´ exonuclease activities at
ambient temperatures (Mizuguchi et al., 1999). This helped to avoid non-specific
amplification due to mispriming events that can occur during setup and initial temperature
increase. Primer degradation during setup at room temperature due to exonuclease activity is
also effectively inhibited.
PCRs were set up as shown in Table 2.6. Reactions were incubated at 95 °C for 5 minutes to
activate the KOD hot start polymerase, then subjected to 10-18 cycles of PCR as described in
Table 2.7. A final extension step was conducted for 5 minutes at 72 °C to promote complete
synthesis of all PCR products (Sullivan et al., 2006).
Table 2.6. Reaction components for PCR amplification of chemically fragmented libraries.
Volume Component
10 μl cDNA
60μl Nuclease-free water 6 μl MgSO4 (25 mM)
10 μl dNTPs (2 mM)
10 μl 10X KOD Hot Start Polymerase buffer 1 μl P1 primer (10 nm/ µl)