FUNCTIONAL AND STRUCTURAL MAGNETIC RESONANCE IMAGING OF
HUMANS AND MACAQUES
Thesis by
KYLE ALAN BERNHEIM
In Partial Fulfillment of the Requirements for the degree of
Doctor of Philosophy
CALIFORNIA INSTITUTE OF TECHNOLOGY
Pasadena, California
2004
2004
iii
DEDICATION
ACKNOWLEDGEMENTS
My first thanks must and do go to my friend and mentor David Dubowitz. David’s teachings were important in the fact that the scientific background of MRI and fMRI in which he instructed me were tempered always with the common sense and experience that came from his years as a radiologist. Indeed, there is much about him that I can only hope to carry with me through my future, both in career and private life. As a scientist he gave me knowledge; as a friend he gave me advice. Here’s to you, Dubie.
I thank Richard Andersen, my advisor, for taking me on as a young second year medical student and giving me the chance to perform in his laboratory. The atmosphere and camaraderie he welcomed me to was, simply, fantastic. I can only hope my further experiences in science will be so fine. With his help and guidance I was able to select a further group of gentlemen: Igor Fineman, Scott Fraser, Mark Konishi and Shin Shimojo – my thesis committee. While thanking them before my defense may be premature, I can safely say they were, all of them, fine role models for a young scientist.
ABSTRACT
TABLE OF CONTENTS
Dedication ...iii
Acknowledgements... iv
Abstract ... vi
Table of Contents ...viii
List of Figures ... xiv
List of Tables... xvi
Chapter I: Introduction... 1
I.1 Magnetic Resonance Imaging... 1
I.1.1 Structural MRI... 3
I.1.2 Functional MRI ... 4
I.1.2.1 Blood Oxygen Level Dependent (BOLD) Contrast ... 6
I.1.2.2 Exogenous Contrast ... 6
I.2 The Visual Motion Aftereffect... 7
I.2.1 Electrophysiology of the Motion Aftereffect ... 8
I.2.2 fMRI Investigation of the Motion Aftereffect... 9
I.3 Functional Imaging in the Macaque ... 9
I.3.1 Early Experiments... 10
I.3.2 Mapping Visual Cortex... 10
ix
I.4 Surgical Planning ... 11
I.5 Determining Electrode Penetration Sites... 12
Chapter II: Human Functional Imaging ... 14
II.1 Abstract ... 14
II.2 Introduction ... 15
II.3 Materials and Methods... 17
II.3.1 Subjects ... 17
II.3.2 Stimulus... 17
II.3.3 MR Imaging ... 18
II.3.4 Image Analysis... 18
II.3.5 Time Course Analysis... 19
II.4 Results ... 19
II.4.1 Localization of Motion Sensitive Areas... 19
II.4.2 Separation of pMT and pMST... 20
II.4.3 The Motion Aftereffect Response ... 21
II.4.4 Differential Activation in pMT and pMST... 21
II.5 Discussion ... 22
II.5.1 Distinguishing Human pMT and pMST ... 22
II.5.2 Contributions of pMT and pMST to the Motion Aftereffect ... 22
II.6 Conclusion... 23
II.7 Acknowledgement ... 24
III.1 Abstract ... 33
III.2 Introduction... 34
III.3 Materials and Methods ... 35
III.3.1 Animal Subjects... 35
III.3.2 Contrast Agent... 37
III.3.3 MR Imaging... 37
III.3.4 Stimulus Paradigm... 38
III.3.5 Image Post-processing... 38
III.4 Results... 43
III.5 Discussion... 44
III.6 Conclusion ... 48
III.7 Acknowledgement... 49
Chapter IV: Macaque Anatomical Imaging... 54
IV.1 Microwire Placement ... 54
IV.1.1 Abstract... 54
IV.1.2 Introduction ... 55
IV.1.3 Methods ... 57
IV.1.3.1 Animal Training... 58
IV.1.3.2 MR Imaging ... 58
IV.1.3.3 Electrode Arrays... 59
IV.1.3.4 Electrode Implantation... 60
xi
IV.1.3.4b Procedure... 61
IV.1.3.4c Post-operative Care ... 62
IV.1.3.5 Recordings... 63
IV.1.4 Results ... 63
IV.1.5 Discussion... 65
IV.1.6 Neural Prosthesis... 66
IV.1.7 Acknowledgement... 67
IV.2 Electrode Localization... 68
IV.2.1 Abstract... 68
IV.2.2 Introduction ... 69
IV.2.3 Materials and Methods... 71
IV.2.3.1 Animal Subjects ... 71
IV.2.3.2 MR Imaging ... 71
IV.2.4 Results ... 72
IV.2.5 Summary... 73
IV.2.6 Acknowledgement... 74
IV.3 Implantable MRI Sensitive Fiducial Beads... 75
IV.3.1 Methods ... 76
IV.3.1.1 Fiducial Beads... 76
IV.3.1.2 Bead Implantation ... 76
Chapter V: Summary and Future Directions... 93
V.1.1 Human Subjects... 93
V.1.2 Macaque Subjects... 94
V.1.3 Functional Imaging... 95
V.1.4 Anatomical Imaging ... 95
V.1.5 Investigation of the Motion Aftereffect ... 95
V.1.6 Use of an Iron Oxide Contrast Agent... 96
V.1.7 Guidance of Microwire Placement ... 97
V.1.8 Determining Chamber Coordinates and Electrode Localization... 97
V.1.9 Implantable Fiducial Markers ... 98
V.1.10 Final Words ... 98
V.2 Vertical Bore Systems for Macaque fMRI ... 99
V.3 Merging Functional and Anatomical Imaging... 100
References ... 102
Appendix A: Stimulus Generation ... 118
A.1 Stim.c ... 118
A.1.1 Description... 118
A.1.2 Use ... 118
A.1.3 Code ... 119
Appendix B: Image Processing ... 129
B.1 SiemensMagnetomVision.h... 129
xiii
B.1.2 Use... 129
B.1.3 Code ... 129
B.2 TAGS.C... 134
B.2.1 Description... 134
B.2.2 Use... 135
LIST OF FIGURES
Number Page
Figure II.1 Stimulus schematic ... 25
Figure II.2 Functional activation of human V1 and lateral occipital complex... 26
Figure II.3 Blood oxygen level dependent contrast activation time course of human pMST... 27
Figure II.4 Blood oxygen level dependent contrast activation time course of human pMT... 28
Figure II.5 Motion aftereffect in human pMST, right hemisphere ... 29
Figure II.6 Summary statistics of human pMST ... 30
Figure II.7 Summary statistics of human pMT... 31
Figure III.1 Functional activation of macaque V1 ... 50
Figure III.2 Time course of activation for blood oxygen level dependent and contrast mediated response... 51
Figure III.3 Magnetite concentration effects on R2 ... 52
Figure III.4 Time dependent magnetite concentration in blood... 53
Figure IV.1.1 Lateral view and coronal section of macaque cortex ... 77
Figure IV.1.2 Coronal MRI image with implantation planning ... 78
Figure IV.1.3 Microwire electrode insertion ... 79
xv
Figure IV.1.5 Spiking activity during the delayed reaching task... 81
Figure IV.2.1 Oblique MRI image of cortex of monkey T... 83
Figure IV.2.2 3D rendering of head of monkey T... 84
Figure IV.2.3 Coronal MRI image of monkey R ... 85
Figure IV.2.4 Coronal MRI image of monkey S... 86
Figure IV.2.5 Axial MRI image of monkey R ... 87
Figure IV.2.6 Axial MRI image of monkey S... 88
Figure IV.2.7 3D rendering of head of monkey R ... 89
Figure IV.2.8 3D rendering of head of monkey S... 90
Figure IV.3.1 Custom and commercial MRI fiducial markers ... 91
LIST OF TABLES
1
CHAPTER I: Introduction
I.1 MAGNETIC RESONANCE IMAGING
term pixel specifies a two-dimensional unit of resolution.
3 In discussion of MRI pulse sequences, particularly the gradient echo which finds common use in fMRI, the term T2* is often encountered. In actual measurement, the signal decays much faster than would normally be predicted by T2 relaxation. The source of this additional speed is relaxation from the spins of the individual nuclei dephasing as they encounter local fluctuations in the magnetic field, and is designated as the T2* rate of relaxation.
I.1.1 Structural MRI
of tissue is common in anatomical studies, it is not unusual to acquire a T2 image as well, due to certain types of pathology being more readily discernable in a T2 image.
Acquisition time in an anatomical study is usually only constrained by fatigue of the patient within the bore or clinical concerns. Essentially, only one measurement of each voxel volume needs to be made, although scans are often repeated for purposes of signal averaging. The resolution of such scans can therefore be very high to accommodate clinical discrimination of tissue features, with any drop in signal being overcome by lengthening the acquisition time of the scan. Contrast this method with the need for rapid whole volume acquisition in functional imaging, as discussed below.
I.1.2 Functional MRI
I.1.2.1 Blood Oxygen Level Dependent (BOLD) Contrast
It is the magnetic properties of hemoglobin itself which make a truly noninvasive functional imaging technique possible with MRI. Ever since the local blood oxygenation state was linked to signal intensity changes (Ogawa et al., 1990), the BOLD contrast method has been nothing short of a revolution in functional imaging. The technique depends on the fact that deoxyhemoglobin is weakly paramagnetic, and thus causes a local decrease in signal strength in vasculature and surrounding tissue. Specifically, as blood oxygenation decreases, its T2* shortens as well. However, when an area of cortex becomes active, cerebral blood flow and blood volume increase leading to an eventual lowering of the oxygen extraction fraction of the blood – that is, the blood supply increases beyond the demand, causing an eventual decrease in the level of deoxyhemoglobin. As the amount of deoxyhemoglobin diminishes, the paramagnetic effects are removed, and a rise in signal intensity is measured. In BOLD imaging, therefore, an activated area of cortex would demonstrate an elevation in signal intensity.
I.1.2.2 Exogenous Contrast
7 use in the imaging of organ tissue, but can be readily adapted as a functional contrast as well. Recently, the agent MION has been developed specifically for fMRI and demonstrates improvements over other iron oxide contrasts in terms of spatial and temporal resolution (Shen et al., 1993; Mandeville et al., 1998). In this case, when an areas of cortex becomes active, the local vasculature expands with an increase in cerebral blood volume, resulting in a given volume of brain having relatively more of the iron oxide agent. This local concentration of iron oxide produces a focal inhomogeneity in the magnetic field of the scanner. Nuclei affected by this inhomogeneity dephase quickly producing a drop in T2*. Much like the effects then of deoxygenated blood, a drop in signal intensity is observed. It is important to note that this is the opposite effect of the BOLD signal: with an iron oxide contrast agent, an increase in activation yields a decrease in signal intensity.
I.2 THE VISUAL MOTION AFTEREFFECT
the MAE is also considered. Storage occurs when the eyes are shut or the visual field is darkened immediately after viewing of the moving stimulus. Subsequent presentation of a static field will revive the MAE at a period when it normally would have faded.
I.2.1 Electrophysiology of the Motion Aftereffect
9 contribute to the perception of illusory motion in the visual MAE.
I.2.2 fMRI Investigation of the Visual Motion Aftereffect
Similar to the electrophysiology, investigation of the time course of fMRI activation during a MAE task shows a correlation between perceived strength of motion and the MR signal strength (Tootell et al., 1995). Furthermore, this technique allowed the anatomical localization of an area in human cortex which responded similarly to the macaque motion-sensitive areas MT and MST (Tanaka et al., 1986). This early study did not have the spatial resolution to separate the two regions functionally, and the area was therefore termed the MT+ complex in human. More recent investigations involving hemifield stimuli similar to those used here were able to functionally dissect human MT+ into putative MT (pMT) and MST (pMST) regions posteriorly and anteriorly, respectively (Dukelow et al., 2001). A separate study has linked the effects of selective attention to an upregulation of the response during the MAE (Huk et al., 2001).
I.3 FUNCTIONAL IMAGING IN THE MACAQUE
of the concerns of electrophysiology in the macaque now must be dealt with in the cramped, isolated and potentially dangerous bore of an imaging system. However, this has not prevented investigation and development of methods for acquiring fMRI data in both the awake and anesthetized monkey.
I.3.1 Early Experiments
The earliest functional imaging experiments conducted in the macaque used positron emission tomography (Takechi et al., 1994), but it was not long before the use of fMRI was proposed (Westergaard et al., 1997) and ultimately accomplished (Dubowitz et al., 1998; Stefanacci et al., 1998). Initial results in visual cortex demonstrated that fMRI and the BOLD contrast method of imaging were viable tools for neurophysiologic investigation of the macaque. Early work was done entirely in clinical and research magnets all with a common horizontal bore. This confined the animal to be positioned in the “sphinx” position – prone with the head raised – a technique which is still used today. Development of vertical bore magnets at a handful of facilities now enables natural upright positioning of the animal.
I.3.2 Mapping Visual Cortex
11 well conserved between monkey and human. In particular the early areas V1 and V2 are virtually identical, with variations of shape and cortical area beginning at the level of V3 (Vanduffel et al., 2001). Further along the visual pathway in V4, anatomical differences start to predominate, although the areas may be similarly functionally identified in human and macaque by color selectivity (Tootell et al., 2004). Current research has focused on more clearly defining the boundaries of these and other areas in the visual pathway (Brewer et al., 2002).
I.3.3 Current Studies
As the technique begins to proliferate, macaque cortex beyond the primary visual areas is currently being investigated. Anterior regions in the ventral stream of object and shape recognition are being described (Denys et al., 2004) and are demonstrated to show selective activation for the presentation of intact versus scrambled objects. Similarly, these areas have also been found to respond to images of faces (Tsao et al., 2003). Beyond passive viewing experiments, areas of cortex responsive to the execution and direction of saccades have been functionally imaged in frontal eye fields and posterior parietal cortex (Koyama et al., 2004).
I.4 SURGICAL PLANNING
tumor, the high-resolution of MRI clearly provides a major aid. Indeed, beyond investigation in humans, anatomical imaging has been used for localization and differentiation in species useful in experimentation, such as the rhesus monkey (Price et al., 1997). Adapted to the neuroscience laboratory, medical uses may still be prevalent, but in the case of single and multiple cell electrophysiology a prime concern is the targeting of implanted electrodes or recording chambers (Asahi et al., 2003; Scherberger et al., 2003). Precise drug delivery, necessary in lesioning, also benefits from image-based targeting (Blaizot et al., 1999). While use of a magnet-compatible and visible stereotaxic device has been developed for surgical planning in the macaque (Saunders et al., 1990), such a technique requires specialized equipment that may not be readily available. Fortunately, anatomical landmarks commonly used in stereotaxic positioning, such as the internal auditory meati, can be visualized by imaging. The acquired image can be modified by computational methods (Cox, 1996a) to any alignment, in this case orthogonal to a stereotaxic setup. Using anatomical or functional landmarks to identify the structures of interest on the MRI image, the surgeon is then able to position chambers and/or electrodes by using the coordinate frame of the stereotaxic device inside the operating theatre (Dubowitz, 2002a). Such precise targeting helps to ensure that neurons of interest fall near subsequent electrode penetrations, sparing the time and effort of the experimenter and subject.
I.5 DETERMINING ELECTRODE PENETRATION SITES
CHAPTER II: Human Functional Imaging
This study served as my true introduction to the process of designing and implementing a fMRI experiment. Ultimately, the use of a human population as subjects for an experiment is easier in terms of task design, and is perhaps best suited to a non-invasive technique such as fMRI. Although, for purposes of length, examples of computer code produced to make these experiments possible are presented later in the appendices, such exercises were integral to the understanding of how fMRI data is acquired and processed.
II.1 ABSTRACT
15 following the nonadaptive stimulus from that of the adapting stimulus. While both areas demonstrated a residual MAE response, the activation following ipsilateral versus contralateral stimulation in pMT was not statistically different. This suggests that while pMT may contain a MAE response, it is weak relative to the downstream area pMST.
II.2 INTRODUCTION
17
II.3 MATERIALS AND METHODS
II.3.1 Subjects
All subjects gave informed consent prior to participation and the study was performed under the approval of the Long Beach Memorial MRI facility. Six subjects (male, ages 25-44) are included in the study, imaging data was acquired from each subject for 8 to 10 repetitions of the paradigm.
II.3.2 Stimulus
to accurately fixate on the central point was determined in an offline session using an infrared eye tracking device (Iscan Inc., Cambridge, MA.)
II.3.3 MR Imaging
All data was collected on a 1.5 T Magnetom Vision clinical MRI scanner (Siemens, Erlangen, Germany) with 25 mT/m (300 µs rise time) gradients. A conventional “birdcage” head coil was used for all measurements. Anatomical imaging was performed using a magnetization prepared rapid acquisition gradient echo sequence (TR 14 ms, TE 4 ms, 30 degree flip angle) with a 256 x 256 mm field of view on a 256 x 256 matrix yielding a native in plane resolution of 1 x 1 mm. 150 slices were acquired sagittally at 1 mm spacing to preserve voxel isotropy. Functional imaging was performed using a custom low-bandwidth (833 Hz/Px) echo-planar gradient echo sequence (TE 50 ms, TR 2 s effective, 90 degree flip angle) with a 256 x 256 mm field of view on a 64 x 64 matrix yielding an in plane resolution of 4 x 4 mm. 16 slices were acquired coronally at 4 mm spacing giving a final isotropic voxel resolution of 4 mm.
II.3.4 Image Analysis
19 epochs, and left visual field only epochs. The correlation map thus provided were thresholded at a p < 0.05 (corrected via the Bonferroni method for multiple measurements) and plotted as a cubic-interpolated overlay on the aligned anatomical images.
II.3.5 Time course Analysis
The time course of signal intensities in bilateral regions of interest along the posterior reaches of the infratemporal sulcus was recorded from voxels meeting the thresholding requirements described above. To begin to distinguish pMT from pMST, voxels with a significantly different (p < 0.05, 2-tailed paired t-test) average maximum intensity during the ipsilateral moving stimulus versus the contralateral moving stimulus were designated pMT/pMST while the remainder were designated pMST. Data was then averaged across subjects by area of interest calculating each hemisphere separately. To compute the residual signal corresponding to the motion aftereffect, the signal intensities for the expanding and contracting epochs were subtracted from the contracting only epochs. Peak intensity measurements were recorded from the acquisition yielding the highest BOLD signal response following motion stimulus presentation (in the case of real motion) or following the offset of subtracted motion periods (in the case of the motion aftereffect.)
II.4 RESULTS
II.4.1 Localization of Motion Sensitive Areas
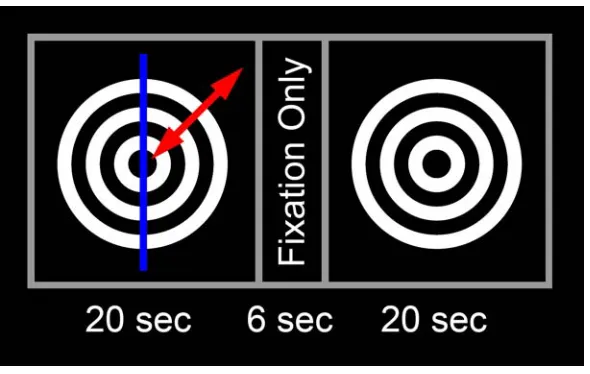
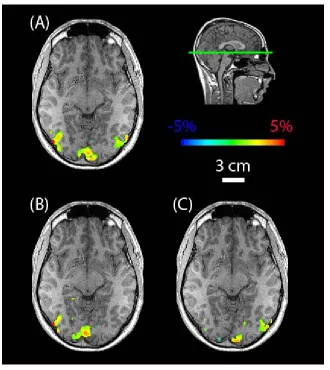
(Figure II.1). The moving stimulus consisted of a series of concentric rings about the fixation point which contracted in the adaptive presentation or expanded and contracted in the nonadaptive presentation. To separate areas of cortex in each hemisphere responsive to motion in the ipsilateral and contralateral visual fields, only one hemifield of the stimulus was in motion at a given time. A similar whole field stimulus has been used previously to elicit response to motion from a variety of visual areas (Tootell et al., 1995). The stimulus used here had a common effect, and functional activation was demonstrated in visual cortex and the lateral occipital complex (LOC). By performing a cross correlation analysis of voxels responsive to a stimulus during all, ipsilateral only or contralateral only epochs of real motion, the extent and lateralization of active areas is visible (Figure II.2).
II.4.2 Separation of pMT and pMST
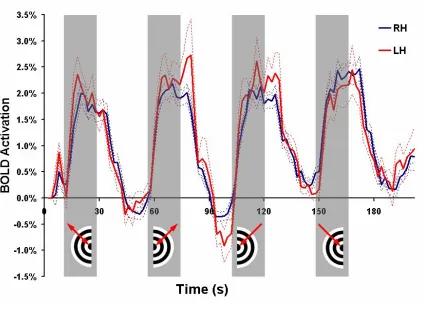
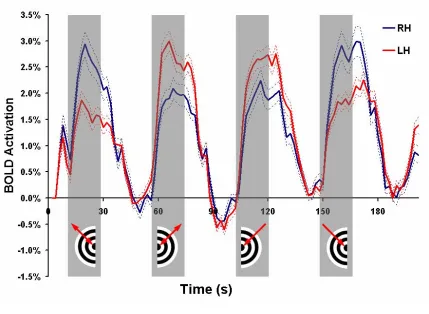
21 response (Figure II.3) and 127 (78 left hemisphere, 49 right hemisphere) were found to have a pMT response (Figure II.4). Voxels with pMT effects also displayed activation during ipsilateral motion presentation likely due to pMT receptive fields slightly crossing the vertical visual meridian and contamination by pMST effects.
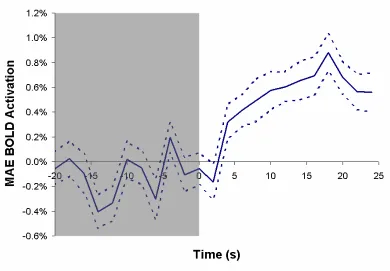
II.4.3 The Motion Aftereffect Response
Determination of the residual activation during the stationary or motion aftereffect stage of the stimulus was accomplished by subtracting the response of the nonadaptive stimulus from that of the adaptive stimulus (Figure II.5) as was described previously (Tootell et al., 1995). Peak response to real motion or the motion aftereffect was determined from the time point acquisitions having the greatest functional activation in the period following motion stimulation presentation or termination, respectively. A six second delay was allowed for lag of the hemodynamic response, but did not affect selection.
II.4.4 Differential Activation in pMT and pMST
II.5 DISCUSSION
II.5.1 Distinguishing Human pMT and pMST
Motion-sensitive areas in human LOC were determined using BOLD contrast fMRI. Subregions in the posterior infratemporal sulcus have been shown previously to correspond to macaque MT and MST (Tootell et al., 1995; Dukelow et al., 2001). Electrophysiology in the macaque shows that areas MT and MST contain receptive fields which span the midline of visual space, crossing the vertical meridian by 10-15% in the case of MT and 30-40% in the case of MST (Raiguel et al., 1997). In order to separate the areas entirely by eccentricity of receptive fields, a large central portion of the visual field could be left dark during stimulation (Dukelow et al., 2001). The presentation equipment used for this study allowed for only central visual field stimulation, so incomplete separation of the areas was anticipated. Despite this crosstalk, it was possible to separate the functional volumes into two distinct populations: those with and without a difference in level of activation for stimulus presentation in the ipsilateral and contralateral visual hemifields. While voxels having no significant difference suggest a representation of pMST, the remainder are a combination of pMT and pMST like volumes. However, for purposes of this study, the contribution of the pMT effects towards activation during real and illusory movement may be determined.
II.5.2 Contributions of pMT and pMST to the Motion Aftereffect
23 keeping with numerous previous functional studies. Activation during subsequent static image viewing was found to peak at approximately 40% of the response to real motion, the attenuation possibly due to the delay in presentation from the storage period. The time course of the MAE response was similar to that published in a previous study of storage of the motion aftereffect (Culham et al., 1999). Human pMT, which demonstrated greater activation for stimulus presentation in the contralateral than the ipsilateral visual hemifield, did not show a significant difference in activation during the MAE period in the two hemifields although the trend was preserved. This effect was consistent across hemispheres. As a relatively smaller MAE response has been found in areas upstream in the visual pathway (Tootell et al., 1995) it is unlikely that pMT does not contribute to the activation entirely. This data suggests that the response of pMT to the motion aftereffect is on the order of the response of pMST.
II.6 CONCLUSION
first time the presence of a MAE signal has been shown in functionally identified human pMST.
II.7 ACKNOWLEDGEMENT
25
Figure II.1
Figure II.2
27
Figure II.3
Figure II.4
29
Figure II.5
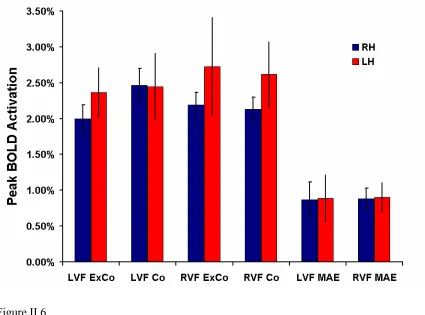
Figure II.6
31
Figure II.7
Area RH pMT
Response Type LVF Co LVF ExCo LVF MAE RVF Co RVF ExCo RVF MAE
Peak Activation 2.99% 2.94% 1.19% 2.24% 2.10% 0.86%
SEM (+/-) 0.29% 0.23% 0.23% 0.21% 0.20% 0.23%
Area RH pMST
Response Type LVF Co LVF ExCo LVF MAE RVF Co RVF ExCo RVF MAE
Peak Activation 2.47% 2.00% 0.87% 2.13% 2.19% 0.88%
SEM (+/-) 0.23% 0.20% 0.25% 0.17% 0.17% 0.15%
Area LH pMT
Response Type LVF Co LVF ExCo LVF MAE RVF Co RVF ExCo RVF MAE
Peak Activation 2.25% 1.87% 1.00% 2.74% 3.00% 1.21%
SEM (+/-) 0.17% 0.17% 0.15% 0.19% 0.19% 0.14%
Area LH pMST
Response Type LVF Co LVF ExCo LVF MAE RVF Co RVF ExCo RVF MAE
Peak Activation 2.45% 2.37% 0.89% 2.62% 2.73% 0.90%
[image:48.612.111.540.200.439.2]SEM (+/-) 0.46% 0.35% 0.32% 0.46% 0.69% 0.21%
Table II.1
33
CHAPTER III: Macaque Functional Imaging
This experiment was my first experience working with non-human primates. I owe much of my knowledge of macaque training and experimentation to David Dubowitz, who was quick to enable me to work with the animal on my own. This work was originally published under the title of “Enhancing fMRI Contrast in Awake Behaving Primates Using Intravascular Magnetite Dextran Nanoparticles” (Dubowitz et al., 2001a). All fMRI data was acquired jointly, I was responsible for the analysis of the fMRI data, while David Dubowitz acquired and analyzed the spectrometer data. Dar-Yeong Chen provided technical assistance at the scanning facility, which was graciously lent to us by William Bradley.
III.1 ABSTRACT
Functional MRI in awake behaving primates is an emerging tool for bridging the gap between human functional MRI (fMRI) and neurophysiology information from non-human primates. We report the use of magnetite dextran nanoparticles (Feridex) as a blood-pool agent to enhance fMRI contrast-to-noise (CNR) in primate fMRI. Intravascular half-life of the magnetite dextran was long compared to lanthanide chelates (T½=198 minutes) with
shortened T2 relaxation observed in blood and cerebral cortex. Greater than 3-fold
increased CNR allows greater flexibility in the design of awake behaving primate fMRI studies with the potential for improvements in resolution and significantly shortened imaging times.
III.2 INTRODUCTION
35 effects by anesthetic agents, and consequent changes on cerebral blood flow (CBF) (Seifritz et al., 2000). The use of anesthesia also excludes cognitive studies for which awake behaving subjects are required.
We investigated the effect of a blood-pool T2 contrast agent on CNR compared with
conventional BOLD contrast in awake behaving primate fMRI experiments. Previous studies have demonstrated the utility of such agents for MRI in rats (Mandeville et al., 1998), cats (White et al., 1992) and human subjects (Scheffler et al., 1999).
The use of contrast agents has not found much favor in human cognitive studies because this makes the study more invasive, but holds promise for awake animal studies. This is the first time this technique has been applied to awake primate imaging. Techniques that employ a T2 contrast agent provide images sensitive to changes in regional cerebral blood
volume (CBV). This has been shown in rats to change by 20% with neural activation (Kennan et al., 1998; Mandeville et al., 1998) and by 25% (Scheffler et al., 1999) to 32% (Belliveau et al., 1991) in humans. Unlike deoxyhemoglobin susceptibility, the CBV change is not dependent on applied magnetic field (Mandeville et al., 1998), and thus this technique provides great scope for improved fMRI contrast even at conventional magnetic fields (1.5 T).
III.3 MATERIALS AND METHODS
Approval for this research was obtained from the Institutional Animal Care and Use Committee, Epidemiology and Biosafety Committees. All imaging was done on a 1.5 T Siemens Vision MR scanner with 23 mT/m gradients (300 µs rise time). Awake behaving studies were done on a 8.5 kg male rhesus macaque monkey (macaca mulatta) lying in a “sphinx” position within the scanner using a 19 cm circularly polarized knee coil. Contrast excretion measurements were done outside the MR scanner on the same animal. Relaxometry studies were also performed on this monkey and on two additional male macaque monkeys (5.5 kg and 10.5 kg) under isoflurane anesthesia. The technique has been previously described (Dubowitz et al., 1998; Dubowitz et al., 2001b), but in brief: The animal was transported to the MRI facility in a custom designed cage. For awake studies he crawled into a short tube so that his legs were accessible for intravenous administration of T2 contrast agent. The monkey was trained to present his leg to the animal handler and
37 accuracy of within 1º of arc. The animal was trained to remain motionless in the scanner for the duration of the imaging experiment (i.e., while gradient noise was audible) and to fixate on a central fixation point to an accuracy of <4º visual angle for the duration of the stimulus. He was provided a fruit juice reward at the end of each imaging run. For anesthetized studies, the animal was sedated with 10mg/kg ketamine and maintained on 2% isoflurane using an anesthetic setup modified for MRI compatibility.
III.3.2 Contrast Agent
For functional imaging studies with T2 contrast agent we used magnetite dextran
nanoparticles (Feridex, Advanced Magnetics Inc, Cambridge, MA) infused intravenously. This was given as 4.2 mgFe/kg (750 µMol/kg) diluted into 25ml and infused over 5 minutes through a 5µm filter. Imaging was started within 10 minutes of completing the infusion (ensuring equilibrium state concentration). For assessment of whole blood clearance, a dose of 2.8 mgFe/kg (500 µMol/kg) was used.
III.3.3 MR Imaging
BOLD and magnetite-enhanced functional images were acquired using a gradient-echo echo planar imaging (GE-EPI) mosaic sequence. The effective echo time (TEeff) of 50ms
was chosen to approximate the T2* of monkey cortex (Dubowitz et al., 2001b). Isotropic
experiments and 60 repetitions for magnetite dextran experiments. The first repetition was not used in data analysis allowing 2 seconds to ensure steady state. Anatomical images used a 3D Magnetization Prepared Rapid Acquisition Gradient Echo sequence (3D-MPRAGE) with TR/TE = 11.4 / 4.4 ms, flip angle 12 degrees, inversion time (preparation time) 250 ms and delay time (magnetization recovery time) 600ms. A 141 x 141mm field of view (FOV) was acquired with a 128 x 128 matrix (zero-padded to 256 x 256), and 118 phase encode steps made through a 130mm slab (1.1mm isotropic resolution). Relaxometry measurements for T2* (R2*) in cortex used a 2D Fast Low Angle Shot (FLASH) sequence
(TR 1000 ms, TE 5, 7, 10, 12, 15, 18, 20ms) as previously described (Dubowitz et al., 2001b). Relaxometry measurements on in-vitro venous blood were performed using a CPMG spectroscopy sequence on a Bruker minispec mq60 at 60Mhz (Bruker Analytik GmbH, Rheinsteffen, Germany).
III.3.4 Stimulus Paradigm
The stimulus consisted of a six second black and white polar checker-board alternating at 8Hz, which subtended a visual angle of ±20º. The stimulus was preceded by a 1º fixation point visible for 8 seconds. Following the fixation dot and checker board stimulus the animal remained in the dark for a further 76-106 seconds to allow acquisition of the full recovery of the hemodynamic response.
III.3.5 Image Post-processing
off-39 line using AFNI software running on a UNIX workstation (Cox and Hyde, 1997).
Functional images were co-registered using a volume-registration algorithm under AFNI. A weighted linear least squares fit of the images was employed with Fourier interpolation used for resampling (Cox and Jesmanowicz, 1999). Images with excessive motion artifact not corrected by the registration algorithm were excluded. The remaining runs were averaged together to create a single dataset for BOLD imaging and a single dataset for magnetite-enhanced imaging. A representative region of interest was chosen in primary visual area V1 (Figure III.1). The time course of the percent change in MRI signal in this volume was plotted for BOLD and magnetite-enhanced fMRI (Figure III.2).
For cerebral relaxometry measurements following magnetite dextran infusion, regions of interest were drawn around anatomically defined gray matter using Scion Image software (http://www.scioncorp.com). R2* transverse relaxation rate was calculated by assuming an
exponential relationship between the MR signal, S(TE), the echo time, TE, and the initial signal S(0) described by Equation 1:
[1]
The fit optimization was implemented in Matlab (The Mathworks Inc., Natick, MA) using a proprietary large-scale subspace trust-region algorithm based on an interior-reflective Newton method (Coleman and Li, 1996). The algorithm allows specification of upper and lower bounds on each optimized parameter.
*
2
)
0
(
)
(
TE
S
e
TERRelaxivity data on whole blood to assess clearance of contrast media was assumed to follow first order kinetics and was modeled with monoexponential decline described by Equation 2.
[2]
[Fe]Blood is the concentration of Fe in blood, C0 is the instantaneous concentration at time
zero. Dividing the injected dose by the instantaneous concentration of contrast media, C0,
yields the volume of distribution of the agent within the animal. The constant, b, is an excretion constant from which the half life of elimination from blood can be calculated.
There is a linear relationship between the transverse relaxation rate of the magnetite dextran contrast media in blood and the concentration of Fe. The main components of the measured R2*are components from blood itself, R2*Blood, and from exogenous magnetite,
R2*Fe. (Equation 3):
[3]
The unknown contribution to transverse relaxation rate from Fe, R2*Fe, used in Equation 3
was calculated by making serial dilutions of a known concentration of Feridex with water as described in Equation 4 (Figure III.3a).
bt Blood
C
e
Fe
]
=
0⋅
−[
Blood Fe
Blood
R
k
Fe
41
[4]
Using Equations 4 and 5, the actual concentration of Fe was quantified from measurements of R2* for whole blood drawn at regular intervals following injection of the contrast agent
(Figure III.3b).
To compare the magnitude, duration and onset delay of the positive MR signal change for BOLD with the negative signal change for magnetite-enhanced fMRI, the data was fitted to a gamma-variate function of the form in Equation 5 using the same Matlab routine described above.
[5]
A, r, and a are fit constants and t0 defines the onset delay following the neuronal stimulus.
The maximum signal change was the peak of the curve. The duration of activity was compared during the period when the MR signal exceeded 10% of its maximal value.
We calculated the percentage change in the regional cerebral blood volume following photic stimulation. This model assumes that the effect of the decreased transverse relaxation rate due to BOLD is negligible compared to the increase due to CBV changes with the intravascular contrast agent. Previous studies have shown the rate of change in
water Fe
water
R
k
Fe
R
2*
+
2*
=
⋅
[
]
a t t r
e
t
t
A
t
S
( )/0
)
0(
)
transverse relaxation rate with blood iron concentration is proportional to the cerebral blood volume (i.e., the cerebral blood volume CBV(t) can be calculated from the slope of a plot of R2* change with [Fe]blood (Scheffler et al., 1999)).
[6]
Where R2*(t) is the transverse relaxation rate during activation or rest, R2*(0) is the
relaxation rate prior to injection of magnetite dextran, [Fe]blood(t) is the blood concentration
of Fe during the photic stimulation experiment, [Fe]blood(0) is the blood concentration of Fe
due to magnetite dextran prior to injection (i.e., zero) and K is a proportionality constant.
The fractional change in blood volume following photic stimulation, ∆CBV, can thus be calculated from the CBV during rest, CBV(r), and during activation, CBV(a), from Equation 8.
[7]
From Equation 1, this can be written in terms of the ratio of MR signal during photic stimulation and at rest.
[8]
)
(
)
0
(
]
[
)
(
]
[
)
0
(
*
)
(
*
22
K
CBV
t
Fe
t
Fe
R
t
R
blood blood⋅
=
−
−
%
100
*
)
(
*
)
(
*
)
(
)
(
ln
.
1
%
22
r
R
pre
43 R2* in brain was measured before injection of magnetite dextran, R2*(pre), and at regular
time points during the experiment, R2*(t). This value of R2*(t) was interpolated to the
actual time point of the photic stimulation measurement, R2*(r), to allow for changes in
R2* due to hepatic elimination of Fe (see Equation 2). The MR signal change, S(t),
following photic stimulation was fitted to the gamma-variate function described by Equation 5 (Figure III.2). S(r) was the value of the function at t <5 seconds and S(a) was the maximum value of the function (t= 48 seconds).
III.4 RESULTS
duration of the positive BOLD change (measured between the rise above 10% maximum signal change to the fall below 10% maximum) was 24 seconds (4-28 seconds after stimulus onset). Using intravenous magnetite dextran, there is a 13% negative MR signal change in the same area of primary visual cortex following photic stimulation. Maximum effect was seen at 48 seconds. The modulation in MR signal persisted for 88 seconds (20 – 108 seconds between the 10%-of-maximum points). The intravenous magnetite dextran increased the R2* (and R2) relaxation rates in resting gray matter. The change in transverse
relaxation rate of blood over time was measured in the same animal used for the fMRI study, and is presented in Figure III.3b. This shows an elimination T½ from blood of 198
minutes. The volume of distribution (instantaneous blood concentration divided by dose injected) was 825ml. The percentage change in regional cerebral blood volume in macaque primary visual cortex following photic stimulation was 32%.
III.5 DISCUSSION
Feridex (ferumoxide solution) is an aqueous colloid of magnetite iron oxide nanoparticles (60-150 nm diameter) associated with dextran having an average chemical composition of FeO1.44. Excretion of Feridex is 98% hepatic (its primary use in diagnostic imaging is as a
T2 liver contrast agent). In this study we have used it as a blood-pool contrast agent, taking
45
Functional MRI provides an indirect map of neuronal activation by demonstrating changes in cerebral blood dynamics that accompany neural activity. These temporally correlated changes may be seen as changes in blood flow (Kwong et al., 1992), blood volume (Belliveau et al., 1991) or changes in the deoxygenation of hemoglobin (Turner et al., 1993). Imaging the changes in blood volume is well established – the first fMRI descriptions of neuronal activity in humans mapped changes in CBV (Belliveau et al., 1991). For human studies, it has become more popular to use fMRI studies with endogenous contrast based on changes in the oxygenation of hemoglobin thus making the study entirely non-invasive. The use of iron oxide T2 contrast agents with a long
intravascular half-life has been shown to be a valid method to track CBV changes during neuronal stimulation in rats (Mandeville et al., 1998) and human subjects (Scheffler et al., 1999). The increase in transverse relaxation rate (∆R2* = 1/∆T2*) due to increased blood
volume competes with the decrease in relaxation rate due to changes in deoxyhemoglobin accompanying neuronal activation. It is necessary to use a sufficient intravascular concentration of contrast agent to ensure that the signal changes induced by the contrast agent and increased CBV dominate concurrent BOLD changes. At 1.5T these relaxivity changes due to hemoglobin susceptibility effects are relatively small, however the observed MR signal changes due to the T2 agent are less than the theoretical maximum, as these
competing effects reduce the magnitude of the MR signal change (Mandeville et al., 1998).
previous measurements of between 25% (Scheffler et al., 1999) and 32% (Belliveau et al., 1991) in human subjects. This concordance in CBV changes between human and macaque highlights a similarity in their neurovascular physiology which underscores the value of macaque fMRI as a model for better understanding human neurophysiology.
It is important to consider the decay in R2* over time due to hepatic elimination of contrast
medium as well as the R2* modulation due to changes in blood volume. The elimination
half-life of Feridex (198 mins) is of the same order of magnitude as the duration of many primate physiology studies. Closer inspection of the intravascular iron concentration during a typical 3.5 hour primate imaging session using a dose of 4.2 mgFe/kg (750 µMol/kg) shows it ranged from 36.75 µgFe/ml (659 µMol) instantaneously following injection to 19.5 µgFe/ml (350 µMol). Comparison with previous studies using the same T2 contrast
47 of 50 ms was initially set for maximum tissue contrast during BOLD studies, and was held constant during the study. Reducing the TE to the T2* of grey matter following magnetite
dextran infusion would further improve SNR and the CNR observed during magnetite-enhanced fMRI. Additionally, using other iron oxide agents with smaller particle size than Feridex (and a longer elimination half-life and higher T2 relaxivity characteristics
(Mandeville et al., 1997)) would further improve the signal benefit over conventional BOLD imaging.
In non-human primates, the temporal dynamics of the CBV changes are slower than the BOLD effect (similar to that described in rats (Mandeville et al., 1998)). This may place some constraints on paradigm design. For block design paradigms, the time-course of each state may need to be longer than the minimum times typically possible for BOLD studies; however, superposition calculations may be used to reduce this increase in experimental time. The use of event-related techniques (currently used in BOLD fMRI to observe temporal changes which are fast relative to the prolonged hemodynamic response (Dale, 1999)) can potentially be applied to CBV imaging as well. For most primate studies, the 3-fold increase in CNR (with theoretically further increase possible) outweighs many limitations that the slower return to baseline may place on the choice of paradigm. To achieve a comparable 3-fold increase in CNR using BOLD fMRI at 1.5T would require a 9-fold increase in experiment time or 3-fold increase in voxel size.
shorten total experimentation time. Motion artifact is the major difficulty in imaging awake behaving primates, and the ability to reduce the number of runs (and the overall length of an experiment) will have dramatic and positive benefits on experimental success. Non-human primate functional neuroanatomy has been used as a model for better understanding the human brain. The smaller brain size may equate to smaller functional units within the cortex for which higher resolution is required (although the exact scaling factor of functional units across species remains to be determined (Ahrens and Dubowitz, 2001)). The ability to achieve higher resolution in primate fMRI also adds to its utility when comparing with neurophysiology data.
The BOLD effect scales between linearly and quadratically with applied field strength (Gati et al., 1997). Thus high field imaging at 4.7 Tesla (Logothetis et al., 1999a) could be expected to afford at least a threefold increase in CNR. This theoretical gain needs to be offset by increased bulk-susceptibility artifacts at higher applied magnetic fields. Using magnetite-enhanced fMRI for primate imaging at 1.5T allows a comparable increase in CNR (with further CNR improvement anticipated with the use of alternate contrast agents), but without the increase in bulk susceptibility distortions induced by higher field. Similar improvements in resolution seen by increasing the applied field strength to 4.7T are thus achievable using magnetite-enhanced fMRI at 1.5T.
III.6 CONCLUSION
49 primates. Intravenous infusion of magnetite dextran nanoparticle T2 contrast agent
produces an 3-fold increase in CNR. Opportunities for further optimization are also discussed. Considerably faster overall experiments involving fewer sampling repetitions may now be performed, with the potential for higher resolution imaging compared with existing fMRI techniques at 1.5T. Regional cerebral blood volume increases by 32% in macaque visual cortex, which is comparable to the neuronally-induced vascular changes previously described in humans.
III.7 ACKNOWLEDGEMENT
Figure III.1
Coronal image showing functional activation in primary visual cortex (V1) during photic stimulation in a macaque monkey following intravenous T2 magnetite dextran contrast
51
Figure III.2
Figure III.3
53
Figure III.4
CHAPTER IV: Macaque Anatomical Imaging
IV.1 MICROWIRE PLACEMENT
A major facet of the use of anatomical MRI in a neuroscience setting is the planning of surgical procedures – specifically the guidance of electrode and recording chamber positioning. In cases typified by the following study, I was responsible for acquiring and analyzing all imaging data, formatting it for use in surgical planning, and working with the surgeons in determining the cortical areas of interest. This work was originally published under the title of “Magnetic resonance image-guided implantation of chronic recording electrodes in the macaque intraparietal sulcus” (Scherberger et al., 2003). Hans Scherberger and Igor Fineman served as the chief surgeons during these implantations, with the handler of the particular animal assisting. All electrode recording and analysis was performed by the handler of the monkey: Sam Musallam, Bijan Pesaran or Brian Corneil. Betty Gilliken was involved heavily with the design and set up of both the surgical theatre and procedures, and in several MRI recording sessions.
IV.1.1 Abstract
55 magnetic resonance (MR) imaging to determine stereotaxic coordinates of target location and sulcus orientation. Using this method in four animals, we recorded simultaneously the spiking activity and the local field potential from the parietal reach region (PRR), located in the medial bank of the intraparietal sulcus, while the animal performed a reach movement task. Fifty percent of all electrodes recorded spiking activity during the first two post-operative months, indicating their placement within cortical gray matter. Chronic neural activity was similar to standard single electrode recordings in PRR, as reported previously. These results indicate that this MR image-guided implantation technique can provide sufficient placement accuracy in cortical sulci and subcortical structures. Moreover, this technique may be useful for future cortical prosthesis applications in humans that require implants within sulci.
IV.1.2 Introduction
progress in computer technology and digital signal processing allowed analysis of neuronal population signals virtually in real time with a delay of only a few tenths of a second (Donoghue et al., 1998; Isaacs et al., 2000b; Kralik et al., 2001). Such rapid decoding of neuronal signals is essential for systems that will control an effector in real time, such as a motor neural prosthesis, which must allow instant interpretation of neural commands in order to effectively interface with a device such as a cursor on a computer screen or a robotic arm (Chapin et al., 1999; Wessberg et al., 2000; Serruya et al., 2002; Taylor et al., 2002).
57
Surgically, chronic electrode implantation is harder for areas located in the cortical sulcus than for areas on the cortical surface. For chronic recording from PRR, electrode arrays need to be implanted into the medial bank of the intraparietal sulcus (IPS) to a depth of 4-5 mm below the cortical surface (Fig. IV.1.1). To target PRR, we have developed a novel microwire electrode implantation technique that employs: magnetic resonance (MR) imaging for stereotaxic electrode placement, electrode arrays specifically designed for PRR, the use of alginate gel to protect the exposed cortex, and a neuro-anesthesia protocol that allows a procedure lengths of 8-10 hours. The improved accuracy of this technique allowed us to place a substantial number of recording electrodes into PRR. In the following, we describe the methods and recording results of four implanted animals.
IV.1.3 Methods
All surgical and animal care procedures were in accordance with the National Institute of Health guidelines and were approved by the California Institute of Technology Institutional Animal Care and Use Committee.
IV.1.3.1 Animal Training
Animals were habituated to sit in a primate chair with their heads fixed in front of a back-projected touch-sensitive screen. They were trained to fixate targets on the screen that were illuminated in red and to reach out and touch targets that were illuminated in green, while their eye position was monitored with an infrared video tracking system (Iscan Inc., Cambridge, MA, USA). Using this paradigm, animals performed a delayed center-out reach movement task, in which the animals first touched and fixated a central fixation position and, after a delay period, reached out and touched one of eight peripheral targets at a distance of 20° visual angle. A juice reward was given after each successfully completed trial.
IV.1.3.2 MR Imaging
59 (native resolution: 1.1x1.1x1.0 mm) (Pezaris and Dubowitz, 1999b; Dubowitz, 2002b). Post-acquisition image analysis was carried out using the AFNI software package (Cox, 1996b).
Coronal sections were evaluated, in 2 mm steps from 10 mm posterior to 10 mm anterior of stereotaxic zero, to determine the stereotaxic position and orientation of the IPS. Figure IV.1.2 shows an example of a coronal section (at 6 mm posterior) with the right IPS hitting the cortical surface at 9 mm lateral to the medial plane and at an inclination angle of 30°. In each coronal section, a possible electrode position was then determined, such that the entry point at the cortical surface was located 1–2 mm medial to the sulcus to prevent dimpling and the tip of the electrode targeted PRR 4.5 mm below the cortical surface within the medial bank of the IPS (white line).
IV.1.3.3 Electrode Arrays
IV.1.3.4 Electrode Implantation
IV.1.3.4a Anesthesia
Two days before surgery, the animal was started on anticonvulsants (phenytoin 3 mg/kg daily after 6 mg/kg initially) and oral antibiotics (ampicillin 14 mg/kg and clavulanic acid 2.8 mg/kg).
General anesthesia was induced using ketamine (10 mg/kg IM) and atropine (0.04 mg/kg SC) and maintained using isoflurane (1-2%) after endotrachial intubation. Heart rate, respiratory rate, ECG, non-invasive blood pressure, O2-saturation, expiratory CO2, and
rectal temperature were continuously monitored throughout the procedure. Venous blood gases were analyzed every 1-2 hours using a tabletop blood gas analyzer (I-STAT, East Windsor, NJ, USA). Fluids were continuously replaced through an IV line at the animal’s saphenous vein (lactate Ringer’s or saline solution at 50 ml/kg/hour). At the beginning of anesthesia, IM antibiotics (amoxicillin 22 mg/kg), steroids (dexamethasone 1 mg/kg), and analgesics (buprenorphene 0.01 mg/kg IM/ 8 hours) were administered. Additional drugs to control for blood pressure (atropine, dopamine), brain swelling (mannitol, flurosemide), and seizure activity (diazepam, phenytoin) were kept at hand. The animal was mechanically ventilated and moderately hyperventilated (end-tidal CO2 about 30 mmHg) to
61
IV.1.3.4b Procedure
The surgical procedure was performed under sterile conditions. After placing the animal in a stereotaxic head holder (David Kopf, Tununga, CA, USA), the existing head cap was removed to expose the skull overlying the parietal cortex. Using a pneumatic drill (Black Max, Anspach Inc., UK), a 2x4 cm hole was made in the skull over the posterior portion of the IPS based on stereotaxic positions from the MR image. The Dura was opened in a 2x5 mm patch determined from the MR images to lie over the most posterior part of medial bank of the IPS, just anterior to the parieto-occipital sulcus, (approximate stereotaxic coordinates: centered on 8 mm posterior, 5 mm lateral). To protect the cortical surface, the dural patch was elevated with a suture before being opened. The stereotaxic positions of the IPS in situ and in the MR images were then compared and in all cases found to be aligned within 2 mm in the axial plane.
To prevent CSF loss, the dural opening was covered with calcium alginate by dropping equal amounts of alginate (Pronova UP LVG: 20mg in 2ml sterile water; Pronova Biomedical, Norway) and calcium chloride solution (1M) on the exposed cortex, which formed a thin layer of protective gel (Becker et al., 2001).
Figure IV.1.3 shows an intra-operative view of the mounted array during insertion. The array was lowered to the cortical surface and then slowly inserted (0.2 mm/min) until the target depth was reached (4-4.5 mm below cortical surface). The cortical surface and the dura around the electrode were covered with a layer of dural replacement (DuraGen, Integra LifeSciences, Plainsboro, NJ, USA) and a layer of calcium alginate. The inserted array was then fixed to the skull and head cap using dental acrylic before the stereotaxic arm was disconnected from the array. By repeating this procedure, a second electrode array could also be inserted into the medial bank of the IPS. The remainder of the exposed dura was then covered with DuraGen, sealed with calcium alginate against CSF loss, and the skull defect closed with dental acrylic. All arrays were completely embedded in dental acrylic, except for the connector ends. Connectors were protected against dirt and impact by a connector plug and a removable plastic lid that was placed over the arrays and anchored in dental acrylic.
IV.1.3.4c Post-operative Care
63 completely from surgery (10-14 days) before experiments began.
IV.1.3.5 Recordings
Spiking activity and LFPs were recorded simultaneously from 32 electrodes using a multichannel acquisition processor (MAP, Plexon Inc., Dallas, TX, USA): single units were isolated online using time-voltage windows and their timing and spike waveforms stored on disk. LFP signals were amplified, low-pass filtered (90 Hz), and digitized as a continuous signal at a sampling rate of 1000 Hz.
IV.1.4 Results
Four animals (T, Z, S, C) were implanted with chronic electrode arrays using the surgical technique described above. After full recovery from the procedure, identifiable single unit spiking activity could be recorded from every implanted electrode array. Overall, 50% of all electrodes (T: 31%, Z: 53%, S: 60%, C: 50%) had identifiable spiking activity during the first two months after implantation, indicating that these electrodes were placed within the gray matter of the IPS. On any given experimental day, clearly identifiable spiking activity was recorded on average from 28% of all electrodes (T: 22%, Z: 25%, S: 35%, C: 32%).
electrodes in the two distant rows had almost no spiking activity. This suggests that these two arrays were only partially inserted into the gray matter of the medial bank of the IPS. In the five other arrays (S, C, and Z posterior), the distribution of electrodes with spiking activity did not show such patterning, suggesting that these arrays were more completely inserted into the target area.
The spiking activity of many units was modulated and showed spatial tuning during a delayed center-out reaching task to 8 peripheral locations (Fig. IV.1.5A). Figure IV.1.5B shows an example of nine simultaneously recorded single units that were spatially tuned. The spiking activity of these units show significant, and in some cases even dramatic, differences between reaches to the preferred and the non-preferred target direction, in accordance with previous studies of this area that used the standard single unit recording technique (Kalaska, 1996; Andersen et al., 1997; Snyder et al., 1997).
65
IV.1.5 Discussion
Using a novel approach to implant multiple electrode arrays with stereotaxic MR imaging guidance, we chronically inserted multiple microwire electrode arrays into the medial bank of the IPS 4-5 mm below the cortical surface with a minimal dural opening. Subsequent simultaneous recordings revealed identifiable spiking activity at about 50% of all implanted electrodes within the first two post-operative months. The pattern of active channels within most of the arrays suggested that the arrays were completely inserted within cortex (the lack of spiking activity on some electrodes being due to their distance from a particular cell rather than being outside of cortex). More generally, our method could be applied to microwire implantation in other brain structures, such as subcortical areas and other cortical sulci (Deadwyler et al., 1996; Nicolelis et al., 1997; Baker et al., 1999).
Key elements for the success of this method are the MR imaging guidance, the design of electrode arrays, particularly sharp electrode tips and an optimized array geometry, as well as the use of alginate gel to protect the exposed cortex against damage and to minimize brain shift associated with loss of cerebro-spinal fluid. In addition, a neuro-anesthesia protocol similar to human neurosurgical practice allowed us to safely extend the procedure to 8-10 hours. During the procedures the animals were intubated and blood gases, fluid balances, and electrolytes were carefully monitored and controlled (Logothetis et al., 1999b; Kralik et al., 2001).
animals are currently alive and part of ongoing studies. We are nonetheless convinced that the majority of electrodes are implanted in the proper target location (PRR) for the following reasons: First, Dubowitz (2002b) showed that the use of MR image-guided stereotaxic coordinates has an accuracy of 1.3±0.3 mm. Second, our technique involves the direct visualization of the IPS during surgery, which further improves the placement accuracy. Finally and most importantly, our recordings confirm physiologically that the electrodes are in the target area: spiking activity identifies 50% of all electrodes to lie in gray matter and many of those signals show significant directional tuning for reaching. Furthermore, we tested the neural activity in two animals (C, S) using both delayed saccade and delayed reach tasks and found the neural responses significantly larger for reach movements than for saccades, as expected for PRR (Snyder et al., 1998). While we are therefore confident that our electrodes are accurately placed in PRR, we nevertheless plan to develop a positive placement verification method, like post-surgical MR imaging, which will become important in particular for implantations in less explored brain areas.
IV.1.6 Neural Prosthesis
67 Nicolelis and colleagues implanted blunt microwires both in the rat and in new-world (owl) monkeys (Chapin et al., 1999; Nicolelis et al., 1999; Wessberg et al., 2000; Kralik et al., 2001), while Schwartz and colleagues implanted microwire arrays with sharp tips into the cortical surface of old-world monkeys (macaques) (Isaacs et al., 2000b; Taylor et al., 2002). Similar results were also found by Donoghue and colleagues using micro-machined silicon 100-electrode arrays (Bionics Inc, Utah, USA) that were pneumatically inserted into the macaque premotor and motor areas (Hatsopoulos et al., 1998; Serruya et al., 2002).
Our approach allows us to record reach-movement related spiking activity and the LFP simultaneously from many electrodes in PRR of old world monkeys, which is located within a cortical sulcus. This method could be advantageous in general for electrode implantation in primates with a high degree of encephalization, where a substantial amount of cortex is localized in cortical sulci, and for human implants, where the encephalization is even greater. We have used the signals from the array implants to successfully decode online the intended reach trajectories without the animals emitting any behavior. These results will be reported in a subsequent publication.
IV.1.7 Acknowledgement
Advanced Research Projects Agency, and the National Eye Institute.
IV.2 ELECTRODE LOCALIZATION
The production of imaging data for purposes of determining the specific area of a neruophysiological electrode recording accounted for the broadest experience at different MRI systems. Acquisition of data from different animals led to the use of no less than six different MRI magnets, ranging from a rather unique and somewhat outmoded 0.5 T mobile scanner housed in a semi trailer, to the current advanced 3 T whole body unit present at Caltech’s Moore facility. Similarly, constant advances in processing software continuously changed and expanded the methods available for visualization and presentation of the anatomical data. Truly, this opportunity provides a sound foundation for any further career in neuroimaging.
IV.2.1 Abstract
69 in conjunction with a 3D rendering technique.
IV.2.2 Introduction
For in vivo electrophysiology of the brain, the site of recording is as important as the recordings themselves. Classically, the location of electrode penetrations has been established by viewing histological preparations of the area in question, at times with the aid of a preinjected radioactive tracer. While providing accuracy limited only by the resolving power of microscopy, this technique required the sacrifice of the subject and an end to data acquisition. With the application of magnetic resonance imaging (MRI), the subject may now be spared while still maintaining a high level of resolution for localization. A single session can produce a three dimensional image of the whole head of a typical macaque at submillimeter resolution within minutes. Preparing the animal with general anesthesia ensures no gross motion will interfere with the quality of the scan. Care must be taken to limit the amount of magnetically susceptible metal involved in the recording apparatus involved in the animal’s implantations. Particularly, if any screws or posts are included, the use of a ceramic material or plastic will limit the distortion caused to the scan. If metal must be used, titanium is suggested as it causes a far smaller image artifact than a ferromagnetic material such as iron or steel.
the image volume to be orthogonal with a plane defined by the center of each inner ear canal and one or both inferior margins of the bony orbit (Reid’s plane.) This will put the image in an orientation common with stereotaxic coordinates. Zeroing the coordinate frame to the midpoint of the line defined by the two ear canal locations then allows measurements to be read off the image in an isometric fashion. This method has a drawback in that the axis of an electrode penetration rarely lies orthogonal to the stereotaxic positioning. While a point along the path of the electrode may be referenced in this manner, it is rarely used, in favor of positioning the images parallel to the long axis of the electrode or chamber.
To perform such an orientation, it is necessary to visualize the orientation of the chamber on the anatomical image. This presents a difficulty in that a plastic or other common chamber material will not appear on a MRI image. Fluid within the chamber may be discernable, but the volume may not be sufficient. Filling the chamber with a solution of a highly visible contrast agent, such as a gadolinium salt, will enable the easy visualization of this volume. Should axial orientation require aligning the image to a point other than the most anterior aspect of the chamber, additional references such as a MRI fiducial marker or specialized chamber plug may be used.