Article
Study of Microstructure and Mechanical Properties of
Commercially Pure Sn and Sn-4%Bi Alloys Fabricated
by Permanent Mold Gravity Casting and Forging
Chonnakan Thongchai
1,a, Boonrat Lohwongwatana
1,b,*, Chedtha Puncreobutr
1,
Atchara Khamkongkaeo
1, Thanawat Phetrattanarangsi
1, Burimpak Sakkomolsri
2,
Pinit Kidkhunthod
3, and Narong Chanlek
31 Innovative Metals Research Unit, Department of Metallurgical Engineering, Faculty of Engineering,
Chulalongkorn University, Bangkok 10330, Thailand
2 Department of Physics, Khon Kaen University, Khon Kaen 40002, Thailand 3 Synchrotron Light Research Institute, Nakhon Ratchasima 30000, Thailand
E-mail: a[email protected], b[email protected] (Corresponding author)
Abstract. The influences of 4 wt% bismuth addition and room temperature strain on
microstructure and mechanical properties in tin alloys were investigated in this study. Commercially pure tin and Sn-4%Bi alloys were fabricated by permanent mold gravity casting. The samples were then subjected to forging process at room temperature. As-cast microstructures were compared with 0.25 and 0.5 strained samples. Differential Scanning Calorimetry (DSC) was used to confirm the effect of bismuth on undercooling. The recrystallization and grain growth processes were confirmed by grain size distribution and misorientation study using Electron Backscattered Diffraction (EBSD). Furthermore, position and morphology of the bismuth precipitates were investigated by using Field Emission Scanning Electron Microscope (FESEM). X-ray Photoelectron Spectroscopy (XPS) revealed that tin oxide was the main species found on the surface of these alloys. There was no evidence of bismuth oxide on the surface. Furthermore, the Hall-Petch hardness approximation analysis revealed that there were other influences, which increased the hardness beyond the grain refinement effect.
Keywords: Tin, bismuth, forging, recrystallization, permanent mold casting, lapping plate.
ENGINEERING JOURNAL Volume 22 Issue 5
1.
Introduction
Sn-Bi alloys are widely used in many applications in electronics industry owing to their mechanical properties that match well with the needs in the areas such as lapidary, soldering, coating, etc. Along with Sn-Ag-Cu alloy systems for soldering applications, Sn-Bi alloys have also been considered as low-cost and environmentally friendly lead-free solders [1]. In one specific application in an electronic industry, Sn-Bi alloys are currently used as lapping plate material in hard disk drive manufacturing process. Such process subjects the read-write heads of hard disk drive to prolonged, intimate, and mechanically abrasive contacts to Sn-Bi alloys without altering the magnetism and read-write properties of the hard disk drive heads [2, 3]. Lapidary process is currently adopted throughout the electronic manufacturing industry in which smooth surface is required for aesthetic and/or engineering reasons.
With the melting point at 504.9 K, tin creeps at near-ambient temperature. It is well known that recrystallization temperature of Sn and many of its alloys are near or below room temperature. As most manufacturing processes are commonly carried out at room temperature, in which the mechanical properties of tin alloys become inevitably dynamic, detailed characterization of room-temperature effects on tin and its alloys are required.
In one particular example, Sn-Bi lapping plate is subjected to a process commonly known as diamond charging prior to mechanical lapping process. Slurry filled with micron level abrasive diamonds is poured on top of lapping plates while hard ceramic charging wheel drives the diamonds mechanically into the soft tin land-area. Microstructural evolution of lapping plate is therefore, one of the most important factor for effective diamond charging. Microstructural refinement of Sn alloys has therefore been central in Sn-alloys research during the past recent years. One of the effective ways to achieve microstructure refinement is the addition of alloying element(s). For example, the addition of Co in Sn-Ag-Cu solder results in a formation of intermetallic CoSn3 particles in molten alloy, which thereby act as nucleation sites for βSn grains [4]. Addition of Mn in Mg-Zn-Ca alloy will also cause grain refinement but the controlling mechanism related to constitutional undercooling [5]. Furthermore, there are other processes that can be effectively used to refine the final microstructure including increasing the rate of cooling or rapid quenching [6], severe plastic deformation [7], hot forging [8], etc. There are also many indirect factors that improve embedding of diamond in charging process such as rotational rate of ceramic ring which is used for driving diamond abrasives into lapping plate, rotational rate of lapping plate, as well as temperature during charging, etc.
Particularly for Sn-Bi alloy system, the bismuth solid solubility in tin is approximately 1-2 wt% Bi at room temperature. Such compositional range for Bi in tin was observed in the β-Sn phase found in eutectic microstructure. Insights of such tin alloy compositions and related mechanical properties are important to both solder application for stress-relieving purpose and lapidary application for restricted work hardening of lapping plate.
2.
Experimental Procedure
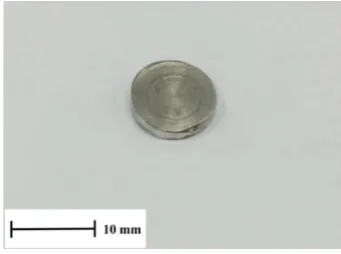
Commercially pure Sn (denoted as ‘pure Sn’) and Sn-4%wtBi alloy were prepared using induction melting. The actual chemical composition of each alloy was analyzed by X-ray fluorescence (XRF), and the results as shown in Table 1. Specimens were produced by permanent mold gravity casting in borosilicate glass crucible at 573K (300°C), following by slow cooling down in ambient atmosphere. In order to control the equivalent final dimension of forged samples which were subjected to various strains, each sample was casted to different initial dimensions: 10 mm diameter by 2 mm thickness, 8.7 mm diameter by 2.67 mm thickness, and 7 mm diameter by 4 mm thickness. The samples were prepared for both commercially pure Sn and Sn-4%wtBi alloy. After casting, 8.7 mm and 7 mm in diameter samples were forged in die as shown in Fig. 1. The final dimension of forged samples has 10 mm diameter and 2 mm in thickness as shown in Fig. 2. These two samples were labeled 0.25 and 0.5 strain samples respectively.
Table. 1. The composition of two alloys that use as raw material.
Raw material Weight percent
Sn Pb As Bi Cu Fe Ag Sb Zn Cd Al Commercially
pure Sn 99.918 0.032 0.006 0.018 0.006 0.005 <0.001 0.008 <0.001 <0.001 <0.001 Sn4%wtBi 95.83 0.021 <0.010 4.12 0.006 0.003 <0.001 0.005 <0.001 <0.001 <0.001
Fig. 1. Image of the actual die parts are shown on the left. Cross sectional schematic of assembled die parts is shown on the right with forged specimen (D).
Fig. 2. Example of forged sample.
[image:3.595.109.485.147.398.2] [image:3.595.211.382.446.573.2]on the surface that occur during casting and during storage were investigated by X-Ray Photoelectron Spectroscopy (XPS). Time spent for sample preparations was approximately 4 weeks.
3.
Results and Discussion
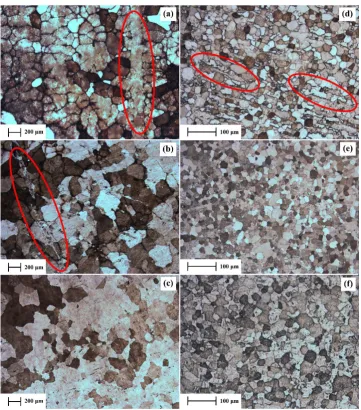
As-cast and the as-forged or strained microstructures of all samples are shown in Fig. 3. The grain size was analyzed by using ASTM standard with planimetic method [9]. For magnification 50X OM images of pure Sn samples, Jeffries’s Multiplier (𝑓) equals 0.5. For magnification 200X OM images of Sn-4%wtBi alloy samples, Jeffries’s Multiplier (𝑓) equals 8.0.
Fig. 3. Optical microstructure images of pure Sn (a, b, c) and Sn-4%wtBi alloy (d, e, f). As cast samples were indexed with (a) and (d). 0.25 strain samples were indexed with (b) and (e), finally 0.5 strain samples were indexed with (c) and (f).
[image:4.595.117.479.202.613.2]alloy. The grain size of as-cast Sn-4%wtBi alloy was found to be finer than pure Sn. The average grain sizes of as-cast pure Sn and Sn-4%wtBi alloy samples were 191 μm and 22 μm respectively.
It is well established that nucleation of β-Sn from Sn-base liquid alloys is generally difficult [12] since sufficient driving force (Gibbs free energy) is required to create high energy solid/liquid interface for a stable nuclei formation. This agrees well with the DSC result in this study, shown in Table 3, that undercooling of 17.3 K is required for pure Tin. In case of Sn-4%wt.Bi alloy, as the solid β-Sn interface advances the concentration of the rejected Bi element in the liquid adjoining the interface is increased and its local freezing temperature reduced. This effect is well known as constitutional undercooling. With this solute buildup ahead of solid/liquid interface, the total undercooling is further increased. This could be confirmed by DSC result shown in Table 3 where the undercooling of 25.9 K is required for the Sn-4%wt. Bi alloy. With this increased undercooling, the liquid has to cool further before the solidification could proceed and thus allow for additional driving force for the activation of other nuclei. This results in the increased rate of nucleation and the more grains would be expected in the final solidified microstructure.
Previous work also proposed a Growth Restriction Factor (GRF) which is a measure of the extent to which the advance of the solid interface into the adjoining liquid under the influence of a temperature gradient is limited by the increase in solute concentration in the area adjacent to the interface. K. Sweatman et al. [13] reported that addition of Bi could increase GRF in the Sn-based alloy.
According to Table 2, the grain sizes of 0.25 strain samples for both compositions were finer than that of as-cast samples. During a straining process at room temperature, a fraction of mechanical energy was stored in the forged specimen in the combinations of vacancy defects, interstitial defects, dislocations and stacking faults. However such stored energy of deformation is mainly stored in the form of dislocations. In our case, there were three main mechanisms driven by stored deformation energy: recrystallization, grain coarsening and recovery. Recrystallization [14] refers to a process to form a new grain following the formation, and migration of high angle grain boundaries. Recovery is defined [15] as all processes involving the release of energy outside the realm of high angle grain boundary movement, except for the case of mean grain size increase driven by reduction of grain boundary area and energy associated [16]. Because of the low recrystallization temperature of these alloys, recovery and dynamic recrystallization could occur [17] in addition to microstructural homogeneity of as-forged samples.
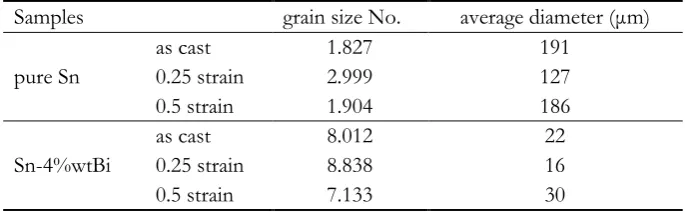
Table. 2. The grain size numbers and average grain sizes (μm) of the alloy samples at various strain.
Samples grain size No. average diameter (μm)
pure Sn
as cast 1.827 191
0.25 strain 2.999 127 0.5 strain 1.904 186
Sn-4%wtBi
as cast 8.012 22
0.25 strain 8.838 16
0.5 strain 7.133 30
For the case of pure Sn, the mean grain size was 191 micrometer as-cast, then reduced to 127 micrometers at 0.25 strain, and increased to 186 micrometers following 0.5 strain. For the case of Sn-4%wtBi, the mean grain size was 22 micrometers, reduced to 16 micrometers for 0.25 strain, then increased to 30 micrometers following 0.5 strain. It is well-known that the recrystallization temperature of pure tin is relatively low, therefore the samples should be carefully kept during sample preparation process. These grain size values lie within the range of previously reported values from the literature which confirmed that the samples were not completely recrystallized along the process. In order to understand the mechanism underlying the change of mean grain size, the distribution of high and low angle grain boundaries could shed more lights on the mechanisms involved.
[image:5.595.126.469.467.574.2]create also small strain-free volume. In the laboratory timescale of approximately 20 days, the microstructure of all 0.5 strain samples was already altered.
To investigate crystal structure and extent of alteration of these specimens, all samples were analyzed by using X-ray diffraction study, followed by EBSD analysis. The main crystal system was found to be tetragonal. Space group number and space group were 141 and I41/amd. Lattice parameter (a, b, c) were agreeable with 0.58332 nm, 0.58332 nm and 0.31820 nm respectively as reported in [20].
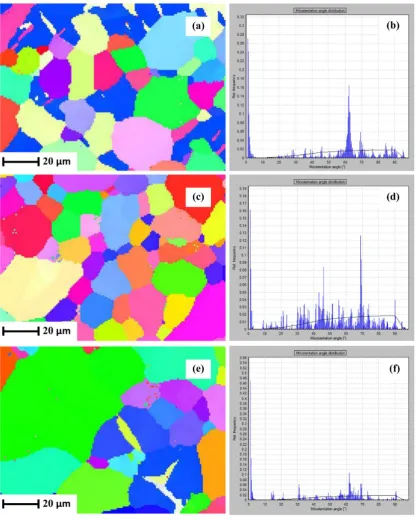
Orientation imaging microscopy (OIM) maps and misorientation angle distribution of as-cast, 0.25 strain and 0.5 strain of Sn-4%wtBi alloy sampleswere shown in Fig. 4. The as-cast distribution showed a degree of preferred orientation which may be contributed by the texturing effect of small-volume casting. When compared to as-cast microstructure, the reduction in size was reported in Fig. 4(c) at approximately 16-18 micrometers. Figure 4(d) indicated the broadening in misorientation angle distribution which resembled that of a random distribution such as the distribution simulations by Mason et al. [21] and Mishin et al. [22]. The reason for such random distribution remains inconclusive whether or not recrystallization was indeed taken place. Textured structure was not evident in the intermediate case of 0.25 strain. This may be because the recrystallization process does not generate preferred orientation if the pinning effect. As reported by Doherty et al. [15] when a primary phase represented a large volume fraction and a secondary phase particles could pin grain boundaries, recrystallization process does not always end in a preferred orientation.
As for the case of 0.5 strain samples, the mean grain size was increased while grain boundary misorientation distribution decreased significantly towards lower angles. Clusters of grains of similar shades are shown in Fig. 4(e) which suggest that new grains grow from many smaller regions already present in deformed microstructure. The result agrees with reported findings such as [23] and [24].
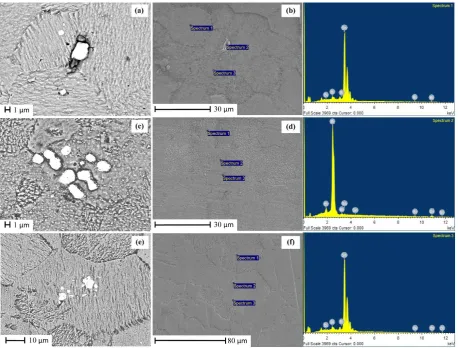
From the metallographic perspective, electron backscattered imaging in SEM/EDS was used to investigate the morphology and position of bismuth precipitates. The SEM/EDS images of Sn-4%wtBi alloy samples in Fig. 5 revealed the morphology of bismuth precipitates. The bright areas in SEM backscattering images were identified as bismuth precipitates. The gray area in SEM backscattering image was identified as
𝛽-Sn matrix. Bismuth precipitates of as cast and 0.25 strain samples were found along the grain boundaries (GBs). In the majority of as-cast samples, it was confirmed that Bi precipitated along the GBs after the solidification of 𝛽-Sn matrix. On the other hand, many Bi precipitates of 0.5 strain samples were found in the middle of grains, which can be linked to the grain growth following the recrystallization process as discussed earlier.
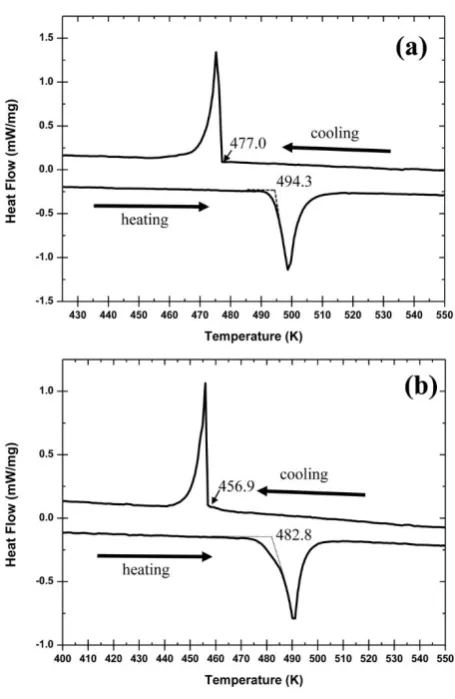
In order to investigate the effect of bismuth on undercooling, it is necessary that the two compositions of the Sn alloys be analyzed by using Differential Scanning Calorimetry (DSC). The DSC curves of heating and cooling processes were shown in Fig. 6. The increase in undercooling is usually indicated by the difference between the onset temperatures of heating process 𝑇𝑜𝑛𝑠𝑒𝑡(ℎ𝑒𝑎𝑡𝑖𝑛𝑔) and the onset temperatures of cooling process 𝑇𝑜𝑛𝑠𝑒𝑡(𝑐𝑜𝑜𝑙𝑖𝑛𝑔), as shown in Eq. (1). At any given temperature below melting point, nucleation is initiated by the driving force for solidification (∆𝐺𝑉), which would increase if undercooling increased. However, there is an interfacial energy (𝛾𝑆𝐿) which is a kinetic barrier for nucleation. Thus, Gibbs free energy of homogeneous nucleation is equal to negative term of driving force for solidification and positive term of kinetic barrier. Critical radius of nuclei which is large enough to be nucleation sites that could be estimated by the differential of Gibbs free energy. Equqation (2) represents the critical nuclei size (r*) which is a relative function of the latent heat of fusion (∆𝐻𝑠), the undercooling (∆𝑇), and the melting point (𝑇𝑚). Also, nucleation barrier energy (∆𝐺∗) equation could be obtained by substituting critical nuclei in Gibbs free energy equation. However, the nucleation, which usually occur in nature, is a heterogeneous nucleation. It always has other surface that can be a nucleation side such as container walls, impurity particles, grain boundary etc. As heterogeneous nucleation is also related to homogeneous nucleation, Gibb free energy of heterogeneous nucleation was estimated, as shown in Eq. (3). According to Eq. (2) and Eq. (3), the critical nuclei size and nucleation barrier would be decreased when (∆𝑇) is increased.
Fig. 6. The DSC curves show onset temperature during heating and cooling of (a) pure Sn and (b) Sn-4%wtBialloy samples.
Table. 3. The result of DSC analyzation.
Alloys 𝑇𝑜𝑛𝑠𝑒𝑡(ℎ𝑒𝑎𝑡𝑖𝑛𝑔) (K) 𝑇𝑜𝑛𝑠𝑒𝑡(𝑐𝑜𝑜𝑙𝑖𝑛𝑔) (K) undercooling (K) ∆𝐻𝑠 (j/g)
pure Sn 494.3 477.0 17.3 65.23
Sn-4%wtBi 482.8 456.9 25.9 64.77
∆𝑇 = 𝑇𝑜𝑛𝑠𝑒𝑡(ℎ𝑒𝑎𝑡𝑖𝑛𝑔) − 𝑇𝑜𝑛𝑠𝑒𝑡(𝑐𝑜𝑜𝑙𝑖𝑛𝑔) (1)
𝑟∗ = (2𝛾𝑆𝐿𝑇𝑚 ∆𝐻𝑠 )
1
∆𝑇 (2)
∆𝐺ℎ𝑒𝑡∗ = (16𝜋(𝛾𝑆𝐿)𝑇𝑚2 3(∆𝐻𝑠)2 )
1
(∆𝑇)2 𝑠(𝜃) (3)
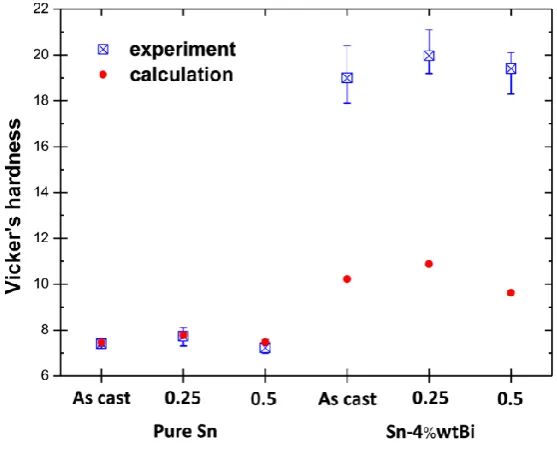
[image:9.595.181.409.76.426.2] [image:9.595.64.539.514.579.2]hardness values that were plotted from Hall-Petch relation, comparing to experimental hardness. It was shown that hardness of pure Sn samples followed the hardness projection using Hall-Petch relation. On the other hand, measured hardness of Sn-4%wt.Bi alloy samples was 45-50% higher than the hardness trend as suggested by Hall-Petch relationship. This suggests that grain boundary strengthening is not the only mechanism. In addition to the aforementioned mechanism, there are also the effects of solid solution strengthening and precipitation strengthening.
𝐻𝑣 = 𝐻0+ 𝑘
√𝑑 (4)
Fig. 7. Diagram shows Vicker’s hardness of pure Sn and Sn-4%wtBi alloy samples at different strain.
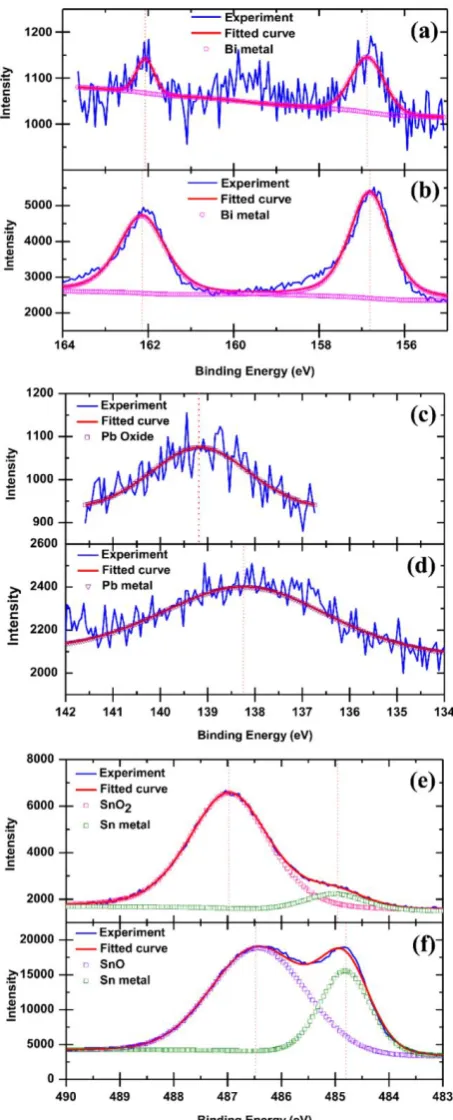
[image:10.595.181.408.171.393.2] [image:10.595.150.429.450.676.2]Fig. 9. XPS resultof Sn-4%wtBi alloy (a, b) Bi element, (c, d) Pb element and (e, f) Sn element as (a, c, e) non-polished sample and (b, d, f) polished sample.
[image:11.595.178.405.86.647.2]form bismuth oxide on the surface. Binding energies of Sn 3d5/2 in SnOand SnO2 are about 486.5 eV and 487.2 eV respectively [27, 28]. Binding energy of Bi 4f7/2 in Bi metal is about 157.0 eV [29]. XPS result of Pb is not obvious because of its low content. However, binding energy of Pb 4f7/2 in Pb oxide may assume that deviation from Pb metal is about 1.5 eV [30]. From the thermodynamic view point, Gibbs free energy for oxide formation of lead has a lower value than those of tin oxide and bismuth oxide.Aside from SnO2, after polishing, the surface of samples also revealed another species of tin oxide corresponding to SnO. This agrees well with the literature as SnO2 prefers to form at higher temperature near 573K (300°C) while SnO forms at room temperature [31].
4.
Conclusion
The microstructure and mechanical properties of pure Sn and Sn-4%wtBi alloy samples produced by permanent mold gravity casting and forging process were investigated. The addition of 4 wt% Bi into the Sn alloy showed grain refinement effect. Bi precipitates were found along grain boundaries for as-cast samples. At 0.25 strain, the deformation energy may not be enough for driving recrystallization at room temperature however, when the strain reaches 0.5, there were evidences for grain growth and clustering of grains of similar grain boundary misorientation angles. As a result, coarser microstructure was found for the case of 0.5 strain samples. For all cases, as grain sizes decreased, the hardness values increased, following the Hall-Petch relationship. However, in Sn-4%wt.Bi alloy the hardness values were also contributed by solid solution and precipitation strengthening mechanisms. SnO2 and Pb oxide were found on the surface of these alloys after casting process. Pb content remained however in just the trace level. After polishing, SnO was found on the surface as it could be formed at the room temperature. Bi oxide was not found.
Acknowledgements
The authors would like to acknowledge the financial support from Office of the Higher Education Commission. We thank the Synchrotron Light Research Institute (Public Organization), SUT-NANOTEC-SLRI XPS, Nakhon Ratchasima, Thailand for providing XPS facility and the Department of Physics, Khon Kaen University for XRD facility.
Reference
[1] B. L. Silva, G. Reinhart, H. Nguyen-Thi, N. Mangelinck-Noël, A. Garcia, and J. E. Spinelli, “Microstructural development and mechanical properties of a near-eutectic directionally solidified Sn– Bi solder alloy,” Materials Characterization, vol. 107, pp. 43-53, 2015.
[2] K. Dhanapal, V. Narayanan, and A. Stephen, “Influence of Sn on the magnetic ordering of Ni–Sn alloy synthesized using chemical reduction method,” Journal of Magnetism and Magnetic Materials, vol. 406, pp. 103-109, 2016.
[3] Y. Mitsui, K. Oikawa, K. Koyama, and K. Watanabe, “Thermodynamic assessment for the Bi–Mn binary phase diagram in high magnetic fields,” Journal of Alloys and Compounds, vol. 577, pp. 315-319, 2013.
[4] Z. L. Ma, S. A. Belyakov, and C. M. Gourlay, “Effects of cobalt on the nucleation and grain refinement of Sn-3Ag-0.5Cu solders,” Journal of Alloys and Compounds, vol. 682, pp. 326-337, 2016.
[5] D. H. Cho, J. H. Nam, B. W. Lee, K. M. Cho, and I. M. Park, “Effect of Mn addition on grain refinement of biodegradable Mg4Zn0.5Ca alloy,” Journal of Alloys and Compounds, vol. 676, pp. 461-468, 2016. [6] A. F. da Silveira, W. B. de Castro, B. A. Luciano, and C. S. Kiminami, “Microstructure of under-cooled
Sn–Bi and Al–Si alloys,” Materials Science and Engineering: A, vol. 375–377, pp. 473-478, 2004.
[7] R. Gupta, S. Srivastava, N. K. Kumar, and S. K. Panthi, “High leaded tin bronze processing during multi-directional forging: Effect on microstructure and mechanical properties,” Materials Science and Engineering: A, vol. 654, pp. 282-291, 2016.
[8] G. M. Castro Güiza and C. A. S. Oliveira, “Microstructural changes produced by hot forging in a C300 Maraging Steel,” Materials Science and Engineering: A, vol. 655, pp. 142-151, 2016.
[10] R. Mahmudi, A. R. Geranmayeh, S. R. Mahmoodi, and A. Khalatbari, “Room-temperature indentation creep of lead-free Sn-Bi solder alloys,” Journal of Materials Science: Materials in Electronics, vol. 18, pp. 1071-1078, 2007.
[11] T. B. Massalski, H. Okamoto, P. R. Subramanian, and L. Kacprzak, Binary Alloy Phase Diagrams, 2nd ed. Materials Park, OH, USA: ASM International, 1990, p. 512.
[12] D. Swenson, “The effects of suppressed beta tin nucleation on the microstructural evolution of lead-free solder joints,” Journal of Materials Science: Materials in Electronics, vol. 18, no. 1-3, pp. 39-54, 2007. [13] K. Sweatman, S. D. Mcdonald, M. Whitewick, T. Nishimura, and K. Nogita, “Grain refinement for
improved lead–Free solder joint reliability,” in IPC APEX EXPO Conference and Exhibition 2013, APEX EXPO 2013 - San Diego, CA, pp. 561-589.
[14] R. D. Doherty, G. Gottstein, J. R. Hirsch, W. B. Huttchinson, K. Lucke, E. Nes, and P. J. Wilbrandt, “Panel discussion on recrystallization texture,” in ICO-TOM8, TMS, Warrendale, PA, 1988. J.S. Kallend and G. Gottstein, Eds., p. 369.
[15] R. D. Doherty, D. A. Hughes, F. J. Humphreys, J. J. Jonas, D. Juul Jensen, M. E. Kassner, W. E. King, T. R. McNelley, H. J. McQueen, and A. D. Rollett, “Current issues in recrystallization: A review,” Materials Science and Engineering: A, vol. 238, pp. 219-274, 1997.
[16] J. W. Martin, R. D. Doherty, and B. Cantor, Stability of Microstructure in Metallic Systems, vol. 2. Cambridge: Cambridge University Press, 1997.
[17] X. Li, H. Sun, P. Zhang, and W. Fang, “The effect of strain on dynamic recrystallization of PM Ti-45Al-10Nb intermetallics during isothermal forging,” Intermetallics, vol. 55, pp. 90-94, 2014.
[18] J. Zhang, W. Li, and Z. Guo, “Static recrystallization and grain growth during annealing of an extruded Mg-Zn-Zr-Er magnesium alloy,” Journal of Magnesium and Alloys, vol. 1, pp. 31-38, 2013.
[19] A. H. Cottrell, Progress in Metal Physics. 1953.
[20] N. Arora and B. R. Jagirdar, “From (Au5Sn + AuSn) physical mixture to phase pure AuSn and Au5Sn intermetallic nanocrystals with tailored morphology: Digestive ripening assisted approach,” Phys Chem Chem Phys, vol. 16, pp. 11381-9, Jun. 2014.
[21] J. K. Mason and C. A. Schuh, “The Generalized Mackenzie Distribution: Disorientation angle distributions for arbitrary textures,” Acta Materialia, vol. 57, pp. 4186-4197, 2009.
[22] V. Y. G. O.V. Mishin, R. Z. Valiev, and G. Gottstein, “Grain boundary distribution and texture in ultrafine-grained copper produced by severe plastic deformation,” Scripta Materialia, vol. 35, pp. 873-878, 1996.
[23] Y. C. Lin, D.-G. He, M.-S. Chen, X.-M. Chen, C.-Y. Zhao, X. Ma, and Z. L. Long, “EBSD analysis of evolution of dynamic recrystallization grains and δ phase in a nickel-based superalloy during hot compressive deformation,” Materials & Design, vol. 97, pp. 13-24, 2016.
[24] M. Hatherly, “Recrystallization ’90,” in TMS. Warrendale, PA, 1990, p. 59.
[25] N. Hansen, “Hall–Petch relation and boundary strengthening,” Scripta Materialia, vol. 51, pp. 801-806, 2004.
[26] S. R. S. Serope Kalpakjian, Manufacturing, Engineering & Technology, 2006.
[27] M. Fondell, M. Gorgoi, M. Boman, and A. Lindblad, “An HAXPES study of Sn, SnS, SnO and SnO2,”
Journal of Electron Spectroscopy and Related Phenomena, vol. 195, pp. 195-199, 2014.
[28] D. A. Zatsepin, A. F. Zatsepin, D. W. Boukhvalov, E. Z. Kurmaev, and N. V. Gavrilov, “Sn-loss effect in a Sn-implanted a-SiO2 host-matrix after thermal annealing: A combined XPS, PL, and DFT study,”
Applied Surface Science, vol. 367, pp. 320-326, 2016.
[29] B. Oprea, T. Radu, and S. Simon, “XPS investigation of atomic environment changes on surface of B2O3–Bi2O3 glasses,” Journal of Non-Crystalline Solids, vol. 379, pp. 35-39, 2013.
[30] Z. Su, Q. Wang, J. Li, and G. Zhang, “Self-sacrifice Te template synthesis of new phase PbmSb2nTem+3nnanorods via Pb2+/Sb3+synergistic effect,” RSC Adv., vol. 5, pp. 105379-105392, 2015.