University of Southern Queensland
Faculty of Engineering and Surveying
EVALUATION OF ISSUES FOR SMALL AND MEDIUM-SIZED ENTERPRISES IN THE USE OF ADVANCED AND GREEN ENGINEERING
MATERIALS
A dissertation submitted by
Mr Christopher John Brockway Wright
NZDE (Civil)
In fulfilment of the requirements of
Bachelor of Engineering with Honours Majoring in Civil Engineering
i
ABSTRACT
ii
DISCLAIMER PAGE
The Council of the University of Southern Queensland, its Faculty of Health, Engineering & Sciences, and the staff of the University of Southern Queensland, do not accept any responsibility for the truth, accuracy or completeness of material contained within or associated with this dissertation.
Persons using all or any part of this material do so at their own risk, and not at the risk of the Council of the University of Southern Queensland, its Faculty of Health, Engineering & Sciences or the staff of the University of Southern Queensland.
iii
CANDIDATES CERTIFICA
TION
I certify that the ideas, designs and experimental work, results, analyses and conclusions set out in this dissertation are entirely my own effort, except where otherwise indicated and acknowledged.
I further certify that the work is original and has not been previously submitted for assessment in any other course or institution, except where specifically stated.
Christopher John Brockway Wright
Student Number: 0061035949
(Signature)
iv
ACKNOWLEDGEMENTS
First and foremost, I have to thank my research supervisor, Dr David Thorpe. Without his assistance throughout the process, this paper would never have been accomplished.
I would also like to show gratitude to my partner and parents for their support and council, and the respondents of the survey for taking the time to provide the data I required to undertake this research.
v
TABLE OF CONTENTS
CHAPTER 1 -! INTRODUCTION ... 2!
CHAPTER 2 -! LITERATURE REVIEW ... 4!
2.1.! Introduction ... 4!
2.2.! Small and Medium Enterprise ... 4!
2.3.! Advanced Materials ... 5!
2.4.! Green Materials ... 5!
2.5.! Issues for Small and Medium Enterprises ... 6!
2.5.1.! Growth!...!6! 2.5.2.! Cost!...!7! 2.5.3.! Identification!and!Evaluation!Methods!...!7! 2.5.4.! Experience!...!8! 2.5.5.! Lack!or!Inefficient!Industry!Standards!or!Codes!...!8! 2.5.6.! Inventory!Management!...!8!
2.6.! Evaluation Methods ... 9!
2.6.1.! Financial!Evaluation!...!9!
2.7.! Materials ... 12!
2.7.1.! Concrete!...!12!
2.7.2.! Earthen!Materials!...!16!
2.7.3.! Timber!...!18!
2.8.! Conclusion ... 20!
CHAPTER 3 -! RESEARCH DESIGN AND METHODOLOGY ... 21!
3.1.! Methodology ... 21!
3.2.! Survey ... 21!
3.2.1.! Formation!...!21!
3.2.2.! Ethical!Acceptance!...!22!
3.2.3.! Selection!of!firms!...!22!
3.2.4.! Distribution!...!23!
3.2.5.! Collection!...!24!
3.3.! Limitations ... 25!
CHAPTER 4 -! RESULTS ... 28!
4.1.! Survey Participants ... 28!
4.1.1.! Participants!Discipline!...!29!
4.1.2.! Participants!Location!...!30!
4.1.3.! Participants!Firm!Size!...!30!
4.1.4.! Participant!Discipline,!Size!and!Country!...!31!
4.1.5.! Participants!Use!of!AGEMs!...!33!
4.2.! Identification and Evaluation of AGEMS ... 34!
4.3.! SMEs issues with AGEMs ... 36!
4.3.1.! General!issues!with!AGEMs!for!SMEs!...!36!
4.3.2.! The!issues!with!AGEMs!previously!adopted!by!SMEs!...!37!
4.3.3.! The!issues!with!AGEMs!not!previously!adopted!by!SMEs!...!38!
4.4.! Responses for individual AGEMs ... 38!
4.4.1.! Individual!AGEMs!Issues!...!39! 4.4.2.! Discipline!using!individual!AGEMs!...!44! 4.4.3.! Distribution!of!SMEs!firm!size!using!individual!AGEMs!...!48! 4.4.4.! Awareness!length!of!Individual!AGEMs!...!50! 4.4.5.! SMEs!indication!for!future!use!of!AGEMs!...!52! 4.4.6.! Distribution!of!SMEs!location!for!AGEMs!...!55! 4.4.7.! Preference!for!used!individual!AGEMs!...!58! 4.4.8.! SMEs!typical!use!of!AGEMs!...!59!
vi
5.1.! Survey Participants ... 61!
5.2.! SMEs issues with AGEMs ... 64!
5.2.1.! General!issues!with!AGEMs!for!SMEs!...!64!
5.2.2.! The!issues!with!AGEMs!previously!adopted!by!SMEs!...!66!
5.2.3.! The!issues!with!AGEMs!not!previously!adopted!by!SMEs!...!70!
5.2.4.! Comparison!of!the!issues!identified!across!categories!...!72!
5.3.! Responses for individual AGEMs ... 75!
5.4.! Summary ... 79!
vii
LIST OF FIGURES
Figure 4-1: Discipline distribution from participating SMEs responses ... 29!
Figure 4-2: Location distribution of participating SMEs ... 30!
Figure 4-3: Size distribution of participating SMEs ... 31!
Figure 4-4: Architect, firm size and country responses ... 32!
Figure 4-5: Engineer, firm size and country responses ... 32!
Figure 4-6: Contractor, firm size and country responses ... 33!
Figure 4-7: Frequency of AGEM use by SMEs ... 33!
Figure 4-8: Frequency of use for previously used AGEMs ... 34!
Figure 4-9: Frequency of use for previously unused AGEMs ... 34!
Figure 4-10: Survey results for general issues with use of AGEMs by SMEs ... 37!
Figure 4-11: Survey results of issues with AGEMs previously adopted by SMEs ... 37!
Figure 4-12: Survey results of issues with previous unused AGEMs ... 38!
Figure 4-13: Issues for SME with used AGEMs ... 41!
Figure 4-14: Issues for SME with previously unused AGEMs ... 43!
Figure 4-15: Distribution of SMEs discipline for previously used AGEMs ... 46!
Figure 4-16: Distribution of SMEs discipline for previously unused AGEMs ... 47!
Figure 4-17: Distribution of firm size responding for used AGEMs ... 49!
Figure 4-18: Distribution of firm size responding for previously unused AGEMs ... 50!
Figure 4-19: Length of awareness for previously used AGEMs ... 51!
Figure 4-20: Length of awareness for previously unused AGEMs ... 52!
Figure 4-21: Comparison of length of awareness ... 52!
Figure 4-22: Indication of future use for previously used AGEMs ... 54!
Figure 4-23: Indication of future use for previously unused AGEMs ... 55!
Figure 4-24: Location of responses for previously used AGEMs ... 56!
Figure 4-25: Location of responses for previously unused AGEMs ... 57!
Figure 4-26: SMEs preference of previously used AGEMs ... 59!
Figure 4-27: Typical use for previously used AGEMs ... 60!
viii
LIST OF TABLES
Table 2-1: PB Example ... 11!
Table 2-2: NVP Example ... 11!
Table 2-3: IRR Example ... 12!
Table 3-1: Firms identified by discipline and country ... 23!
Table 3-2: Firms invited to participate by discipline and country ... 23!
Table 3-3: Percentage of Firms invited by discipline and country ... 23!
Table 4-1: Response location and discipline ... 28!
Table 4-2: Percentage of response location and discipline ... 29!
Table 4-3: Results for Methods of Identification and Evaluation ... 35!
Table 4-4: Ranked and number of issues with previously used AGEMs ... 41!
Table 4-5: Ranked and number of issues for previously unused AGEMs ... 44!
Table 5-1 Comparison of issue for familiarity categories ... 73!
Table 5-2: List of individually examined AGEMs ... 76!
ix
LIST OF APPENDICES
x
NOMENCLATURE AND ACR
ONYMS
(OR ABBREVIATIONS)
The following abbreviations have been used throughout the text and bibliography: -
AAI Average Age of Inventory
ACP Average Collection Period
AGEM Advanced and Green Engineering Material
CEB Compressed Earth Block
CLT Cross Laminated Timber
DSCC Ductile Self Compacting Concrete
EOQ Economic Order Quantity
ERP Enterprise Resource Planning
FA Fly Ash
FRP Fibre Reinforced Polymers
FV Future Value
GGBFS Ground Granular Blast Furnace Slag
Glulam Glued-Laminated Timber
Glubam Glued-Laminated Bamboo
HREC Human Research Ethics Committee
IAQ Indoor Air Quality
IRR Internal Rate of Return
JIT Just-In-Time
LCA Life Cycle Assessment
LCC Life Cycle Cost
LVL Laminated Veneer Lumber
MIRHA Microwave Incinerated Rice Husk Ash
MRP Materials Requirement Planning
MRP II Manufacturing Resource Planning II
NPV Net Present Value
NSM Near-Surface Mounted
NS Net Savings
OC Operation Cycle
PB Payback Period
PIS Participant Information Sheet
POFA Palm Oil Fuel Ash
PV Present Value
SDA Sawdust Ash
SF Silica Fume
SIR Savings-to-Investment Ratio
SME Small and Medium-sized Enterprise.
USQ University of Southern Queensland
WACC Weight Average Cost of Capital
CHAPTER 1 - INTRODUCTION
1.
Problem Statement
This research is to evaluate issues for Small and Medium Enterprise’s (SME) in the use of advanced and green engineering materials (AGEMs). The research, design and innovation involved in creating advanced and green materials can take sizable resources and investment to develop. SMEs play a large part in the construction market and therefore their adoption of new materials can be crucial to the success of advanced and green engineering material products.
2.
Background
Universities, and other developers and manufactures of advanced and green engineering materials, can benefit from the knowledge of issues perceived by SME’s with the selection and use of their product. The research has been initiated to identify issues affecting SMEs demand for AGEMs currently developed by USQ. USQs Centre of Excellence in Engineering Fibre Composites (CEEFC) which is “one of the key research centre in Australia” is thought to be a possible beneficiary of the knowledge that can be gained through this research.
3.
Objectives
• To undertake a survey of SMEs to identify their perceived issues in the use of
AGEMs.
• To evaluate the issues for SMEs in the use of AGEMs.
• To provide a comprehensive list of the main findings so that manufacturers
can improve their marketing, communication and delivery of advanced and green material products.
4.
Potential Implications and Consequential Effects of this Project
The University of Southern Queensland’s Human Research Ethics Committee (HREC) was consulted in regards to the survey that, once approved, was dispersed to SMEs as part of this research project. The acceptance ensured that the survey had considered ethical requirements for human research, and any risks were identified and mitigated.
For privacy of the surveyed companies, their company names will not be included in the report. Instead, they will be referred to by their discipline, for example ‘architect’.
5.
Resources Requirement
This research was constrained by the time taken to receive acceptance from USQ’s HREC and for the invited firms to respond to the survey, and the tool used to distribute and collect survey results.
CHAPTER 2 - LITERATURE REVIEW
2.1.
Introduction
AGEMs are developed to extend the boundaries of conventional materials and help in the provision of an environment that can be enjoyed by future generations. The research, design and innovation involved in creating AGEMs can take sizable resources and investment to develop.
Small and medium-sized enterprises (SME) play a large part in the construction market and therefore their adoption of new materials can be crucial to the success of advanced and green engineering material products.
The aim of evaluating issues for SMEs in the use of AGEMs is to produce a comprehensive list of the perceived issues with these materials. This research could provide manufacturers with the information required to improve their marketing, communication and delivery of advanced and green material products.
2.2.
Small and Medium Enterprise
Small and medium-sized enterprises (SME) are distinguished from larger firms by the number of staff employed and legal forms of business.
SME classifications have different thresholds around the world. In New Zealand firms with up 20 employees, and in Australia firms with less than 200 employees are considered to be SME. SMEs account for 97.2% (Ministry of Business, Innovation & Employment, 2014) and 95% (SME Association of Australia, 2014) of all enterprises in New Zealand and Australia respectively.
and owners benefit from the limited liability to the extent of their investment into the firm (Brooks, 2010).
2.3.
Advanced Materials
Advanced materials are an improvement on conventional materials. They are developed to enhance strengths, or mitigate weaknesses of conventional materials.
Post-tensioned timber combines timber’s flexibility, aesthetic and environmentally friendly properties, with the ductile properties of steel to improve the ductility and strength of timber (Symons, 2014). Ductile self-compacting concrete (DSCC) minimises the need for skilled labour as levelling and compaction occurs under self-weight. (Nuruddin, Chang, & Azmee, 2014)
New Zealand company XLam Ltd (Symons, 2014), is manufacturing an advanced heavy timber material, cross-laminated timber (CLT). This product has a large demand in Europe, and XLam anticipate entering the Australasian market. Manufactures such as Xlam face challenges in introducing new materials, as engineers, architects, quantity surveyors and clients tend to be conservative in the adoption of relatively unknown products.
2.4.
Green Materials
Green materials are an alternative to conventional materials. They can contain recycled and nontoxic material, and can provide a more energy efficient alternative to conventional materials. Green materials fit into six identifiable categories: green process; improved sustainability; recycled content; recyclability; low toxicity; and biodegradable (RSMeans, 2002, pp. 232-234).
The perception of green material can impact adoption. The use of the term ‘green’ often leads to perception of low-tech, uncontrolled and unprofitable to SMEs. With some manufacturers reluctant to advertise the use of green processes for fear of prejudice (Spiegel & Meadows, 1999).
There are few standards and guidelines for the ‘greenness’ of green materials, with those that are available being performance rather than prescriptive (Spiegel & Meadows, 1999). Standards and guidelines are used heavily in the construction industry as a means to demonstrate work is satisfactory. Green materials can suffer from requirements to use the standards of the conventional materials they are replacing, as well as a green standard, e.g., LEED, Energy Star, BREEAM, and ISCA, to demonstrate the greenness of the material.
2.5.
Issues for Small and Medium Enterprises
The research of literature found no articles specifically relating to the ‘issues for SMEs in the use of advanced and green materials’. The issues found focused on either businesses or materials.
SMEs are generally younger (Abdullah & Manan, 2011) and likely to be in experiencing higher growth than larger mature firms. Issues for SMEs in the use of AGEMs include the growth of the firm and the community, the cost of materials, experience, inefficient standards or codes, methods used for investigation and evaluation and compatibility with inventory management practises.
Materials issues are unique to the material. Materials are discussed in Section 2.3. The common issues include material properties, the perception, environmental impact and the selection of materials available.
2.5.1. Growth
Firms raise capital to fund projects through short and long term (equity and debt) financing. Short term and debt financing requires the firm to pay interest on the capital raised or borrowed and repay the amount in the future. Equity financing sells a share of the firm to the investor. For a firm to repay the financing required to fund project, it seeks growth by earning a net profit on the projects undertaken. The profit is then used to payback capital borrowed and increase the wealth of shareholders to the company (Gitman, Juchau, & Flanagan, 2008).
The construction industry is responsible for the provision if infrastructure to facilitate population growth. The construction industry is one of the largest and most active sectors throughout the world. In Europe annual turnover of 1200 billion Euros, with 52% market share of exports result from the construction industry. China will need 40 billion square meters of residential and commercial floor space over the next 20 years (Pacheco-Torgal & Jalali, 2012).
2.5.2. Cost
SME have less access to capital. Investigation and evaluation of materials increase the cost. Cost is the easiest component of a material to be evaluated. The intangibility of some benefits can lead to current cost constraints can outweigh the future benefits of materials.
AGEMs tend to be more expensive by face value. Conventional 30 MPa concrete tends to cost less than 30 MPa lightweight concrete (Simons, 2012). The percentage increase in price between conventional materials and advanced and green materials is called a premium. The premium is to cover externalities, compensate for research and development or specialist knowledge and labour required. Externalities can include improved future sustainability. Forestry operations have the choice when producing timber whether to manage the resource sustainably. Sustainable management in a ‘price taking’ environment leads to less profit for forestry. (Mankiw, 2009)
2.5.3. Identification and Evaluation Methods
the cost of identification and evaluation by using familiar materials. Excluding some advanced and green materials due to lack of experience.
Evaluation methods include the use of financial tools. Financial tools are affected by premiums. The premium increases the cost and risk. Higher returns are required by firms to justify increasing risk levels.
2.5.4. Experience
The construction industry relies on previous experiences to guide future decisions. SME have less access to experts. When uncertainty exists the industry can rely on expert opinion. Advanced and green materials carry more risk to SME with less experience.
The risk of using advanced and green materials by less experienced firm’s increases the risk premium used in their evaluation.
2.5.5. Lack or Inefficient Industry Standards or Codes
The construction industry relies on standards and codes to justify decisions. There is a general lack of standards and codes for environmentally effectiveness of green materials (Spiegel & Meadows, 1999). Advanced and green materials suffer from poor coverage in standards and codes when there is need for further research on the material.
The structurally properties for advanced and green materials are determined use of codes. Materials until thorough research is undertaken on material properties, insufficient standards and codes can lead to under or over design of structures.
2.5.6. Inventory Management
2.6.
Evaluation Methods
Aesthetical, financial and ethical considerations affect evaluation methods. Materials have different properties; though can perform the same task. Aesthetics is subjective, the client or designer likes the material or they do not. Aesthetics eliminates materials in the selection process. Financial evaluation methods are used to select the most economical from the alternatives. Ethical evaluation is challenging. Ethical evaluation can include externalities. Externalities are challenging to evaluate and quantify. Externalities are unsolicited effects to others by firm’s decisions. Positive externality of using green material is improved air quality. Negative externality of using concrete is the green house gases created in the production. (Spiegel & Meadows, 1999; Brooks, 2010; Mankiw, 2009)
2.6.1. Financial Evaluation
Financial evaluation considers the costs to firms (Brooks, 2010; Gitman, Juchau, & Flanagan, 2008). Principles of time value of money, or more straightforward comparison are used. Time value of money works on the basis that money is more valuable today than in the future. To compare like for like, cash flows must be discounted to present value (PV) or compounded to future value (FV).
Financial evaluation although the easiest to quantify can be challenging for SME. The determination of risk to the firm and project affects the quality of results.
There are many methods of financial evaluation used by firms. Commonly used methods, discussed below, include payback period (PB), net present value (NPV) and internal rate of return (IRR).
2.6.1.1. Discounting/ Compounding
To compare financial options cash flows must be compared in the same time period.
Discounting is used to determine the PV future cash flows. For example if FV =
$1.04, i = 4% and n=1, then PV = 1.04*(1+ 4/100)-1 = 1. Compounding is used to find
the FV of cash flows. (Gitman, Juchau, & Flanagan, 2008)
Rate of return represents the risk of the cash flow. Firms commonly use weight average cost of capital (WACC) as the required rate of return. WACC represents the risk market places on the firm. (Brooks, 2010)
2.6.1.2. Payback Period (PB)
Payback period is a straightforward method of financial evaluation. Payback period determines the time taken to recoup investment. Payback period works on the principle that the projects that recoup investment quick are better. The material with the shortest PB is selected, provided the length of PB is less that maximum period decided my management of the firm.
PB fails to consider the time value of money. Any cash flows earnt after the payback period are neglected. This can lead to selection of options that appear less than optimum using NPV and IRR.
An example of PB is shown in Table 2-1, is used to demonstrate the PB of $1.00 investment with $0.33 cash flows for the next four years. PB will be three years. (Brooks, 2010)
PV=FV∗ 1+i/100 !!
(EQ.1-1)
FV= PV∗ 1+i/100 !
(EQ.1-2)
Where: i= rate!of!return!(%)
Table 2-1: PB Example
Cash
Flow Amount Cumulative
CF0 ($1.00) ($1.00)
CF1 $0.33 ($0.67)
CF2 $0.33 ($0.33)
CF3 $0.33 $0.00
CF4 $0.33 $0.33
2.6.1.3. Net Present Value (NPV)
NPV is the sum of all cash flows discounted to PV. NPV uses the principle of time value of money. Positive NPV mean the project will return more money than in costs, negative NPV indicates expected loss. Discount rate is typically the WACC for a firm. Using the WACC is beneficial to determine if the selection will increase the wealth of the firm.
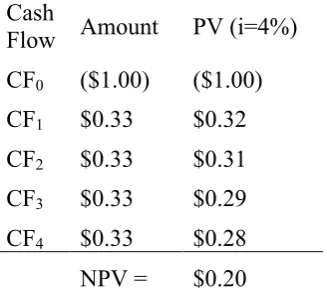
[image:21.595.110.274.523.670.2]An example of NPV is shown in Table 2-2, is used to demonstrate the NVP of $1.00 investment with $0.33 cash flows for the next four years, i of 4%. NPV=$0.20 with the current cash flow over the four years. (Brooks, 2010)
Table 2-2: NVP Example
Cash
Flow Amount PV (i=4%)
CF0 ($1.00) ($1.00)
CF1 $0.33 $0.32
CF2 $0.33 $0.31
CF3 $0.33 $0.29
CF4 $0.33 $0.28
NPV = $0.20
2.6.1.4. Internal Rate of Return (IRR)
WACC. Projects are accepted if the IRR is greater than the WACC. IRR greater to WACC means the firm will earn more than it costs to undertake the option evaluated.
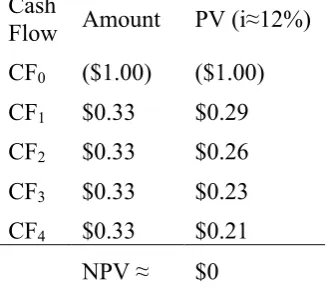
[image:22.595.109.273.262.406.2]An example of NPV is shown in Table 2-3, is used to demonstrate the NVP of $1.00 investment with $0.33 cash flows for the next four years, WACC of 4%, IRR of approximately 12%. As the IRR is greater than the WACC the firm would expect to make ≈8% on the option evaluated.
Table 2-3: IRR Example
Cash
Flow Amount PV (i≈12%)
CF0 ($1.00) ($1.00)
CF1 $0.33 $0.29
CF2 $0.33 $0.26
CF3 $0.33 $0.23
CF4 $0.33 $0.21
NPV ≈ $0
2.7.
Materials
Concrete is the most commonly used construction material in the world, and there are numerous advanced concrete materials (Nuruddin, Chang, & Azmee, 2014). Earthen is one of the oldest materials, a large proportion of the world’s population live in earthen buildings. The collection and then return of earthen material to the earth promotes it as a green material. Timber products benefit from high strength to weight ratio, “visual and tactile attractiveness, high energy efficiency, quick erection time and a low carbon footprint” (Werther, et al., 2012).
2.7.1. Concrete
Cement undergoes hydrolysis to act as a binder. Concrete strength is dependent on the cement-water ratio of concrete. Cement production is a major emitter of green house gases due to the energy demand to crush and fire limestone.
Improvements in technology over the past 20 years have resulted in the development of advanced and green concrete (Naik, Kumar, Ramme, & Canpolat, 2012). Ductile self-compacting concrete (DSCC), high strength concrete, light weight concrete, fibre reinforced concrete and concretes utilising cement replacement materials are discussed below.
2.7.1.1. Ductile Self Compacting Concrete (DSCC)
DSCC reduces the need for skilled labour in the construction of concrete structures. Compaction and levelling of conventional concrete is crucial to achieve concrete strength. DSCC compacts under the materials self weight, and spreads into every corner of the formwork.
DSCC can suffer from blockage of the aggregates when pouring into heavily reinforced sections. There is more investigation and testing required when using DSCC due to low tolerances. A 1% increase in water content has a noticeable effect in the performance of the DSCC. (Naik, Kumar, Ramme, & Canpolat, 2012)
2.7.1.2. High Strength Concrete
High strength concrete uses admixtures to increase the concrete strength (!!!). Increase
in concrete strength results in lower cost to clients due to reduced section sizes. (Nuruddin, Chang, & Azmee, 2014)
An increase in concrete flexural capacity (!!) is directly proportional to increases in
concrete strength (!!!) refer to EQ.2-1 (AS 3600:2009). Increased flexural capacity
allows for a reduction in the section size of concrete member, subsequently lowering
the design load on supporting members and decreasing the design moment (!∗).
M!= α!∗f!!∗γ∗d∗b∗ d−
γd!
2 (EQ.1-3)
M∗ ≤ ϕM
! (EQ.1-4)
Concrete brittleness increases with strength; due to this advanced concretes have been developed. Conventional concrete has low tensile strength and experiences brittle failure. High strength concrete is shown to benefit from fibre reinforcement to address these deficiencies.
2.7.1.3. Lightweight Concrete
Lightweight concrete is created using lightweight aggregate or aerated concrete. The use of lightweight concrete reduces the deadweight in a structure. Lower dead weights require smaller section sizes and consequently reduce the quantity of material required to carry the loads (Green, Brooke, & McSaveney , 2008).
Lightweight concrete can suffer shrinkage problems due to the porosity of its aggregates. Lower density lightweight aggregates are weaker than conventional aggregate; AS 3600:2009 Concrete Structures and NZS 3101:2006 Concrete Structures, provide coefficients for the design of lightweight concrete using conventional concrete calculations.
2.7.1.4. Fibre Reinforcement
Concrete fibre reinforced by the addition of short discontinuous metallic, non-metallic or hybrid fibres primarily controls the propagation of cracks and limits the crack width (Sivakumar & Santhanam, 2007). Fibre provides ductility and reduces the brittleness of concrete, by acting as a bridge between adjacent surfaces of existing micro-cracks.
Non-metallic fibres can be glass, synthetic or organic fibres. Non-metallic fibres reduce the micro cracks in concrete but do not provide any noticeable gain in the flexural strength of concrete.
Hybrid fibre reinforcement is a combination of metallic and non-metallic fibres. Hybrid fibre reinforcing has been found to perform better in all aspects than metallic fibre alone, except flexural toughness. To achieve enhanced flexural toughness the mix of metallic to non-metallic fibres need to be selected carefully. (Sivakumar & Santhanam, 2007)
2.7.1.5. Cement replacement materials
Cement replacement materials replace a portion of the cement content in concrete (Massazza, 1993). Cement replacement materials are pozzolanic. Pozzolanas are a material that contains siliceous or siliceous and aluminous material by composition. Pozzolanic materials alone provide little or no cementing property but can provide cementing property when combined with calcium hydroxide due to a chemical reaction between silica and calcium hydroxide.
Cement replacement materials have been investigated as a way to reduce the volume of cement required while still achieving the desired structural capacity.
The pozzolanas identified below include fly ash (FA), microwave incinerated rice husk ash (MIRHA), silica fume (SF), sawdust ash (SDA), ground granular blast furnace slag (GGBFS) and palm oil fuel ash (POFA). These materials are recycled waste products from manufacturing plants (Nuruddin, Chang, & Azmee, 2014; Naik, Kumar, Ramme, & Canpolat, 2012; Elinwa & Mahmood, 2002; Dehuai & Zhaoyuan, 1997; Tangchirapat, Saeting, Jaturapitakkul, Kiattikomol, & Siripanichgorn, 2007).
MIRHA is a manufactured by controlled microwave burning of rice husks. MIRHA improves the strength and reduces the porosity of concrete.
SF is a by-product of alloy production in arc furnaces. SF consists of ultra fine particles, which fill voids present in conventional concrete and provide higher bond strength between cement paste and aggregates.
SDA is a by-product from the timber industry. SDA enhances the performance of concrete in respect to setting time, workability and compressive strength.
GGBFS is a bi-product of iron production from ore. The use of GGBFS is contributed to higher strength gains of concrete allowing high early strength, which is noticed to maintain higher strength than conventional concrete.
POFA is a by-product from the palm oil industry. It is predominantly disposed of in landfills leading to environmental concerns. POFA improves the sulphate resistance of concrete.
2.7.2. Earthen Materials
Earthen materials (Miccoli, Müller , & Fontana, 2014) are one of the oldest materials in use today. There is evidence of earthen buildings lasting hundreds of years. Earth used in earthen materials is not considered renewable. The materials are predominantly extracted from the building site during earthworks. This differs from other building materials such as steel where metal ore and other materials are extracted from the earth, processed and then delivered to site. Earthen materials can be stabilised with lime to enhance its properties. Commonly used earthen materials are adobe bricks, rammed earth and cob.
2.7.2.1. Adobe brick
Adobe bricks are created by air-drying earthen material in a mould. Adobe bricks are also referred to as ‘earth block’, ‘mud brick’, ‘sun baked brick’ and ‘unfired brick’. Adobe bricks are used throughout the world. The earthen materials required to manufacture adobe bricks are obtainable in most countries. The typical compressive strength of adobe brick is in the order of 1.0-5.0 MPa (Miccoli, Müller , & Fontana, 2014).
Adobe brick is a modular construction method, unlike rammed earth and cob, which are monolithic. There have been few improvements to adobe brick since prehistoric times. Strength improvements have been achieved through compressed earth blocks (CEB), reinforcement with straw and stabilisation with lime.
2.7.2.2. Rammed Earth
Rammed earth is created in-situ using formwork to restrain the earth as it is compacted. Compaction of earth in rammed earth walls is undertaken in lifts. Lifts are the term for layers of material. The compacting the layers in lifts allows full compaction of the material.
Compressive strength of rammed earth is dependent on many factors: soil properties, moisture content, compaction, fibre content and additives. The use of fibre is rare. The typical compressive strength of unstabilised rammed earth is 1.5-4.5 MPa. The monolithic nature of rammed earth is advantageous in seismic regions. (Miccoli, Müller , & Fontana, 2014)
2.7.2.3. Cob
Cob has lower compressive strength than the previous earthen materials, in the range of 0.5-1.5 MPa. The fibre content of cob enhances the shear capability and enhances ductility of the material. Cob can undergo elastic deformations. The fibrous content of cob is organic in nature and can putrefy if water is allowed to infiltrate the material. (Miccoli, Müller , & Fontana, 2014)
2.7.3. Timber
Timber is an engineering material created from wood. Currently there is an increasing demand around the world for timber as a construction material. Timber and wood products are a renewable resource, when managed sustainably. The material properties of timber have high variability including variations in moisture content, density and modulus of elasticity. Timber members behave differently in each loading direction. Perpendicular to grain its strength and stiffness properties are much lower than in the fibre direction. Timber also has weakness in the cross grain direction where highly brittle tensile failure can occur. (Mohamad, Ahmad, & Jalil, 2014)
Timber undergoes brittle failure when overstressed. Standard and codes adopt extensive strength reduction factors to account for this and the large variations in timber properties. Structural engineers use strength reduction factors as a way to reduce the calculated section capacity of materials. (Ferrier, Agbossou, & Michel, 2014)
Wood products are increasingly used over plain sawn and treated timber. The defects in timber are removed where possible in the manufacturing process. Advanced wood products commonly used include glue-laminated lumber (Glulam), laminated veneer lumber (LVL), and cross-laminated timber (CLT). Recent wood and wood-like products include hybrid wood with post tensioning or fibre reinforced polymer reinforcing, and glue-laminated bamboo (Glubam) (Ferrier, Agbossou, & Michel, 2014; Mohamad, Ahmad, & Jalil, 2014; Symons, 2014; Xiao, Chen, & Feng, 2013).
2.7.3.1. Glued-Laminated Lumber (Glulam)
structural performance than plain sawn timber. Section size can be made to vary with member length. The size of the original tree does not limit section size of glulam. (Symons, 2014)
2.7.3.2. Laminated Veneer Lumber (LVL)
LVL is manufactured by gluing multiple layers of veneer together under heat and pressure. The veneer is approximately 3.5 mm thick, peeled from logs. Defects are cut from the veneer during the gluing process. (Symons, 2014)
LVL can be made into walls, floors, frames, beams or columns.
2.7.3.3. Cross Laminated Timber (CLT)
CLT, which goes under the trademarked name of XLam in New Zealand, is made up of boards lined up with alternating grains joined by finger joints and edge glued. The CLT is sealed inside a membrane and vacuum pressure around 90 kPa is applied for 2.5 hours.
CLT panels can be manufactured to incorporate large openings such as doors and windows, with minor openings cut out after the panel has cured. (Symons, 2014)
2.7.3.4. Glued-Laminated Bamboo (Glubam)
Glubam is manufactured from strips of bamboo. Bamboo is a wood-like species of grass. Bamboo exhibits equal of better physical and mechanical properties compared to wood and grows much faster (Xiao, Chen, & Feng, 2013). Bamboo is harvested after four years growth and can grow back without requiring replanting.
2.7.3.5. Hybrid Timber with Post-Tension Reinforcing
2.7.3.6. Hybrid Timber with Fibre Reinforced Polymers (FRP)
FRP is made from fibres, carbon and glass. Fibres are sealed in a polymer with the fibres aligned in one direction. This creates a material that is very strong in tension and very light.
2.8.
Conclusion
The literature reviewed demonstrates that there are many material and business issues associated with SMEs in the use of AGEMs. The main business issues found are growth, cost, identification and evaluation of materials, experience, lack or inadequate standard and codes, and inventory management. The main material issues of AGEMs were found to be their material properties, perception by SMEs, environmental impact and the selection of materials available.
It is important for manufactures of advanced and green materials to understand the issues of SMEs because they comprise a large part of the construction market. SMEs are therefore highly influential on the success of advanced and green material products, and the issues they experience differ from that of larger organisations.
CHAPTER 3 - RESEARCH DESIGN AND
METHODOLOGY
3.1.
Methodology
1. Produce a survey for SME engineering design and construction firms regarding
their perceived issues in the use of advanced and green materials.
2. Gain approval of the survey from the University of Southern Queensland’s
Human Research Ethics Committee (HREC).
3. Form a list of email and phone contact details for a statistically valid sample of
SMEs.
4. Administer the survey to the identified SMEs.
5. Follow up with slow respondents to the survey if required.
6. Select up to five suitable materials for further investigation.
7. Evaluate the responses to the survey and develop conclusions.
3.2.
Survey
The survey questions were formulated, and then sent to USQ’s HREC for acceptance with the ethical guidelines. While the HREC was reviewing the documentation an email list was created for potential firms to invite to participate in the survey. Upon acceptance the survey was distributed using an online survey tool, Survey Monkey, and three collector methods were used over the three-week period of the survey. A copy of the survey questions is attached in Appendix B.
The objective of the survey was to collect data to allow issues with AGEMs to be identified and evaluated, with five AGEMs to be evaluated further and for conclusions to be developed. To ensure that there was enough data to achieve the objectives a minimum number of desired responses for the survey was 30. This number of responses fits with central limit theorem sample size selection.
3.2.1. Formation
use would continue (for used AGEMs), or start (for unused AGEMs) with or without perceived issues being addressed.
The questions were split into four sections. The generic information about the firm allowed for the comparison between firms while maintaining anonymity for participants. Then three issue categories for SMEs to answer: issues with AGEMs in general; AGEMs previously used by the firm; as well as AGEMs not previously adopted.
3.2.2. Ethical Acceptance
The survey was required to be accepted by the USQ’s HREC prior to release to selected firms who were invited to participate. The HREC acceptance ensured that the risk for the participants was identified and mitigated. This project maintained anonymity for respondents and gathered data on firms rather than the individual responding to the question, much like a business case study. There were very low levels of risk with this project.
Appendix C, contains the ethics committee submission and approval.
3.2.3. Selection of firms
The firms invited to participate in the survey were identified from the New Zealand and Australia business directory, Yellow Pages. The Yellow Pages directory was
accessed through the company’s websites, www.yellow.co.nz and
www.yellowpages.com.au.
construction industry. The breakdown of discipline and country is shown in Table 3-2.
Table 3-1: Firms identified by discipline and country
Architect Engineer Contractor Total
New Zealand 674 1,043 3,907 5,624
Australia 4,672 1,633 62,546 68,851
Total 5,346 2,676 66,453 74,475
Table 3-2: Firms invited to participate by discipline and country
Architect Engineer Contractor Total
New Zealand 116 124 157 397
Australia 118 114 120 352
[image:33.595.117.494.136.599.2]Total 234 238 277 749
Table 3-3: Percentage of Firms invited by discipline and country
Architect Engineer Contractor Total
New Zealand 17% 12% 4.0% 7.1%
Australia 2.5% 7.0% 0.19% 0.51%
Total 4.3% 8.9% 0.42%
3.2.4. Distribution
The online survey tool, Survey Monkey, was used to create and distribute the survey. The survey was distributed by three methods, Survey tool generated email with direct link, a personal email with Facebook link to the survey, and a personal email with web link to survey.
links to participate or withdraw from further receipt of survey requests, in which a message was entered to explain the survey to the firms invited to participate and key information for the participant information sheet (PIS). The weakness of this method was the inability to add attachments and the fact the survey became locked to the email address that received the email. If the employee that received the email invitation did not have the authority to participate it could not be emailed to another employee that could complete the survey.
Due to the reduction of responses to from 4 responses per day, to none within days of the survey release, far short of the required number of participants, the firms yet to responded with either participation or to withdraw were contacted via personal email. The personal email contained a link to a Facebook page created for the research; a break down on the percentage of each discipline to respond, their location and firm size; and a second copy of the USQ HREC PIS.
Week three of the survey a final email was sent to the firms yet to respond through participation or withdrawal. The email contained a web link, which could be forwarded to other email addresses; a second break down of firm distributions; and stated the survey would be drawing to a close shortly.
3.2.5. Collection
The research survey was collected using three methods available with Survey Monkey. The collectors methods that were employed included, Email Invitation, Facebook Post and Web Link.
Facebook Post allows a link to be posted on a Facebook page. Providing the benefit that any firm that can find the page can participate. Though this requires the link to the Facebook page to be distributed. The link to the Facebook page, set up for the research survey, was sent using personal email this required sending multiple emails to the remaining 650+ invited firms that had neither participated or withdrawn from the research, as mentioned above to avoid the anti-malware restrictions.
Web Link was the last method employed to collect responses. This method similarly to the Facebook post above required the distribution of the link via personal email. The advantage of this method, from the original method, was the ability for the email to be forwarded on to another employee if the initial contact didn’t have the authority; and from the Facebook method, by removing the ability for Facebook users (non-construction industry firms) finding the page and filling the survey out themselves.
3.3.
Limitations
The following limitations have been identified for the research to be considered with the results, discussions and conclusions. The AGEMs surveyed, distribution of disciplines that actually responded, quantity of participants, differentiation of personal vs. firm issues with AGEMs, reasons for each issue, completeness of the survey and ability to follow up with respondents.
The AGEMs that were covered by the survey were from a broad list created prior to the release of the survey document, and other materials mentioned by the respondents. There were only a couple of materials offered by participants under the option of “other”. This meant that those options did not have enough respondents to evaluate the material, and the firms that provided responses on those materials did not provide input on another potentially equally used or unused AGEM by the firm. The decision of 5 or more AGEMs for SMEs to answer questions about may have provided better individual AGEM issue results, and potentially lower quality cumulative issue results.
distribution of respondent’s discipline is potentially a limitation for the result. The ‘Architect’ discipline contained the less number of firms for the industry, however provided the greatest percentage of responses. This could potentially incorporate a basis into the results. Further research could look at achieving equal volume responses from each discipline or look at achieving similar distribution as is experience in the industry. Inclusion of further numbers of each discipline will also allow for the breakdown of the results further by discipline, which was not possible with this research.
Increasing the quantity of participants will improve results, up to a point according to central limit theorem. The survey goal was to achieve 30 participants for the survey, which was met. This number has not allowed for some of the desired trends to be developed. This research may have benefited from increasing any of, but not limited to, the following: the number of respondents to each country; the number of respondents form each state and region; the number of responses for each discipline; the number of responses for each material. However the number of responses that was received by the survey was hard work to achieve as it is, in the time frame of the project there is little chance further responses could have been achieved. An example of where response volume may have affected result is with the unused AGEM responses. I feel that the volume of responses for each of the materials restricts the trends that can be examined for each material individually. Table 4-4 and Table 4-5, contain the list of common issues for the individual AGEMs, there is a trend that with increasing number of responses there was an increasing number of issues indicated. The materials in, Table 4-4, received a differing number of responses for each material from three to 12 responses for previously used AGEMs. Whereas, the materials listed in, Table 4-5, received only three to four responses for each material, just above the minimum examined.
The survey did not collect the reason for each issue with AGEMs; and due to anonymity for survey respondents, methods of communicating with the participants either to discuss findings, or for follow up interview, are not available. In conjunction with the limitation discussed above about personal vs. firm issues, it is difficult to determine definitely the reasons for the issue resulting in multiple possible reasons for each issue discussed, rather than highlighting exactly how, e.g., “Cost of Materials”, affects the firm.
Completeness of the survey was another limitation with the results. The survey received 30 respondents; each participant was given between 26 and 44 questions. The number of questions was dependent on whether the firm has used AGEMs in the past. Some questions were mandatory to move onto the next section. Some of the participants did not answer all the questions, this was obvious when looking at the volume of respondents from each use category, “Yes, frequently”, “Yes, occasionally”, “Yes, rarely” and “No”. There was an obvious drop in the “rarely” respondents between used and unused materials; also the respondent’s indicating “No” previous use of AGEMs, did not answer the questions on issues preventing the use of AGEMs.
CHAPTER 4 - RESULTS
4.1.
Survey Participants
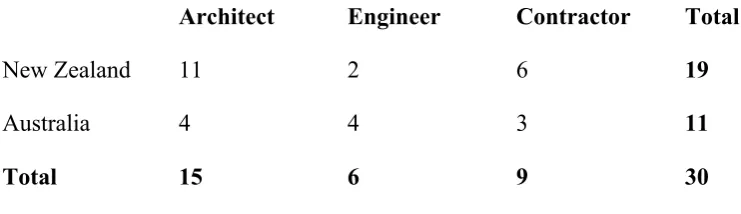
[image:38.595.112.483.403.510.2]The research survey received 30 responses from SMEs in the construction industry. The discipline type (Architect, Contractor or Engineer), location and firm size of each survey participant was collected to assist with the analysis of data collected. The survey was distributed to a roughly even number of SMEs in each discipline and location, i.e., approximately 20 Engineering, Contracting and Architecture firms from each of the six Australian states and 10 of each discipline from each region of New Zealand. The survey was sent to 749 firms in total, refer to Table 3-2 for the breakdown of discipline and location. The size of each firm invited to participant was unknown prior to the collection of survey results. Table 4-1, below shows the split of respondents across discipline and location.
Table 4-1: Response location and discipline
Architect Engineer Contractor Total
New Zealand 11 2 6 19
Australia 4 4 3 11
Total 15 6 9 30
Table 4-2: Percentage of response location and discipline
Architect Engineer Contractor Total
New Zealand 9.4% 1.6% 3.8% 4.7%
Australia 3.4% 3.5% 2.5% 3.1%
Total 6.4% 2.5% 3.2% 4.0%
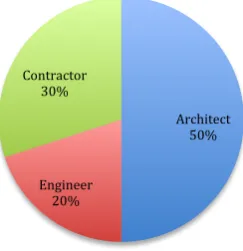
4.1.1. Participants Discipline
The distribution of participants by discipline is shown in Figure 4-1. The total number of Architects that participated was equal to the number of Engineers and Contractors participants combined.
Figure 4-1: Discipline distribution from participating SMEs responses
Architect firms represented 12% and 7% of the total number of firms identified in the construction industry for New Zealand and Australia respectively, Table 3-3. Architects made up 29% and 34% of the firms invited to participate in the survey from New Zealand and Australia, or 31% of the total number of firms invited to participate. The response rate of Architects outperformed both of the other two disciplines, with the survey receiving 50% of the total number of responses from Architects.
Contractor firms represented 69% and 91% of the total number of firms identified in the construction industry for New Zealand and Australia respectively, Table 3-3. Contractors made up 40% and 34% of the firms invited to participate in the survey from New Zealand and Australia, or 37% of the total number of firms invited to
Architect! 50%!
Engineer! 20%! Contractor!
[image:39.595.265.387.331.457.2]participate. The response rate of Contractor was lower than their share of the total number of firms invited to participate.
Engineer firms represented 19% and 2% of the total number of firms identified in the construction industry for New Zealand and Australia respectively, Table 3-3. Engineering made up 31% and 32% of the firms invited to participate in the survey from New Zealand and Australia, or 32% of the total number of firms invited to participate. The response of Engineer was lower than their share of the total number of firms invited to participate.
4.1.2. Participants Location
The survey was distributed to firms across New Zealand and Australia. The distribution of responses is shown in Figure 4-2. The survey asked where the firm operates. The location receiving the largest number of firms indicating it as an area of operation, with 20% of the participants, was Canterbury region of New Zealand. The only region of New Zealand or state of Australia not to be indicated by participants, as a region they operate in, was the Southland region of New Zealand.
Figure 4-2: Location distribution of participating SMEs
4.1.3. Participants Firm Size
employees increased. The survey was directed towards SME’s with one of the New Zealand respondents responding in the range of 20-200, which is larger than a SME in New Zealand, but inside the range for SME in Australia.
Figure 4-3: Size distribution of participating SMEs
The trend downward for the number of firms in each size range, with the lowest volume of responses for 16-19 full time employees, which is the maximum size for a SME in New Zealand, and increased slightly for firms with 20-200 employees. The 20-200 group contains the one New Zealand firm that is not considered an SME in New Zealand, but will be kept inside the same as the survey contains data from New Zealand and Australia, were 20-200 is the largest firm size categorised SME.
4.1.4. Participant Discipline, Size and Country
Figure 4-4, Figure 4-5 & Figure 4-6 contains the split of firm size by discipline and location.
Architect firm size and location responses in Figure 4-4, shows the majority of participants have less than 10 employees. Three quarters of the responses were from New Zealand.
1T2! 3T5! 6T10! 11T15! 16T19! 20T200!
Figure 4-4: Architect, firm size and country responses
Figure 4-5, contains the Engineer firm size and location responses. There are less half the number of respondents for Engineer discipline than Architect. The firms that have participated indicate, a similar trend as to Figure 4-4, a downward trend with the majority with less than 10 employees. There were twice as many responses from Australia than New Zealand for Engineer. Further New Zealand and Australian Engineer responses are needed to produce a clearer picture of the distribution in firm size.
Figure 4-5: Engineer, firm size and country responses
Figure 4-6, below contains the Contractor discipline firm size and location responses. The contractor discipline received responses from just over half the number of those indicating Architect. The difference between Contractor discipline and that of Engineer and Architect is the number of firms with higher number of employees, and the lack of downward trend as the number of employees increased. There were twice as many responses from New Zealand than Australia for the Contractor discipline.
0! 1! 2! 3! 4! 5! 6! 7!
1T2! 3T5! 6T10! 11T15! 16T19! 20T200!
Australia!
New!Zealand!
0! 1! 2! 3! 4!
1T2! 3T5! 6T10! 11T15! 16T19! 20T200!
Australia!
Figure 4-6: Contractor, firm size and country responses
4.1.5. Participants Use of AGEMs
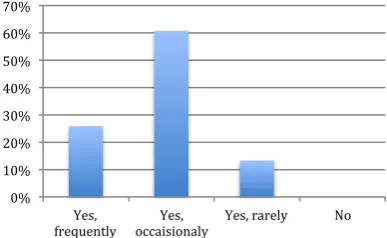
The participants indicated their use of AGEMs as shown in Figure 4-7, by the response to the question ‘Has the firm use AGEMs?’. In the survey participants were directed to different questions due to whether they indicated they had previously used AGEMs or not. The firms that indicated they had previously used AGEM were directed initially to questions about the three AGEM most prevalently used by the firm; before the questions about what materials the firm were aware of, but had not used due to the perceived issues. The firms that indicated no previous use of AGEM were directed past questions about their most commonly used AGEMs, to the questions about the issues preventing the use of AGEMs by the firm.
Figure 4-7: Frequency of AGEM use by SMEs
Figure 4-9 & Figure 4-8, show the distribution of firms that answered “Yes, frequently”, “Yes, occasionally”, “Yes, rarely” and “No” to questions about the AGEMs used and not used by the firm.
0! 1! 2! 3! 4!
1T2! 3T5! 6T10! 11T15! 16T19! 20T200!
Australia!
New!Zealand!
0%! 10%! 20%! 30%! 40%! 50%! 60%!
Figure 4-9, shows the distribution of responses to ‘Has the firm used AGEMs?’, for questions about the AGEM most commonly used by the firm. There were no firms that answered “No”, as these firms were not given these questions. The distributions of the “Yes” respondents more close resemble the distribution that participated in the survey Figure 4-7, without the “No” respondents.
[image:44.595.332.526.410.529.2]Figure 4-8, shows the distribution of responses to ‘Has the firm used AGEMs?’, that answered questions about the AGEMs the firm do not use due to the issues with the material. All survey participants were asked the questions about what AGEM the firm do not use due to the materials perceived issues. Participants that answered “No” to ‘Has the firm used AGEMs?’ did not go on and answer the questions about AGEMs they were aware of but did not use due to the issues related to them. There was a higher percentage of firms that answered “Yes, frequently” than “Yes, rarely”, which differs from Figure 4-7 indicating that there were some “Yes, rarely” firms that did not answer the question about previously unused AGEMs.
Figure 4-8: Frequency of use for previously used AGEMs
Figure 4-9: Frequency of use for previously unused AGEMs
4.2.
Identification and Evaluation of AGEMS
The participants were asked ‘How does the firm identify potential materials for use?’ and ‘How does the firm evaluate alternative materials?’ on the page for general issues with AGEMs. Table 4-3 below contains the open-ended responses. The only alterations to the responses have been the addition of “(beside in this table)” where participants have referred to an answer that was above in the survey, but is shown
0%! 10%! 20%! 30%! 40%! 50%!
Yes,!
frequently! occaisionaly!Yes,! Yes,!rarely! No!
0%! 10%! 20%! 30%! 40%! 50%! 60%! 70%!
Yes,!
Table 4-3: Results for Methods of Identification and Evaluation
How does the firm identify potential materials for use?
How does the firm evaluate alternative materials?
Discussion with Client re cost savings Compliance with standards and workability.
We look at specification of products, use other experts in the product, network with peers, use internet or other publications for information talk to others who have used/recommended the product.
as above (beside in this table)
Reading information, obtaining actual samples and testing in house, (e.g. where possible: we drill holes in, nail it, burn it, submerse in water, test with glues and chemicals, and use it:) industry feedback and other users, our own experience of the material. Cost/value. Is it a good solution?
Same as above. Policy being to become 'expert' in any new product which often means phoning the manufacturer to get greater technical detail and advice or limitations of use. (beside in this table)
Experience We don't
research research and investigation
Mostly supplier and customer feedback. 1. Customer acceptance 2. Cost
3. Improvement on existing material Often it is suggested by the client. It
depends on how "green" the client is.
Also through reps, websites,
advertising, seminars etc,
Through talking with other professionals and
experienced users and manufacturers,
research through the internet
General research based upon client
request. Industry publications Google for problems
Research, samples and speaking with
manufacturers As above and also built examples (beside in this table)
design factors, strength, look of the product, ability to be used for a specific task.
we look at what the product can do and the costs involved. The products availability and skills required to use it.
Mainly reading trade literature Rely on others. Providing evaluating body is
reputable
Research Identify where and when has been previously
used Seminars and publications- what is out
there? Book/ Internet browsing
Research- Mainly Internet and querying peers Check availability and Matching with
projects- are they the best option- cost/ availability/ relevancy
4.3.
SMEs issues with AGEMs
The research survey collected issues for SMEs with the use of AGEMs across three broad categories. General issues with AGEMs; issues for SMEs with the use of AGEMs commonly adopted by the firm; and issues for SMEs with the use of AGEMs not previously adopted by the firm.
The results for issues have not been broken down by discipline, as there is not enough data to compare from some disciplines (this is discussed in the limitations, Section 3.3).
4.3.1. General issues with AGEMs for SMEs
The SMEs that participated in the survey were asked to score a selection of issues with a sliding scale: “Strongly Disagree”, “Disagree”, “Neither Agree or Disagree”, “Agree”, and “Strongly Agree”. Each choice was assigned a corresponding score of 1-5, with a score of 1 as “Strongly Disagree” and 5 as “Strongly Agree”, the results from the survey are shown in Figure 4-10 below. The issues that scored higher than “Neither Agree or Disagree” are as follows:
1. Experience, with a score of 4.13;
2. Perception, with a score of 3.88;
3. Cost of Material, with a score of 3.73;
4. Standards or Codes, with a score of 3.67;
5. Evaluation Methods, with a score of 3.33;
6. Identification of alternatives, with a score of 3.27; and
7. Material Properties, with a score of 3.20.
Standard!or!Codes!
Experience!
IdentiYication!of!alternative! materials!
Evaluation!Methods!
Inventory!Management! Cost!of!material!
Figure 4-10: Survey results for general issues with use of AGEMs by SMEs
Experience was the highest scoring general issue for SMEs with the use of AGEMs, and the only issue that scored between “Agree” and “Strongly Agree”. Scores above 3 indicate that there are more firms experiencing the issue than not, and highlights issues that could be addressed to improve the use of AGEMs in general. From the selection of general issues with AGEMs only “Growth of business” and “Inventory Management” scored “Disagree”.
4.3.2. The issues with AGEMs previously adopted by SMEs
The SMEs that participated in the survey were split into firms that have used AGEMs in the past and those that have not. The SMEs that have used AGEMs were given questions about the three AGEMs most commonly used by the firm, included were questions about the issues related to the AGEMs. Figure 4-11, shows the issues for all AGEMs identified by SMEs as materials that are currently used by the firms. The leading four issues are:
1. Cost of Materials;
2. Material Properties;
3. Availability; and
4. Experience.
Figure 4-11: Survey results of issues with AGEMs previously adopted by SMEs
‘Other’ issues shown in Figure 4-11 above include, “Consistency”, “Different Finishes Available”, “Detailing/shop drawings”, “Climate”, “Absence of robust in-ground insulation” and “Structure of foundations and Parapit”, which were given by a
Cost!of!Material! Material!Properties! Avaliability! Experience! Evaluation!Methods! Perception! Standards!or!Codes! Clients! Apperience! Local!Councils! Other!
participant using option of “Other” and typing in each issue. The individual issues for the most commonly used AGEM are shown in Section 4.4.1.1.
4.3.3. The issues with AGEMs not previously adopted by SMEs
The SMEs that participated in the survey were split into firms that have used AGEMs in the past and those that have not. All participants were asked questions about two AGEMs that have not been used by the firm due to issues with the material, included were questions about the particular issues preventing the use of these AGEMs. Figure 4-11, shows the issues for all AGEMs identified by SMEs as materials not previously used by the firm. The leading four issues are:
1. Experience;
2. Standards or Codes;
3. Evaluation Methods; and
4. Cost of Materials.
Figure 4-12: Survey results of issues with previous unused AGEMs
‘Other’ issues shown in Figure 4-12 above include, “Weather Conditions” and “Inventory Management”, which were given under the option of “Other” by a single participate for each issue. The individual issues for the most commonly used AGEM are shown in Section 4.4.1.2.
4.4.
Responses for individual AGEMs
Each participating SMEs were asked questions about two to five AGEMs. The firms that indicated previous use of AGEMs were given questions about the three most
Experience! Standards!or!Codes! Evaluation!Methods! Cost!of!Material! Avaliability! Perception! Material!Properties! Earthquake! Clients! Local!Councils! Other!
commonly used AGEMs, and two AGEMs not used by the firm due to the perceived issues with their use. Whereas the SMEs indicating “No” previous use of AGEMs were directed to the latter questions about two AGEMs not used.
The materials that have been evaluated individually were the materials identified in the survey with at least 10% of the participants indicating either previous use of the material, or reluctance to use the material due to the issues perceived by the firm with their use.
4.4.1. Individual AGEMs Issues
The questions about each material included issues for both used and unused AGEMs. The following two sections introduce the results for each individual material’s issues.
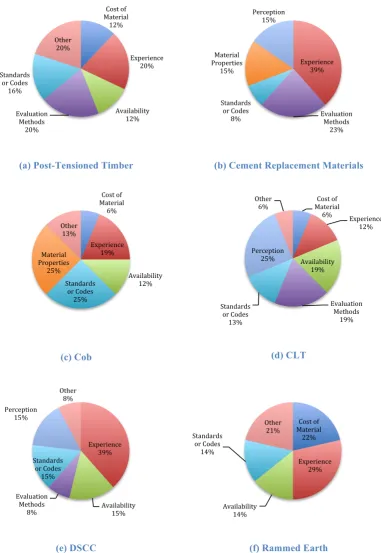
4.4.1.1. AGEMs commonly adopted by SMEs
There were six AGEMs commonly adopted by at least 10% of the SMEs respondents that indicated prior use of AGEM, which were:
(a) LVL
(b) Glulam
(c) Rammed Earth
(d) High Strength Concrete
(e) Lightweight Concrete
(f) Adobe Brick
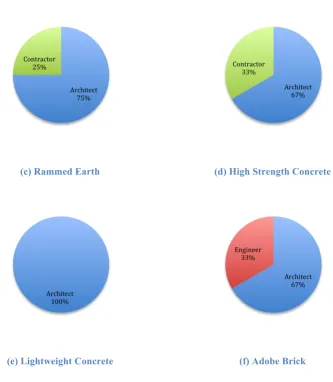
The materials have been listed above and shown below in the order of most responses, with indicated preference used to separate materials with identical number of responses, e.g., LVL was the most common AGEM from the survey responses; with Lightweight Concrete and Adobe Brick receiving the least number of participants, with 10% of participant indicating previous use. Lightweight Concrete was shown ahead of Adobe Brick since it received higher use preference as indicated in Section 4.4.7.
material tends to be “Cost of Material”, Adobe Brick is the only material shown below that is an exception to this observation. Cost of Material was also identified in Section 4.3.2, as the leading issue for AGEMs that have been previously used by SMEs. The other top four issues identified in Section 4.3.2, “Experience”, “Availability” and “Material Properties” were also present for the majority of the material below.
(a) LVL (b) Glulam
(c) Rammed Earth (d) High Strength Concrete
Cost!of! Material! 30%! Experience! 9%! Availability! 13%! Evaluation! Methods! 9%! Standards! or!Codes! 4%! Material! Properties! 22%! Perception!
9%! Other!4%!
(e) Lightweight Concrete (f) Adobe Brick
Figure 4-13: Issues for SME with used AGEMs
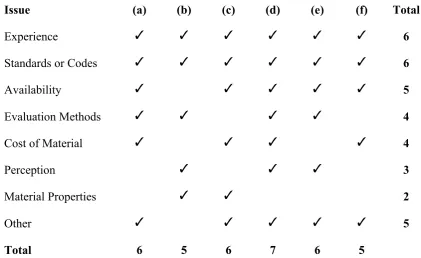
Table 4-4, below indicates which materials had which issues, each letter corresponds to the material list above and the numbering in Figure 4-13. The table compares the issues recorded for each material, and ranks the issues. The four leading issues, “Cost of Material”, “Material Properties”, “Experience” and “Availability�