This is a repository copy of
Supporting the routine collection of patient reported outcome
measures in the National Clinical Audits for assessing cost-effectiveness. Work Package
1. What patient reported outcome measures should be used in the 2013/14 National
Clinical Audit Programme. Appendix E - Diabetes
.
White Rose Research Online URL for this paper:
http://eprints.whiterose.ac.uk/106561/
Version: Published Version
Monograph:
Ara, R., Duarte, A., Harnan, S. et al. (4 more authors) (2015) Supporting the routine
collection of patient reported outcome measures in the National Clinical Audits for
assessing cost-effectiveness. Work Package 1. What patient reported outcome measures
should be used in the 2013/14 National Clinical Audit Programme. Appendix E - Diabetes.
Report. Policy Research Unit in Economic Evaluation of Health and Care Interventions
(EEPRU) (RR0032). Policy Research Unit in Economic Evaluation of Health and Care
Interventions
[email protected] https://eprints.whiterose.ac.uk/ Reuse
Unless indicated otherwise, fulltext items are protected by copyright with all rights reserved. The copyright exception in section 29 of the Copyright, Designs and Patents Act 1988 allows the making of a single copy solely for the purpose of non-commercial research or private study within the limits of fair dealing. The publisher or other rights-holder may allow further reproduction and re-use of this version - refer to the White Rose Research Online record for this item. Where records identify the publisher as the copyright holder, users can verify any specific terms of use on the publisher’s website.
Takedown
If you consider content in White Rose Research Online to be in breach of UK law, please notify us by
Economic Evaluation of Health
and Social Care Interventions
Policy Research Unit
RESEARCH REPORT
Supporting the routine collection of patient
reported outcome measures
in the National Clinical Audits for assessing
cost-effectiveness
Work Package 1
What patient reported outcome measures should be
used in the 13 health conditions specified in the
2013/14 National Clinical Audit programme?
APPENDIX E, DIABETES
Authors: Roberta Ara, Ana Duarte, Sue Harnan, Jo
Leaviss, Steve Palmer, Mark Sculpher, John Brazier
Correspondence to:
Roberta Ara
, HEDS, ScHARR,
University of Sheffield, Regent Court, 30 Regent Street,
Sheffield, S1 4DA
. Email: [email protected]
RR003
2
EEPRU NCA Appendix E, Diabetes
Page 2
The Policy Research Unit in Economic Evaluation of Health and Care interventions is funded by the Department of Health Policy Research Programme. It is a collaboration between researchers from the University of Sheffield and the University of York.
The Department of Health's Policy Research Unit in Economic Evaluation of Health and Care Interventions is a 7 year programme of work that started in January 2011. The unit is led by Professor John Brazier (Director, University of Sheffield) and Professor Mark Sculpher (Deputy Director, University of York) with the aim of assisting policy makers in the Department of Health to improve the allocation of resources in health and social care.
EEPRU NCA Appendix E, Diabetes
Page 3
INDEX
1 BACKGROUND
2 OVERVIEW
3 METHOD
3.1 Psychometric properties (WP1.1) 3.2 Alternative measures (WP1.2)
3.3 Evidence required for economic evaluations (WP1.3)
4 RESULTS FOR DIABETES
4.1 Evidence of appropriateness of EQ-5D in diabetes 4.2 Alternative measures in diabetes
4.3 Evidence for economic evaluations in diabetes 4.4 Recommendations for diabetes
5 SUMMARY
6 REFERENCES
7 APPENDIX
TABLES
Table 1 Selection of most appropriate review for diabetes
Table 2 Summary of evidence on EQ-5D for diabetes
Table 3 Summary of existing TAs in diabetes
Table 4 Mandatory fields collected in the core diabetes NCA
Table 5 Recommendations and associated future research for diabetes
Table 6 Summary of evidence currently available for recommended measure(s)
FIGURES
Figure 1 Modelling approach used in the diabetes HTAs
EEPRU NCA Appendix E, Diabetes
Page 4
Acronyms
Acronym Definition
ADA American Diabetes Association
ADDQoL audit of diabetes-dependent quality of life ADS Appraisal of Diabetes Scale
AEs Adverse events
AMSTAR Assessing the quality of systematic reviews
ASA American Society of Anesthesiologists classification, BCVA Best corrected visual activity
BMI Body mass index (kg/m2)
BPI-DPN Brief Pain Inventory- Diabetic Peripheral Neuropathy CES-D Center for Epidemiologic Studies Depression
CG Clinical guideline CHU-9D Child Health Utility 9D DE Data extraction DH Department of Health DHP Diabetes health profile DHP-1 Diabetes health profile-1 DHP-18 Diabetes health profile-18 DR Diabetic retinopathy
DSC-R Diabetes Symptom Checklist Revised DSIS The Daily Sleep Interference Scale
EASD European Association for the Study of Diabetes ECG Electrocardiogram
EEPRU Policy Research Unit in Economic Evaluation of Health and Care Interventions EQ-5D EuroQol 5 dimensions
EQ-5D-Y EuroQol 5 dimensions youth version ERG Evidence review group
ESRD End stage renal disease FR Future research HbA1c Glycated haemoglobin
HDL-c High-density lipoprotein concentrations HRQoL Health related quality of life
HS Health states
HTA Health technology assessment HUI Health Utility Index
HUI2 Health Utility Index mark 2 HUI3 Health Utility Index mark 3
IV Intravenous
LDL-c Low-density lipoprotein concentrations mBPI-sf M B P I -Short Form. MCS-12 mental component summary of the SF-12 MDT Multi disciplinary team
EEPRU NCA Appendix E, Diabetes
Page 5
MODY Maturity onset diabetes of the young NCA National Clinical Audit
NEI-VFQ-25 National Eye Institute Visual Functioning Questionnaire NHS National Health Service
NTSS-6 The Neuropathy Total Symptom Score PCS-12 physical component summary of the SF-12 PDPN Painful diabetic peripheral neuropathy PedsQLTM Paediatric quality of life inventoryTM PR Potential recommendations
PREM(s) Patient reported experience measure(s) PROM(s) Patient reported outcome measure(s) PVD Peripheral vascular disease
QA Quality assessment QALYs Quality adjusted life years
QOL-DN quality of life in diabetes neuropathy instrument R&D Research and development
RCT Randomised controlled trial SBP Systolic blood pressure SD Standard deviation SF-6D Short form 6D SF-36 Short form 36 SF-12 Short form 12 SG Standard gamble SS Study selection
STA(s) Single technology appraisal(s) T2DM Type 2 diabetes mellitus TA(s) Technology Appraisal(s) TC Total cholesterol
TIA Transient ischaemic attack TTO Time trade off
UK United Kingdom
UKPDS United Kingdom Prospective Diabetes Study VAS Visual analogue scale
VFQ-25 Visual Functioning Questionnaire 25
EEPRU NCA Appendix E, Diabetes
Page 6
1. BACKGROUND
The Policy Research Unit in Economic Evaluation of Health and Care Interventions (EEPRU) was
approached by Jason Cox (Research and Development (R&D) Division) to prepare a programme of
research to support the appropriateness of, and use of, patient reported outcome measures
(PROMs) collected for the National Clinical Audit (NCA). The EEPRU programme was informed by a
R&D template prepared by Simon Bennett, Steve Fairman and Keith Willett at National Health
Service (NHS) England.
The purpose of introducing PROMs into the NCA programme is to be able to 1) compare
performance between providers and commissioners in the NHS, 2) compare the cost-effectiveness
of alternative providers in delivering the specific services (i.e. linking outcomes and resource use),
and 3) assess the cost-effectiveness of alternative interventions and other changes in the NHS. The
intention is to introduce PROMs across a range of conditions over the next 3 years commencing with
13 conditions in the 2014/15 NCA programme.
The agreed research programme consists of 3 concurrent work packages (WP) as described in the
document submitted to the Department of Health (DH) (8th November 2013). The current document
provides details on the objectives, methodology and results for Work Package 1 (WP1): to determine
what PROMs should be used in the 13 health conditions specified in the 2014/15 NCA programme.
2. OVERVIEW
WP1 is split into three separate components consisting of:
WP1.1 To examine whether the EuroQol-5D (EQ-5D) is appropriate in the 13 health conditions
specified in the 2013/14 NCA programme.
WP1.2 To identify what measure could be used when the EQ-5D is not appropriate in the 13 health
conditions, taking into account that the proposed measure would be used to generate
preference-based utility measures (either directly through existing preference-based weights,
or indirectly through existing mapping functions suitable for the proposed measure).
WP1.3 To identify the evidence required to address questions of cost-effectiveness using the NCA
data.
This Appendix provides the results for diabetes and should be read in conjunction with both the
EEPRU NCA Appendix E, Diabetes
Page 7
3. METHOD
The full detailed methodology used is provided in Appendix A and B, including the search strategy,
selection criteria for studies included, and data extraction etc. In summary, a review of the literature
was undertaken to assess the appropriateness of the EQ-5D in terms of classic psychometric criteria
(WP1.1); where the EQ-5D was not considered appropriate, additional searches were undertaken to
identify alternative measures (WP1.2); and finally, existing health technology assessments were
reviewed and data requirements were compared with variables currently collected in the diabetes
audit (WP1.3).
3.1 Psychometric properties (WP1.1)
Assessments reported in the included studies were categorised according to the following
definitions:
Acceptability
Data relating to how acceptable the measure was to the person completing it, expressed as the
proportion of completed surveys, or the proportion of missing data.
Reliability
There are two main definitions for reliability, a) the degree to which a measure reproduces the same
results in an unchanged population and b) the degree to which a measure reproduces the same
results when completed by different assessors (e.g. patient and proxy report). In both cases,
reliability can be assessed by re-testing, and calculating the correlations or difference between tests.
In case a) the comparison may be between the same populations separated by time, where no
change in health state was observed (as compared to using an alternative condition specific or
generic measure). In case b) the measure may be completed by multiple people (proxies) on the
Where the outcome measure is specifically designed for self-report by patients, this test of reliability may be expected to
produce less agreement.
Construct validity
This is an assessment of how well an instrument measures what it intends to measure. Two main
EEPRU NCA Appendix E, Diabetes
Page 8 a) Known group validity, where estimates for groups that are known to differ in a concept of interest
are compared either qualitatively or statistically. The known groups may be defined using other
measures, according to clinical categorisation.
b) Convergent validity assesses the extent to which a measure correlates with other measures of the
same or similar concepts. Correlation coefficients were considered low if <0.3, moderate if between
0.3 and 0.5, and strong when >0.5.
Responsiveness
a) Change over time. This is an assessment of whether measurements using the instrument can
detect a change over time, where a change is expected. This may be before and after an
intervention, or through progression of a disease. Evidence was considered to be good where a
t-test was significant, though weaker evidence to support responsiveness was considered where there
was a change in the expected direction, but was not statistically significant or not tested. Effect size
and standardised response mean were also acceptable assessments of responsiveness.
b) Ceiling and floor effects were also considered to be indicators of responsiveness. Assessments of
ceiling effects include the proportion of patients who score full health within a group of patients
with known health detriments. A ceiling or floor effect can affect the sensitivity of the measure in
detecting changes over time in patients at the extremes of the measure (for example those with
severe disease activity and those with just minor symptoms of the condition).
3.2 Alternative measures (WP1.2)
Where the EQ-5D was considered appropriate, no further searches were performed.
3.3 Evidence required for economic evaluations (WP1.3)
The existing Health Technology Assessments (HTAs) were reviewed alongside the variables currently
collected in the NCA to determine if clinical or PROM data routinely collected in the NCAs would
suffice to address questions of cost-effectiveness, and to identify any gaps in the evidence that
EEPRU NCA Appendix E, Diabetes
Page 9
4. RESULTS FOR DIABETES
4.1 Evidence of appropriatness of EQ-5D in diabetes (WP1.1) 4.1.1 Selection of systematic review
One systematic review was identified through expert sources,(1) and two (2;3) from the Longworth
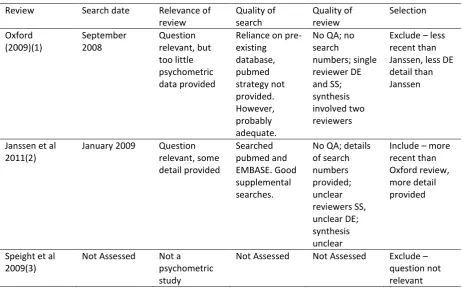
et al. review.(4) The process of selection of the most appropriate review is documented in Table 1.
Janssen et al. was selected as it provides more detail about the psychometric properties of the
[image:10.595.67.530.248.537.2]EQ-5D, and is also marginally more recent than the Oxford review.(1)
Table 1: Selection of most appropriate review for diabetes
Review Search date Relevance of review Quality of search Quality of review Selection Oxford (2009)(1) September 2008 Question relevant, but too little psychometric data provided
Reliance on pre-existing database, pubmed strategy not provided. However, probably adequate.
No QA; no search numbers; single reviewer DE and SS; synthesis involved two reviewers
Exclude less recent than Janssen, less DE detail than Janssen
Janssen et al 2011(2)
January 2009 Question relevant, some detail provided Searched pubmed and EMBASE. Good supplemental searches.
No QA; details of search numbers provided; unclear reviewers SS, unclear DE; synthesis unclear
Include more recent than Oxford review, more detail provided
Speight et al 2009(3)
Not Assessed Not a psychometric study
Not Assessed Not Assessed Exclude question not relevant QA, quality assessment; DE, data extraction; SS, study selection.
4.1.2 Structured abstract for Janssen et al 2011(2)
Purpose of review
Amongst other objectives that are not relevant to WP1.1, Janssen et al. (2011) aimed to the
scientific evidence on the measurement performance of the EQ-5D in the assessment of health
realted quality of life (HRQoL) in adults with Type 2 diabetes (T2DM), with a focus on the ability of
EEPRU NCA Appendix E, Diabetes
Page 10
Methods of review
Search and study selection: EMBASE and MEDLINE (database host platform used was unclear), the
EuroQoL website, and the research databases of the International Diabetes Federation (IDF),
American Diabetes Association (ADA) and European Association for the Study of Diabetes (EASD)
‘ d. Electronic searches
were conducted from J EQ- D
specific diabetic complications in EMBASE and MEDLINE. However, the full search strategies were
not reported and terms used in the research database searches were not given. Studies were
selected for inclusion if they reported EQ-5D measurement properties or scores on the EQ-5D index,
visual analogue scale (VAS) or percentage dimension scores, or the relative impacts on utilities (e.g.
beta coefficients) of specific complications.
Data extraction and synthesis: Data was extracted (unclear whether double data extraction or data
checking performed) using a previously developed and tested standardised form. A narrative
synthesis was performed according to the psychometric quality assessed, namely validity, reliability
and responsiveness. These qualities were defined as a) convergent validity, the degree to which
theoretically related measures agree; b) discriminant validity, the degree to which theoretically
unrelated measures do not agree (this property is not considered as a separate form of validity in
WP1, but may be included in convergent validity where reported); c) known group validity, a form of
construct validity where groups known to vary in health level are shown to vary by the measure; d)
shown to distinguish between levels of health within or between patients (considered as equivalent
to known group or convergent validity, as defined in WP1); and e) responsiveness, the ability of the
measure to detect clinically meaningful changes over time.
Results of the review
Janssen et al. (2011) included 39 articles which presented evidence on the measurement properties
of the EQ-5D in T2DM. The narrative synthesis was brief, and the tabulation of study results was not
detailed. Convergent and discriminant validity (a & d) were reported in 14 studies, which mostly
examined the strength of correlation between the EQ-5D and other generic health status measures
or disease-specific measures. Construct validity (c) was reported in 16 studies. These mainly used
regression and ANOVA techniques. Most demographic and clinical categories were discriminated
between by the EQ-5D, with the exception of patients with multiple conditions and in patients with
(SF-EEPRU NCA Appendix E, Diabetes
Page 11
6D). Additional properties not listed in the methods section of the review were described in the
narrative, namely predictive validity (not relevant to this review), responsiveness, and reliability. The
EQ-5D was shown to be responsive in studies that assessed this, with the exception of one study
investigating diabetic peripheral neuropathic pain. Reliability was reported in two studies as being
(ICC).
‘
The review authors concluded that evidence supported construct, convergent and discriminant
validity, test retest reliability and responsiveness of the EQ-5D in T2DM. However, they also noted
that a ceiling effect and an inability to capture health detriments due to multiple complications were
observed in several studies.
4.1.3 Assessment of review in relation to objectives of work package 1.1
Relevance of review question: One of the aims of Janssen 2011(2) is convergent with the aims of
WP1.1.
Assessment of review quality: Janssen et al. (2011) scored poorly against the relevant AMSTAR
criteria (Table A1, Appendix). The authors did not provide a reference to a published protocol to
evidence an a priori design, meaning the study is potentially open to bias in terms of changes to the
analysis plan in response to the results found. No quality assessment of the included studies was
conducted, and it was therefore not possible to formulate conclusions which take the quality of the
included studies into account. It does not appear that double data extraction or data-checking took
place, leaving the study at higher risk of errors. There appears to have been more than one reviewer
involved in study selection, but it is not clear if this constituted double-checking of study selection or
just division of labour. As such, there is a small risk that some studies may have been missed in study
selection. The meta-analysis conducted is not of relevance to the aims of WP1.1. In addition,
theselection criteria are poorly defined.
Acceptability of the search: In addition to searching relevant electronic bibliographic databases, the
review authors also searched several professional organization websites and performed reference
list checking. Even though full strategies were not given, the search approach is considered adequate
EEPRU NCA Appendix E, Diabetes
Page 12
Acceptability of study selection: Study selection criteria were not well defined, and reference to the
full text of included articles (to retrieve additional data) revealed that studies had been included
which would not have met our selection criteria.
Adequacy of available data and synthesis: The review only provided a small amount of data relating
to each study, and this was not adequate for the requirements of WP1.1. Not enough detail was
provided for some of the studies to enable a judgement to be made about whether the evidence
supported the conclusions. The synthesis was very brief.
In conclusion, the methods employed in the review required some remedial action. Whilst the
searches were thought to be adequate, the inclusion criteria appeared to be wider than that of
WP1.1. In addition, the data extraction and synthesis were not detailed enough to allow a thorough
understanding of the psychometric properties of the EQ-5D in this population. As such, all studies
were re-considered for inclusion, and a detailed data extraction and synthesis of these studies
performed.
4.1.4 Reanalysis of Janssen et al. 2011(2)
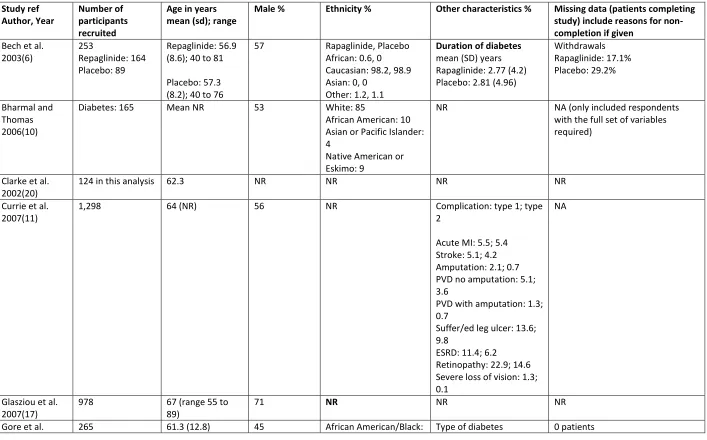
Of the 39 studies initially included in the review, 16 met the inclusion criteria of WP1.1.(6-22) Study
characteristics and results are provided in Tables A2 to A8, Appendix.
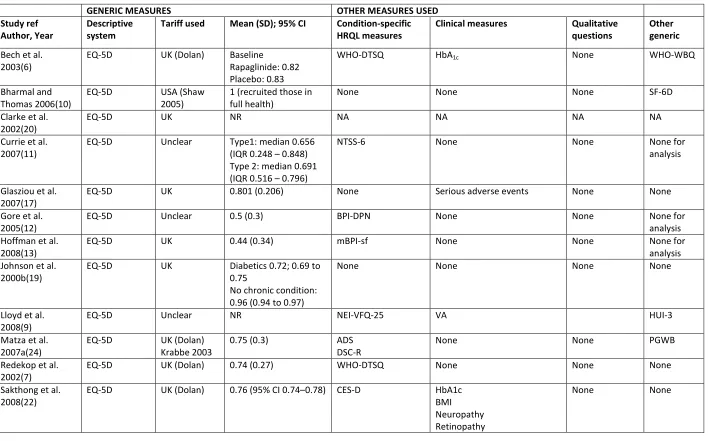
In brief, one study used the USA EQ-5D tariff,(10) 13 studies used the UK EQ-5D
tariff,(6-9;11;13;15-17;19-22) of which four (8;9;11;20) were also conducted in the UK, the remainder being conducted
in Europe in four cases,(6;7;15;16) Australia in one case, (17) Thailand in one case,(22) Singapore in
one case(142) and multinational in two cases.(6;13) The tariff used was not clear in Gore et al. 2005
(set in USA),(12) and no tariff was used in Vernon et al. 2008 (unclear setting).(14)
Patient characteristics differed somewhat across studies. Broad inclusion criteria were used in most
studies, with the exception of Glasziou et al.(17) who recruited normotensive patients, four studies
which recruited patients with painful neuropathy,(12-14;16) and one study which recruited patients
with diabetic retinopathy.(9) Mean ages were similar across studies, ranging from 52(21) to 69(19)
years old. The number of withdrawals was very poorly reported, with most studies only reporting
responders. Three studies were post hoc analyses of randomised controlled trials (RCTs),(6;13;14)
one study was a time series,(19) whilst the remainder were cross sectional studies. Only one study
EEPRU NCA Appendix E, Diabetes
Page 13
Acceptability: It was difficult to assess the acceptability of the EQ-5D as the majority of samples used in the studies appear to be from respondents who completed the full set of variables tested.
However, one study did report that of the participants who completed the questionnaire (which
comprised several measures including the EQ-5D), none of the EQ-5D items were left unanswered,
indicating that the EQ-5D is acceptable.(8)
Reliability: Two studies assessed reliability (Table A7, Appendix).(20;22) Clarke et al. reported K statistics ranging from 0.59 (95% confidence interval (CI) =0.45 0.74) for the EQ-5D mobility
dimension to 0.26 (95% CI =0.11 0.40) for the EQ-5D pain dimension, with a good ICC of 0.59 (95%
CI 0.41 to 0.72) for the tariff scores.(20) Sakthong et al. also reported a good correlation (r=0.74,
95% CI 0.57 to 0.84, p<0.001).(22) Both studies suggest reliability is good (Appendix).(22)
Construct validity (known group): Nine studies reported known group validity for the EQ-5D in people with diabetes (Table A5, Appendix).(9;11-13;15-17;22;23) Matza et al. compared the mean
EQ-5D for various dichotomised known groups. These groups included the median split for two
disease-specific tools (the appraisal of diabetes scale (ADS); the diabetes symptom checklist
revised (DSC-r)), whether patients wanted to lose weight, or wanted to stay the same weight;
whether patients had daytime hypoglycaemia; whether they had night-time hypoglycaemia;
whether they had any hyperglycaemia; whether they were treated with oral medication or injected
insulin. The mean EQ-5D was significantly different between groups in all cases by t-test, except for
presence of hyperglycaemia or type of treatment. Matza et al. concluded that whilst the EQ-5D is
valid, it should not be used as the sole measure in a clinical trial.(23)
In Vexiau et al. 2008, all EQ-5D health dimensions scores showed differences between those with
and without hypoglycaemia symptoms, although the differences were only statistically significant for
pain/discomfort and anxiety/depression (p<0.005). There was also a statistically significant
difference between mean EQ-5D index scores between these two groups (0.70 (SD 0.26) vs. 0.80 (SD
0.23) respectively, p<0.0005). Glasziou et al. 2007 presented graphs that showed the mean EQ-5D
deficit at baseline was significant for those with (compared to those without) stroke/transient
ischaemic attack (TIA); peripheral revascularisation/amputation; myocardial infarction (MI); hospital
admission for unstable angina; currently treated hypertension, but the deficit was not significant for
those with diabetic eye disease, or coronary artery bypass graft. Similar graphs were shown for the
EEPRU NCA Appendix E, Diabetes
Page 14
across the classes. In addition, these latter two measures did not produce a significant difference in
means for those with or without MI, where the EQ-5D did. Sakthong et al.(22) compared means in
EQ-5D index in those with and without various characteristics, and found statistically significant
differences for neuropathy, retinopathy, nephropathy and cardiovascular disorder, but not for
glycated hypoglycaemia (HbA1c).
Known group validity of the EQ-5D for visual functioning was further assessed in one study against a
condition specific measure (Visual Functioning Questionnaire 25 (VFQ-25)), and against a clinical
measure (visual acuity).(9) Formal statistics were not presented, but trends in EQ-5D scores were the
same at the upper and lower extremes of visual acuity, though middle range values were not well
differentiated by the EQ-5D, possibly due to small sample sizes as the same problem was observed
with the Health Utility Index-3 (HUI-3) and VFQ-25.
Four studies compared neuropathic pain scales or generic pain scales to the EQ-5D. These were the
neuropathy total symptom score-6 questionnaire (NTSS-6),(11) the quality of life in diabetes
neuropathy instrument (QOL-DN),(11) the brief pain inventory modified for pain in diabetic
peripheral neuropathy (BPI-DPN),(12) and the modified brief pain inventory short form
(mBPI-sf)(13;16). Three studies recruited only patients with neuropathic pain,(12;13;16) whilst one
recruited anyone with diabetes.(11) All found good agreement, which supported the EQ- D
to detect pain related to diabetic neuropathy, even in a general sample of patients with diabetes.
Construct validity (convergent): Seven studies considered convergent validity of the EQ-5D compared to a variety of other measures (Table A6, Appendix).(6-8;14;17;21;22) Convergent validity
between the EQ-5D index and the WHO Diabetes treatment satisfaction questionnaire (WHO-DTSQ)
was low in the study that assessed treatment satisfaction (r=0.28 p<0.0001).(7) The EQ-5D does not
have an item related to treatment satisfaction, so this is perhaps not surprising.
Two studies compared EQ-5D against a general diabetes scale. One study used two such scales: the
appraisal of diabetes scale (ADS) and the diabetes symptom checklist- revised (DSC-R).(24) The study
found moderate to strong agreement (r range: -0.44 to -0.61 (all p<0.001)), except for the
ophthalmic scale of the DSC-R, which had only low agreement (r=-0.22, p<0.05). The second study
used the audit of diabetes-dependent quality of life (ADDQoL),(21) and showed a strong correlation
EEPRU NCA Appendix E, Diabetes
Page 15
the ADDQoL for the items relating to current QoL (rather than items relating to overall impact of
diabetes on life domains).
The EQ-5D was compared against the daily sleep interference score (DSIS) in one study(14) which
recruited only those with painful peripheral neuropathy. This study reported low to moderate
agreement (r range: 0.08 to 0.44) for the EQ-5D, with moderate correlation only being observed in
the pain/discomfort dimension, suggesting that the impact of painful neuropathy on sleep was not
captured in the EQ-5D.
The correlation of the EQ-5D with HbA1c was assessed by two studies.(6;22) Sakthong et al. reported
a low -0.17, p<0.01) between the EQ-5D and HbA1c at
baseline.(22) In Bech et al. changes in the HbA1c did not have a significant correlation with changes in
the EQ-5D in response to treatment.(6) Both studies recruited people with T2DM with similar HbA1c
scores at baseline (7.7% (SD 1.7, range 4.0 15.8) vs. 7.7% (SD 1.7, range not reported) respectively).
Other diabetic complications were also used in convergent validity tests. The EQ-5D was correlated
with the SF-6D in a ranking of severity of seven complications (r=0.837 to SF-6D (SF12), and r=0.842
to SF-6D (SF36)).(17) It was also shown to have moderate correlations with the number of
complications (r=0.40, p<0.01), and a measure of depression, the Center for Epidemiologic Studies
-Depression (CES-D) (-0.49, p<0.01), but low correlation with body mass index (BMI) (r=-0.15,
p<0.01)(22)
Overall, convergent validity was generally strong when compared with generic or condition-specific
measures. There were, however, certain situations where the correlations were low. These include
some uncertainty (owing to small sample numbers) about the ability of the EQ-5D to detect
ophthalmic issues,(8), low or non-significant correlations with HbA1c in the two studies that reported
this comparison, low correlations with a measure of treatment satisfaction(7) and low correlations
with BMI in two studies.(8;22) On balance, results suggest a lack of responsiveness of the EQ-5D to
changes in HbA1c, rather than a complete lack of correlation.(6) There were also lower correlations
with the daily sleep interference scale (DSIS)(14) and with a measure of treatment satisfaction in
diabetes (WHO-DTSQ).(7)
EEPRU NCA Appendix E, Diabetes
Page 16
expected, over a four month period, although the WHO-DTSQ did. Johnson et al.(19) recorded mean
EQ-5D values each year over three years. They reported the expected decreases in EQ-5D mean
scores over time (within subject effects analysis for time and diabetes status: f=4.49 p=0.012),
supporting the responsiveness of the EQ-5D.
Responsiveness (ceiling effects): Three studies assessed responsiveness through examining potential ceiling effects on the EQ-5D (Table A8, Appendix).(8;10;21) Matza et al. 2007 noted that
40% of those with diabetes scored full health on the EQ-5D, whilst 0% scored full health on the
Psychological General Well-Being Index. Similarly, Bharmal & Thomas 2006 noted that amongst 165
people with diabetes (from a general population sample) who scored full health on the EQ-5D, the
mean physical component summary of the SF-12 (PCS-12) was significantly different to those with
no medical conditions, whereas the mental component summary of the SF-12 (MCS-12), and total
score of the SF-6D were not significantly different. This indicates a ceiling effect in the EQ5D in
comparison to the PCS-12. In Sakthong et al. 37.8% of people with diabetes reported full health, and
of these, the mean ADDQoL was -3.4 (SD 2.49), indicating a ceiling effect of the EQ-5D in comparison
with the ADDQoL.(22)
4.1.5 Conclusion of appropriateness of EQ-5D in diabetes
The evidence base used to assess the appropriateness of the EQ-5D in patients with diabetes is
relatively large (N=16), with the majority using data obtained using the UK EQ-5D tariff, and all using
adults samples. Acceptability and reliability were both reported to be good. There was some
evidence of a ceiling effect in patients with diabetes, which may be more relevant in newly
diagnosed patients who do not have diabetes related complications, and are thus more likely to
score relatively high on the index. The majority of studies reported the construct validity of the
EQ-5D was good when compared to diabetes specific clinical and quality of life measures. Exceptions
included, for example, levels of visual acuity, and potentially HbA1c. Poor correlations against some
variables are of less concern where the comparator may not reasonably be expected to produce a
correlation with HRQoL. For example, the relationship between HbA1C and HRQoL is complex; HbA1c
levels are an indication of blood glucose levels over the previous 2-3 months, whereas the EQ-5D
asks patients what their HRQoL is today. In conclusion, the EQ-5D is adequate in patients with
diabetes but additional research is required before it can be recommended for patients with visual
EEPRU NCA Appendix E, Diabetes
[image:18.595.68.528.91.173.2]Page 17
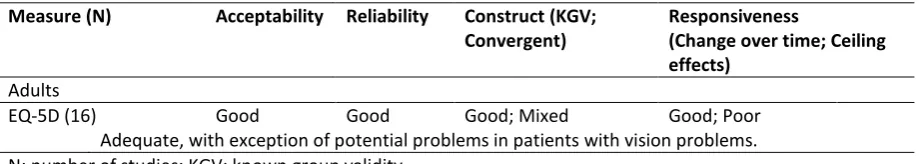
Table 2: Summary of evidence on EQ-5D for diabetes
Measure (N) Acceptability Reliability Construct (KGV; Convergent)
Responsiveness
(Change over time; Ceiling effects)
Adults
EQ-5D (16) Good Good Good; Mixed Good; Poor Adequate, with exception of potential problems in patients with vision problems. N: number of studies; KGV: known group validity
4.2 Alternative measures in diabetes (WP1.2)
Based on the psychometric properties of the EQ-5D reported for patients with diabetes, with the
exception of potential problems in patients with vision problems, and the suggestion that there may
be a ceiling effect, the evidence suggests the EQ-5D is appropriate in adults with diabetes.
Consequently the evidence on other condition-specific or generic measures was not reviewed.
It is worth noting, however, that the NHS outcomes framework uses the Diabetes health profile
(DHP) self-reported outcome measure in conjunction with the EQ-5D.(5) The DHP is available in two
forms, DHP-1 and DHP-18. DHP-18 takes less time to complete, is available in electronic formats as
well as paper, and there is some limited evidence and ongoing research relating to its use in cost
utility analysis.(25) It aims to capture the impact of diabetes on everyday social and emotional
functioning, which may not be captured by other measures.
The problems with the EQ-5D in vision have been noted elsewhere.(4;26) and a bolt-on for vision has
P I I
I T on
of health states has been tested in an exploratory and a full valuation study.(4) The vision bolt-on
has been shown to significantly impact on at least some health states, with complex interplay
between severity of the vision response, and severity of responses in the other dimensions.
However, the authors caution that sample sizes were small, and that further research with larger
sample sizes is required.
There will be some children in the diabetes audit but it is thought that these will be in the minority
due to the age-related prevalence of the condition. Consequently, due to the time constraints of the
project, the evidence base describing potential alternative PROMs for paediatrics with diabetes was
EEPRU NCA Appendix E, Diabetes
Page 18
4.3 Evidence foreconomic evaluations in diabetes (WP1.3)
4.3.1 Cost-effectiveness modelling approach used in recent HTAs in diabetes
Ten technology appraisals (TAs) relating to diabetes were identified from the searches. A CG was
subsequently identified from the references lists of the included studies.(27) Two of the TAs were
superseded by rapid reviews of the evidence,(28;29) one was withdrawn (see clinical guideline (CG)
87),(30) and one was suspended due to licence withdrawal.(31) All the TAs were in T2DM. The CG
and four single technology appraisals (STAs) compared insulin therapies,(27;32-35) and the
remaining two STAs compared interventions for diabetic related macular oedema.(36;37) One
examined the clinical and cost-effectiveness of a pharmaceutical intervention,(28;29) while the
other examined the clinical and cost-effectiveness of an intravitreal implant (Table 3).(28;29)
The models comparing insulin therapies were generally constructed around the United Kingdom
Prospective Diabetes Study (UKPDS), using individual patent level simulation Markov models
comprising of discrete health states representing micro and macrovascular diabetic complications
(Figure 1).(20) Clinical trial data were used together with UKPDS risk functions to describe the
clinical effects of the interventions. UKPDS risk functions are available for congestive heart failure,
ischaemic heart disease, myocardial infarction, stroke, blindness, ulcer, amputation, and renal
failure.(20) The variables required to use the functions included: HbA1c, BMI, systolic blood pressure
(SBP), high-density lipoprotein (HDL-c), low-density lipoprotein (LDL-c), white blood cell,
haemoglobin, heart rate, epidermal growth factor receptor, presence of micro/macro albuminuria,
atrial fibrillation and peripheral vascular disease. Markov models were used for both macular
oedema interventions and the discrete health states were defined using severity grades based on
best corrected visual activity (BCVA),(36) or visual acuity scores (Figure 2).(37) Effectiveness of the
interventions was modelled using clinical trial data which provided evidence of changes in either
BCVA or visual acuity scores.
All studies quality adjusted survival by assigning mean utility values to the discrete health states.
The models comparing insulin interventions used EQ-5D evidence predominantly sourced from the
UKPDS.(20) Exceptions were the disutilities associated with weight changes and hypoglycaemic
events (which are not included in the UKPDS). Conversely, the utilities used in the models
comparing interventions for diabetic macular oedema were modelled using regressions which
mapped from the clinical variables (BCVA, visual acuity scores) to HRQoL data (EQ-5D, non-societal
EEPRU NCA Appendix E, Diabetes
Page 19
changes in disease severity (measured using visual acuity scores) and utilities (measured using
EEPRU NCA Appendix E, Diabetes
[image:21.842.110.650.115.387.2]Page 20
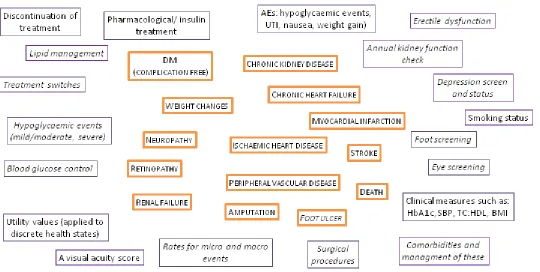
Figure 1: Modelling approach used in the diabetes HTAs
EEPRU NCA Appendix E, Diabetes
[image:22.842.73.782.81.387.2]Page 21
22
It was noted in several evidence review group (ERG) reports that the key areas of uncertainty in the
models comparing insulin control were the HRQoL parameters used for hypoglycaemic events and
treatment related changes in weight. In the models exploring interventions for diabetes related
visual acuity, the cost-effectiveness estimates were also noted to be sensitive to the utility values
used. The EQ-5D may not be sensitive to changes in sight and thus not appropriate for this condition
[image:23.595.69.524.221.773.2](as discussed above).(4;26)
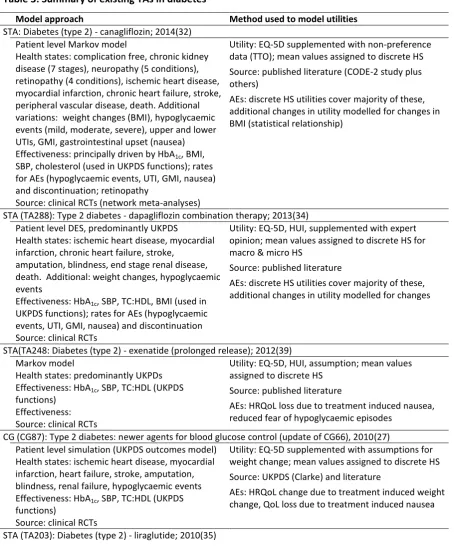
Table 3: Summary of existing TAs in diabetes
Model approach Method used to model utilities
STA: Diabetes (type 2) - canagliflozin; 2014(32) Patient level Markov model
Health states: complication free, chronic kidney disease (7 stages), neuropathy (5 conditions), retinopathy (4 conditions), ischemic heart disease, myocardial infarction, chronic heart failure, stroke, peripheral vascular disease, death. Additional variations: weight changes (BMI), hypoglycaemic events (mild, moderate, severe), upper and lower UTIs, GMI, gastrointestinal upset (nausea) Effectiveness: principally driven by HbA1c, BMI,
SBP, cholesterol (used in UKPDS functions); rates for AEs (hypoglycaemic events, UTI, GMI, nausea) and discontinuation; retinopathy
Source: clinical RCTs (network meta-analyses)
Utility: EQ-5D supplemented with non-preference data (TTO); mean values assigned to discrete HS Source: published literature (CODE-2 study plus others)
AEs: discrete HS utilities cover majority of these, additional changes in utility modelled for changes in BMI (statistical relationship)
STA (TA288): Type 2 diabetes - dapagliflozin combination therapy; 2013(34) Patient level DES, predominantly UKPDS
Health states: ischemic heart disease, myocardial infarction, chronic heart failure, stroke,
amputation, blindness, end stage renal disease, death. Additional: weight changes, hypoglycaemic events
Effectiveness: HbA1c, SBP, TC:HDL, BMI (used in
UKPDS functions); rates for AEs (hypoglycaemic events, UTI, GMI, nausea) and discontinuation Source: clinical RCTs
Utility: EQ-5D, HUI, supplemented with expert opinion; mean values assigned to discrete HS for macro & micro HS
Source: published literature
AEs: discrete HS utilities cover majority of these, additional changes in utility modelled for changes
STA(TA248: Diabetes (type 2) - exenatide (prolonged release); 2012(39) Markov model
Health states: predominantly UKPDs Effectiveness: HbA1c, SBP, TC:HDL (UKPDS
functions) Effectiveness: Source: clinical RCTs
Utility: EQ-5D, HUI, assumption; mean values assigned to discrete HS
Source: published literature
AEs: HRQoL loss due to treatment induced nausea, reduced fear of hypoglycaemic episodes
CG (CG87): Type 2 diabetes: newer agents for blood glucose control (update of CG66), 2010(27) Patient level simulation (UKPDS outcomes model)
Health states: ischemic heart disease, myocardial infarction, heart failure, stroke, amputation, blindness, renal failure, hypoglycaemic events Effectiveness: HbA1c, SBP, TC:HDL (UKPDS
functions)
Source: clinical RCTs
Utility: EQ-5D supplemented with assumptions for weight change; mean values assigned to discrete HS Source: UKPDS (Clarke) and literature
23
Markov model
Health states: micro & macrovascular complications, hypoglycaemic events Effectiveness: HbA1c, SBP, TC:HDL, BMI
Source: clinical RCTs
Utility: EQ-5D predominantly; mean values assigned to discrete HS
Source: Clarke et al UKPDS, supplemented by published literature
AEs: HRQoL change due to treatment induced weight change, HRQoL loss due to hypoglycaemic events STA (TA301)a: Diabetic macular oedema - fluocinolone acetonide intravitreal implant; 2013(36)
Markov model used to extrapolate beyond the RCT duration (i.e. at 3 years)
13 discrete health states defined by 5 ETDRS bands of the BCVA in the treated eye, plus death
Effectiveness: improvement in ETDRS criteria Source: clinical RCTs
Utility: TTO and SG from patients with AMD; mean values assigned to discrete HS
Source: TTO exercise with 72 patients with AMD Values are for the BCVA in the best seeing eye AEs: disutility due to AEs (cataract development, raised intraocular pressure) not modelled STA (TA274)b: Macular oedema (diabetic) - ranibizumab; 2013(36)
Markov model (cohort)
8 discrete health states defined by visual acuity scores (0-25; 26-35; 36-45; 46-5; 56-65; 66-75; 76-85; 86-100 letters) plus death
Effectiveness: change in visual acuity Source: clinical RCTs
Utility: EQ-5D; regression between visual acuity scores and EQ-5D; mean values assigned to discrete HS
Source: published literature
AEs: disutility due to treatment toxicity not modelled HS: health states; AEs: Adverse Events; STA: Single Technology Appraisal; TA: Technology Appraisal; CG: Clinical Guideline; TTO: Time trade-off; SG: Standard Gamble, RCT: randomised controlled trial; BCVA: best corrected visual activity; AMD: age-macular degeneration; PLS: patient level simulation; GMI: genital mycotic infection; UTI: urinary tract infection; ETDRS: Early Treatment of Diabetic Retinopathy Study eye chart, DES: discrete event simulation; TC: total cholesterol; BMI: body mass index; SBP: systolic blood pressure; UKPDS: United Kingdom Prospective Diabetes Study; HbA1c: glycated haemoglobin; HUI; health
utility index; CG: clinical guidelines; TC:HDL: ratio of total cholesterol to high density lipoprotein
a
details on modelling approach taken from TA271 as TA301 review this model and do not construct a new model. bdetails on modelling approach taken from TA237 as TA274 review this model and do not construct a new model
Diabetes is a complex disease and patients are at risk of multiple diabetes related complications.
The existing economic evaluations described above cover just a proportion of the possible health
states in a typical clinical pathway. Areas not explored or modelled in detail include (for example)
leg ulcers, erectile dysfunction, surgical interventions, annual screening for complications, day to day
management of diabetes, management of diabetes when hospitalised for comorbidities etc. Many
of these may have implications in terms of comparing providers or policies. Although not intended
to be exhaustive, examples of the evidence required to extend the economic approach beyond what
is explored in the existing models are provided in Figure 1 above.
The following core evidence would be required to compare providers or the cost-effectiveness of
interventions for diabetes:
Blood glucose control
Clinical variables used in the UKPDS functions (HbA1c, SBP, ratio of total cholesterol to high
24
Both micro and macro vascular events (e.g. ischaemic heart disease, chronic heart failure, renal failure, peripheral vascular disease)
Surgical procedures (type of intervention (e.g. revascularisation, amputation), success rate, post-surgical complication, length of stay etc)
Pharmaceutical interventions (type of intervention, concomitant medications, adverse events)
Screening uptake and results (foot, eye, etc)
Utility values (collected alongside condition severity and surgical interventions)
Death rates (diabetes related, all cause)
The majority of this evidence would need to be linked through timings of collection.
4.3.2 Fields collected in the core diabetes NCAs
The National Diabetes Audit integrates data from both primary and secondary care sources from all
patients (irrespective of age) diagnosed with diabetes (all types of diabetes mellitus, excluding
gestational diabetes, impaired glucose tolerance, impaired glucose fasting) in England and Wales.
Participation in the audit is voluntary for primary care but all trusts with specialist diabetes services
in England and Wales are expected to participate in the audit. It is understood that the audit is
currently expanding to gather information on: pregnancy care in women with diabetes, and diabetes
footcare, and these are discussed below.(40)
Details of the fields in the core diabetes NCA are provided in two documents. There are very few
mandatory fields (NHS number, NHS organisation code, diabetes type, date of diagnosis, GP practice
code, sex, date of birth, postcode), and records which do not collect the full complement of
mandatory fields are rejected (Table 4).(40) However, in the optional fields, there is an exhaustive
list of codes for different diabetes diagnoses with and without diabetes related complications, and a
list of fields providing clinical parameter levels such as HbA1c, cholesterol, BMI etc. (Table A9,
Appendix). If these can be obtained from GP patient records automatically, this increases the
evidence available from the audit considerably.
There is also a National Diabetes Inpatient Audit, which includes a Patient Experience questionnaire
and an associated Bedside Audit form (Table A9, Appendix). The information collected provides a
25
to the support and services received. The proposed objective of this audit is to use the results to
improve inpatient experience. The bedside audit collects information (completed by the nurse)
T
questionnaire (completed by the patient) collects information relating to staff seen, ability to
provide their own diabetes care (insulin and testing of blood sugar levels), the appropriateness and
hospital staff.
Table 4: Mandatory fields collected in the core diabetes NCA
PATIENT DEMOGRAPHIC/OBSERVATION DATAa
NH“ D O P G
PROVIDER INFORMATIONa
GP practice code, NHS organisation code (provider code)
CLINICAL HISTORYa
Date of diagnosis (diabetes), Diabetes type (e.g. Type 1, Type 2, MODY, other specified, not specified)
OBSERVATIONSa
No mandatory fields
(Multiple clinical variables in optional data e.g. BMI, BP, Cholesterol, HbA1c etc. See Appendix)
2 CODESb
Diabetes mellitus diagnosis (plus multiple combinations of complications, e.g. DM with no complication, DM with hyperosmolar coma, DM with renal manifestation, DM with ophthalmic manifestation, DM with peripheral circulatory disorder; Insulin dependent DM with gangrene, Insulin dependent DM with nephropathy, Insulin dependent DM with hypoglycaemic coma, Insulin dependent DM with diabetic cataract, Non-insulin Insulin dependent DM with ulcer, T2DM with multiple complications etc) Latest diagnosis code of diabetes mellitus (multiple combinations as above)
NHS, nation health service: GP: general practitioner; MODY: maturity onset diabetes of young; DM, diabetes mellitus; BMI, body mass index; BP, blood pressure; HBA1C, glycated haemoglobin; T2DM, type 2 diabetes
mellitus
a
National Diabetes audit CSV Specification 2012-2013 V5.0 01/05/2013; bNDA Primary care extraction specification 2012-2013 (linked to primary care records unless patient dissents)
4.3.3 Comparing fields in diabetes NCA with variables used in existing HTAs
The existing HTA models comparing insulin therapies use the UKPDS risk functions to model the
benefits of treatments in terms of reductions in both micro and macrovascular complications. The
key variables (HbA1c, BMI, SBP) required for the functions are noted as optional fields in the current
core diabetes NCA (Appendix). While many of the variables required are not currently listed, they
may be available from GP records via the primary care audits. However, it is not clear if a key
variable (frequency and severity of hypoglycaemic events) is recorded anywhere.
The existing HTA models comparing interventions for diabetes related visual acuity use a clinical
grading measure (e.g. BCVA) to describe health states within the model, and changes in these to
26
eye screen attendance, there is no information which suggests that the results of eye screens are
recorded in the NCA, or that presence or severity of macular oedema is recorded.
No patient reported outcome measures are currently collected in the core diabetes NCA. However,
it is understood that there are two additional new components currently being piloted. The Patient
E D “
services (initial results due June 2014), and the National Diabetes Foot Care Audit will explore: if
nationally recommended care structures for management of diabetic foot disease are in place, if the
treatment of active diabetic foot disease complies with national guidance, and if the outcomes of
diabetic foot disease are optimised (due to launch Summer 2014). It is possible that these audits will
enhance the existing fields with information directly relating to patient experience. However, there
are currently no fields relating to HRQoL or any alternative measure which could be used to generate
the preference-based data required to inform cost-effectiveness models.
While it is possible that many of the utility values required for economic evaluations will be available
from the literature, the inclusion of a preference-based HRQoL measure (preferably the EQ-5D) in
the diabetes audits would be useful for gaps in the evidence base such as HRQoL associated with
hypoglyceamic events and vision. For patients with diabetes related visual acuity, it would be
beneficial to include a variable (such as the VFQ-25, BCVA, or visual acuity score) to grade this
condition, and potentially the EQ-5D vision bolt-on. The variable used should be selected on the
basis that it could ultimately be used to weight survival to generate quality adjusted life years
(QALYs) (for example via a mapping mechanism). Finally, with the exception of attendance on the
DESMOND programme, the core NCA does not include any information on interventions or
procedures received. However, both the current patient experience questionnaire and the diabetes
inpatient audit contain numerous questions relating to diabetic complications, control, prescribing
and drug management errors, intravenous insulin infusions, involvement of specialist diabetes
teams, and general foot care, all of which would be useful information for economic evalutions.
Depending on the level of responses collected in the inpatient audit, with additional fields added, it
is possible that the diabetes NCA could be used to compare providers and the cost-effectiveness of
interventions. With the exception of the two additional audits currently being piloted, the existing
diabetes inpatient audit, and the patient experience of diabetes services audit, no ongoing or
scheduled research in the area of PROMs for the diabetes NCA are known.(40)[personal
27
4.4 Recommendations for diabetes
In general, the EQ-5D appears to be adequate in patients with diabetes, and based on the
diabetes audit
collects much of the information required to conduct economic evaluations. The exceptions in both
cases are in patients with visual problems, and information relating to HbA1c and hypoglycaemic
events. Potential recommendations (PR) and areas for future research (FR) are discussed below. All
suggested future research areas are indicative and would require a discussion and detailed proposal
if required.
As the NCA for diabetes covers both primary and secondary care, this will involve patients across the
full spectrum of the condition, from newly diagnosed patients to patients with long standing
diabetes with complications such as end stage renal disease. While there is no suggestion that the
EQ-5D suffers from a floor effect in this patient group, the suggested ceiling effect could be
problematic for newly diagnosed patients with no diabetic related complications. It is
recommended that consideration is given to the inclusion of the EQ-5D in all the different diabetes
audits (i.e. adapting the current
care setting) if possible to capture HRQoL scores across the full spectrum of the condition (PR.1). As
mentioned in previous sections, the use of the EQ-5D-5L, could potentially reduce any ceiling effect
in patients less severely affected by the condition. The psychometric properties of this instrument
would need to be assessed in patients with diabetes (FR.1).This study would require the concurrent
collection of a measure against which the EQ-5D could be compared, together with additional
information such as patient demographs, diabetic related complications (micro and macrovascular),
hypoglycaemic events, clinical variables (e.g. HbA1c) and current medications etc. It is
recommended that the DHP (see Section 3.2) is collected alongside the EQ-5D to capture issues
relating to daily management of the condition (PR.11).
A potential solution to possible issues in capturing changes in HRQoL in patients with vision
problems (such as diabetes related macular oedema), might be the use of a bolt-on to the EQ-5D
(PR.12 T -on
the standard five questions in the EQ-5D. Exploratory research eliciting preferences using time
trade-off (TTO) methods from a sample of the UK population demonstrated this methodology could
potentially have a significant effect upon EQ-5D valuations. However, due to limitations such as the
relatively small sample size, the authors recommend additional research in larger samples is
28
variable such as the VFQ-25, BCVA or visual acuity score would enhance this evidence in terms of
usefulness in future economic models (PR.2). Some evidence exists which could potentially be used
to link these measures to utilities, depending on which clinical measure and which preference-based
measure was used in the audit.(41;42)
As discussed previously, the DH PROMS use the DHP which captures the day to day issues relating to
managing diabetes. Hypoglycaemic events are a common consequence of insulin and weekly rates
have been estimated at 0.82 and 0.33 for Type 1 and insulin-treated T2DM respectively.(43)
Hypoglycaemic episodes can range from benign (remedied by eating fast-acting carbohydrates), to
seizure, coma and even death.(44) Severe or frequent hypoglycaemic events can be traumatic for
patients with diabetes. Preference-based HRQoL data from people who experience these events,
and the impact on HRQoL associated with the fear of a future hypoglycaemic events are particularly
sparse (Section 6.2). A study using data collected in the NCA exploring these issues would add
considerably to the existing evidence base in this area and would inform future economic models in
the UK and wider settings (FR.3).
Although in the minority, it is believed there will be some paediatrics in the diabetes audit. As in the
previous sections, it is recommended that consideration is given to the inclusion of paediatric
preference-based HRQoL questionnaires (PR.4), which again would require a primary piece of
research to assess the psychometric properties in children with diabetes (FR.4).
While it is understood that the primary and secondary care audits could potentially be linked, and
that additional detail from the GP records could be obtained, this is by no means clear. In addition,
it is not clear if these would suffice to provide information on variables such as HbA1c, BMI, SB,
HDL-c, LDL-HDL-c, white blood cell, haemoglobin, etc. which are the key clinical variables used in
cost-effectiveness models in diabetes. It is also not clear if it would be possible to link these to current
treatment. A thorough inspection of the audit data would answer many of these queries and enable
a more robust assessment of what would be required to perform economic evaluations with the
29
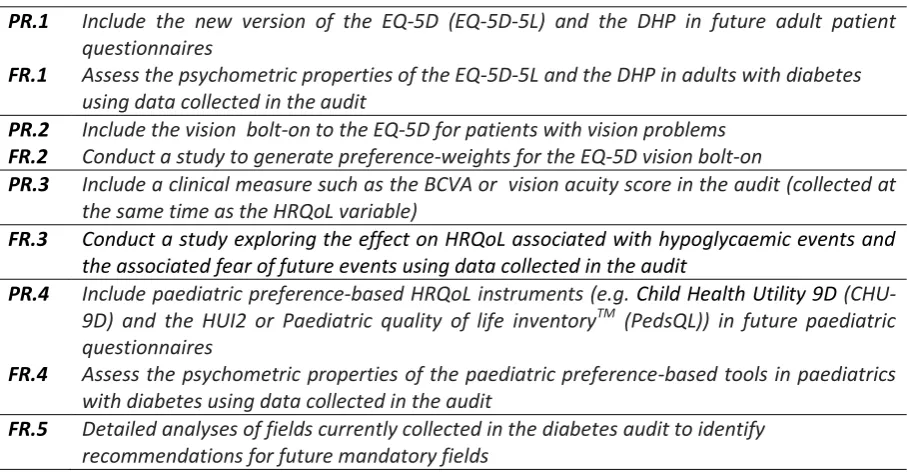
Table 5: Recommendations and associated future research for diabetes
PR.1 Include the new version of the EQ-5D (EQ-5D-5L) and the DHP in future adult patient questionnaires
FR.1 Assess the psychometric properties of the EQ-5D-5L and the DHP in adults with diabetes using data collected in the audit
PR.2 Include the vision bolt-on to the EQ-5D for patients with vision problems FR.2 Conduct a study to generate preference-weights for the EQ-5D vision bolt-on
PR.3 Include a clinical measure such as the BCVA or vision acuity score in the audit (collected at the same time as the HRQoL variable)
FR.3 Conduct a study exploring the effect on HRQoL associated with hypoglycaemic events and
the associated fear of future events using data collected in the audit
PR.4 Include paediatric preference-based HRQoL instruments (e.g. Child Health Utility 9D (CHU-9D) and the HUI2 or Paediatric quality of life inventoryTM (PedsQL)) in future paediatric questionnaires
FR.4 Assess the psychometric properties of the paediatric preference-based tools in paediatrics with diabetes using data collected in the audit
FR.5 Detailed analyses of fields currently collected in the diabetes audit to identify recommendations for future mandatory fields
5. SUMMARY
5.1 Summary of evidence used to inform the conclusions for WP1.1 and WP1.2
A reanalysis of an existing review (n=16 primary studies) provided evidence that the acceptability
and reliability of the EQ-5D are good (Table 6). There was some evidence of ceiling effects which
may affect responsiveness in newly diagnosed diabetics and those without complications. Construct
validity was generally good when compared to diabetes specific and generic quality of life measures,
with a few exceptions, most notably in vision. Problems with the EQ-5D in vision have been noted
els - EQ-5D. It is
recommended this is used alongside the EQ-5D. Paediatric measures were not reviewed due to time
constraints and a low prevalence of diabetes in this population.
Table 6: Summary of evidence supporting the psychometric properties of EQ-5D in all conditions
Condition Measure N Acceptability Reliability Construct Responsiveness Overall KGV Convergent Change
over time
Ceiling Effect
Diabetes EQ-5D 16 Good Good Good Mixed Good Poor Acceptable* Diabetes
(daily
management)
DHP The recommendation is based on those in PBR [DH2013] and the psychometric properties of this measure have not been reviewed in the current report Diabetes
(vision)
EQ-5D vision bolt on
This measure requires additional validation in a large dataset
[image:30.595.64.555.616.757.2]30
5.2 Summary of evidence required for use in economic evaluations (WP1.3)
The existing audit does not include a patient questionnaire. A patient reported experience measure
(PREM) focussed questionnaire for patients receiving secondary care is currently being piloted,
although this is not believed to cover patients treated in primary care. The evidence collected in this
questionnaire will be useful when comparing providers. There is a relatively large evidence base on
preference-based data in patients with diabetes which could be used to inform formal economic
models. However, there are gaps in this evidence where data collected in the audit would be
beneficial. In particular, for patients with diabetes related vision conditions and to capture the
HRQoL associated with hypoglycaemic events. The audit collects much of the evidence required to
conduct formal economic evaluations and if the inpatient data could be linked to GP records this
would expand the evidence available considerably. There would remain some issues relating to the
timing of the data collection, but it is believed that these data could be used to inform formal
economic evaluations.
In summary, while the evidence collected in the individual audits will allow comparison of providers
in many cases, it is clear that the mandatory fields in most of the audits will not provide sufficient
detailed information to perform formal economic evaluations. The main omission is the lack of
PROMs which limits the flexibility of the data in terms of comparing either providers or interventions
used in routine clinical practice. However, many of the audits contain optional fields which would be
useful for economic evaluations and enforcing the collection of key variables is recommended in
many of the audits. A recurrent issue relates to the level of detail collected and the timing of the
variables collected. To be useful for economic evaluations, many of the variables used have to be
synchronised in terms of timing of collection, and many need to be collected over periods of time to
assess progression or relapse etc. An additional key issue which arises throughout many of the
reviews is the collection of information relating to side effects of pharmaceutical interventions and
adverse events associated with surgical procedures. The audits could provide valuable information
31 APPENDIX: DIABETES
The tables in this Appendix provide additional information for the reviews (WP1.1, 1.2 and 1.3)
[image:32.595.68.535.200.519.2]conducted for diabetes.
Table A1: Quality assessment of Janssen et al. review of EQ-5D in diabetes(2)
Quality assessment criteria Compliance with criteria AMSTAR
Was an a priori design provided? Yes Was there duplicate study selection and data extraction?
Unclear Were the methods used to combine the findings of
the studies appropriate?
Unclear Was the scientific quality of the included studies
assessed and documented?
Unclear Was the scientific quality of the included studies used
appropriately in formulating conclusions?
Unclear
Overall judgement of quality of review Mostly unclear quality
Quality of the searches Acceptable
Strength of the evidence
Were the conclusions robust and conclusive? No, evidence was mixed and limited
Quantity of the evidence
Was there enough data to be confident that any additional data published subsequently would be very unlikely to change the conclusions drawn?
yes
Adequacy of data reported
Did the review provide sufficient data to allow integration of an update/assessment of the methods used?
No Did the review assess EQ-5D in a way compatible with the aims of work package 1.1?