GODT, M. W. J., J. L. HAMRICK and S. BRATON (1995): Genetic diversity in a threatened wetland species, Hel-lonias bullata(Liliaceae). Conserv. Biol. 9, 596–604. GRIME, J. P., J. G. HODGSONand D. R. HUNT(1988):
Com-parative plant ecology: a functional approach to com-mon British species. Unwin Hyman, London.
HAMRICK, J. L., M. J. W. GODTand S. L. SHERMAN-BROYLES (1992): Factors influencing levels of genetic diversity in woody plant species. New For. 6, 95–124.
HAMRICK, J. L. and J. D. NASON(1996): Consequences of dispersal in plants, pp. 203–236 in Population dynamics in ecological space and time, edited by O. E. RODHES, R. K. CHESSERand M. H. SMITH, University of Chicago Press, Chicago.
HARTL, D. L. and A. G. CLARK(1989): Principles of popula-tion genetics. 2nd ed. Sinauer Associates, Sunderland,
Massachusetts.
HEDRICK, P. W. (2000): Genetics of populations. 2nd ed.
Jones and Bartlet Puublishers, Sudbury, Massachu-setts.
HUENNEKE, L. F. (1991): Ecological implications of varia-tion in plant populavaria-tions, pp. 31–44 in Genetics and Conservation of Rare Plants, edited by D. A. FALKand K. E. HOLSINGER, Oxford University Press, New York. LESSICA, P. and F. W. ALLENDORF(1992): Are small
popula-tions of plants worth preserving? Conserv. Biol. 6, 135–139.
MCCAULEY, D. E. (1994): Contrasting the distribution of chloroplast DNA and allozyme polymorphism among local populations of Silene alba: implications for studies of gene flow in plants. Proc. Natl. Acad. Sci. USA. 17, 8127–8131.
MCCAULEY, D. E. (1997): The relative contributions of seed and pollen movements to the local genetic struc-ture of Silene alba. J. Hered.88, 257–263.
KRZAKOWA, M. and L. BEDNORZ(1999): Electrophoretic evi-dence of monomorphism in the Wild Service Tree, Sor-bus torminalis (L.) Crantz population from ‘Bytyn´skie Brze˛ki’ preserve (western Poland). Rocz. Dendrol. 47, 45–51.
NEI, M. (1978): Estimation of average heterozygosity and genetic distance from a small number of individuals. Genetics 89: 583–590.
ODDOU-MURATORIO, S., B. LE GUERROUE, D. GUESNET and B. DEMESURE (2001): Pollen-versus seed mediated gene flow in a scattered forest tree species. Evolution 55, 6, 1123–1135.
OOSTERMEIJER, J. G. B., M. W. VANEIJCKand J. C. M. DEN NIJS (1994): Offspring fitness in relation to population size and genetic variation in the rare perennial plant species Gentiana pneumonanthe (Gentianaceae). Oecologia 97, 289–296.
PETIT, R. J., I. AGUINAGALDE, J. L. DE BEAULIEU, C. BIT -TKAU, S. BREWER, R. CHADDADI, R. ENNOS, S. FINESCHI, D. GRIVET, M. LASCOUX, A. MOHANTY, G. MÜLLER-STARK, B. DEMESURE-MUSH, A. PALMÉ, J. P. MARTIN, S. RENDELL and G. G. VENDRAMIN(2003): Glacial refugia: Hotspots but not melting pots of genetic diversity. Science 3000, 1563-1565.
PRAT, D. and C. DANIEL(1993): Variabilité génétique l’Ali-sier torminal et du genere Sorbus. Rev. For. Fr. 45, 3, 216–228.
RASMUSSEN, K. K. and J. KOLLMANN (2004): Poor sexual reproduction on the distribution limit of the rare tree
Sorbus torminalis. Acta Oecologica 25, 211–218.
RASPÉ, O., A.-L. JACQUEMART and J. DE SLOOVER (1998): Isozymes in Sorbus aucuparia (Rosaceae: Maloideae): genetic analysis and evolutionary significance of zymo-grams. Int. J. Plant Sci. 159, 627–636.
ROTHE, G. M. (1994): Electrophoresis of Enzymes. Springer-Verlag, Berlin Heidelberg New York.
SNOW, B. and D. SNOW(1988): Birds and berries: a study of an ecological interaction. T&AD Poyser, London. WENDEL, J. F. and N. F. WEEDEN(1989): Visualization and
interpretation of Plant Isozymes, pp. 5–45 in Isozymes in plant biology, edited by D. E. SOLTISand P. S. SOLTIS, Dioscorides Press, Oregon.
WOJCIECHOWSKI, A. and L. BEDNORZ(2000): Estimation of mating-compatibility of the wild service tree (Sorbus torminalis(L.) Crantz) by observing pollen tube germi-nation. J. Appl. Genet. 41, 4, 253–258.
WRIGHT, S. (1965): The interpretation of population struc-ture by F-statistics with special regard to systems of mating. Evolution 19, 395–420.
YEH, F. C., R.-C. YANG and T. BOYLE (1999): POPGENE Version 1.31 Microsoft Windows-based Freeware for Population Genetic Analysis. University of Alberta.
Abstract
Parental and consensus maps were constructed in an F2 inter-provenance cross of Eucalyptus globulus, using amplified fragment length polymorphism (AFLP) and microsatellite (or simple sequence repeats [SSR]) mark-ers. The female map had 12 linkage groups and 118 markers, comprising 33 SSR and 85 AFLP loci. The
Parental and Consensus Linkage Maps of
Eucalyptus globulus
Using AFLP and Microsatellite Markers
By J. S. FREEMAN1),*), B. M. POTTS1), M. SHEPHERD2)and R. E. VAILLANCOURT1)
(Received 5thJanuary 2006)
1) Cooperative Research Centre for Sustainable Production
Forestry and School of Plant Science, University of Tasmania, Private Bag 55, Hobart, Tasmania 7001, Australia.
2) Cooperative Research Centre for Sustainable Production
Forestry, Centre for Plant Conservation Genetics, Southern Cross University, NSW 2480, Australia.
male map had 14 linkage groups and 130 markers com-prising 36 SSR and 94 AFLP loci. The integrated map featured 10 linkage groups and 165 markers, including 33 SSR and 132 AFLP loci, a small 11thgroup was
iden-tified in the male parent. Moderate segregation distor-tion was detected, concentrated in gender specific groups. The strongest distortion was detected in the female parent for which causal mechanisms are dis-cussed. The inclusion of SSR markers previously mapped in several different eucalypt species within the subgenus Symphyomyrtus (E. globulus, E. camaldulen-sis, and predominantly E. grandis and E. urophylla), allowed comparison of linkage groups across species and demonstrated that linkage orders previously reported in
E. globulus, E. grandis and E. urophylla were largely conserved.
Key words: Linkage map, Eucalyptus globulus, SSR, AFLP, comparative mapping.
Introduction
Eucalyptus globulus is one of the most commercially important plantation tree species in temperate regions of the world (ELDRIDGE et al., 1993). As a result, breed-ing programmes have been established in order to pro-duce genetically superior E. globulustrees (POTTSet al., 2004). Linkage maps and associated molecular markers can be useful in tree improvement programmes as pre-requisites for the study of quantitative traits using the quantitative trait loci (QTL) approach (GRATTAPAGLIA, 1997, 2000; AHUJA, 2001). Consequently, linkage maps have been produced for many forest tree genera of eco-nomic importance including Eucalyptus (e.g. BYRNE et al., 1995), Pinus(e.g. PLOMIONet al., 1995), Poplar(e.g. BRADSHAWand STETTLER, 1994) and Acacia(BUTCHERet al., 2002).
Molecular maps produced in tree species have employed a variety of DNA marker classes, each having their merits (reviewed by CERVERA et al., 2000). For example, AFLP (VOS et al., 1995) are anonymous and dominant markers, based on arbitrarily selected PCR primers that require no a priori sequence knowledge, primer or probe development. The AFLP technique has the highest multiplex ratio of any PCR based technique (MYBURG et al., 2001), allowing the production of high coverage parental maps in various plants including interspecific crosses of eucalypts such as E. tereticornis x
E. globulus (MARQUES et al., 1998) and E. grandis x E. globulus (MYBURG et al., 2003). However, dominant markers will predominantly be mapped to one parent, hence often co-dominant markers must be included to merge parental maps (GRATTAPAGLIA, 2000). Similarly, the transferability of AFLP is often low, even within species (CERVERAet al., 2000).
SSR markers have many attributes suitable for map construction (CERVERAet al., 2000). They are multi-allel-ic, usually highly polymorphic and co-dominant in their inheritance (AVISE, 1994). However SSR markers require considerable investment in primer development, limiting their availability. For example, the limited availability of SSR primers for Eucalyptus has, until recently, made the construction of maps based solely on these markers unfeasible. In order to remedy this
prob-lem, AFLP markers can be used to provide high density maps upon which to map co-dominant markers, such as SSRs (e.g. CERVERAet al., 2001).
Importantly, SSRs are often highly transferable between pedigrees and species (JONES et al., 2001; STEANEet al., 2001; MARQUESet al., 2002), allowing inte-gration of parental maps, comparative mapping and ultimately the construction of species consensus maps (GRATTAPAGLIA, 2000). The comparison of genetic linkage maps based on a common set of markers allows the identification of homologous loci and collinear chromo-some segments between species. Comparative maps have demonstrated a high degree of co-linearity for numerous plant species including tomato and pepper, wheat and rice, and pine species Pinus taedaand Pinus radiata(AHUJA, 2001). Similarly, in eucalypts, the map-ping of interspecific hybrid progeny has allowed the demonstration of a high degree of synteny between maps of E. grandis and E. urophylla (BRONDANI et al., 1998; 2002), E. grandisand E. globulus(MYBURGet al., 2003), and E. grandis, E. urophylla, E. tereticornisand
E. globulus (MARQUES et al., 2002). The apparent genome conservation between many of the economically important eucalypt species within the subgenus Sym-phyomyrtus suggests that the construction of a consen-sus map for the subgenus will be attainable (BRONDANI et al., 2002; MARQUESet al., 2002).
Comparative mapping and ultimately the construction of a consensus map for the genus will be invaluable for molecular breeding and more fundamental research, such as studying genome evolution and genetic differen-tiation in Eucalyptus. In the area of molecular breeding, comparative mapping would enable the exchange and comparison of information between studies world-wide in areas such as QTL mapping, candidate gene mapping and marker assisted selection (BRONDANIet al., 2002). In particular, comparative mapping will allow the valida-tion of putative QTL over different genetic backgrounds (e.g. MARQUESet al., 2002), providing a basis for effec-tive marker assisted selection (MAS) (BRONDANI et al., 2002).
the F1parents from a wide intraspecific cross. The wide-ly separated provenances of origin and three generation design of this cross promotes polymorphism by captur-ing the differences between eucalypt populations. The increased polymorphism increases the likelihood of QTL segregating in this pedigree.
The aim of this study was to produce parental and consensus maps in an outbred, F2interprovenance cross of E. globulus, using AFLPs and predominantly fully informative SSR loci. The mapping of fully informative SSR loci derived from a variety of sources (EMBRA, CSIRO, EMCRC), allowed comparison of synteny and collinearity of shared markers between this study and maps previously produced in a range of eucalypts from the subgenus Symphyomyrtus (BRONDANI et al., 1998, 2002; BUNDOCK et al., 2000; MARQUES et al., 2002; THAMARUS et al., 2002). As such, these maps provide a contribution toward the production of reference maps for
E. globulus and the subgenus. The linkage maps pro-duced in this study will also be used to investigate marker trait associations (QTL) for the genetic control of important economic traits, including resistance to fun-gal pathogens from the genus Mycosphaerella.
Molecular methods
Plant material
The mapping population consisted of an outbred, F2 full sib family derived from an inter-provenance cross. The four grandparents were from two widely separated locations in Tasmania – King Island, situated to the northwest of Tasmania and Taranna in the far south-east (Fig. 1). Trees from these locations are classified into different geographical races, differentiated by numerous quantitative traits (DUTKOWSKI and POTTS, 1999). Crossing between unrelated grandparents from King Island and Taranna produced each F1, which were then crossed to produce the F2(Fig. 2). These grandpar-ents were chosen in order to maximise the segregation of quantitative characters that differ between prove-nances, such as resistance to Mycosphaerella sp.
(CARNEGIEet al., 1994). Seedlings were planted in a ran-domised incomplete block design, at Woolnorth in north-west Tasmania in May 1998. Originally 240 genotypes from the cross were planted with 160 genotypes
repre-sented by two clonal replicates. This cross suffered a high mortality (28 %), and leaf tissue was collected in April 2001, only from the 121 different F2 genotypes that had both clonal replicates surviving.
Total genomic DNA was extracted from 1 g of fresh leaf tissue, using a CTAB extraction protocol (DOYLEand DOYLE, 1990). Following extraction, DNA samples were cleaned using Prep-a-Gene matrix purification (Bio-Rad). DNA concentration and purity were estimated using agarose gel electrophoresis with ethidium bromide staining, by comparison with a standard molecular weight marker (lambda HindIII). Samples were diluted 1:4 in de-ionised water for PCR amplification.
SSR Analysis
The parents of the mapping cross were initially screened with three sets of SSR primers: 233 from EMBRA (BRONDANIet al., 1998; 2002), 13 from EMCRC (STEANE et al., 2001) and 34 from CSIRO (BYRNE et al., 1996 and http://www.ffp.csiro.au/tigr/molecular/ eucmsps.html). Loci segregating in both parents were preferentially selected to screen the progeny of the map-ping cross. The details of primer sequences and reagents for the EMCRC SSRs are those given by STEANE et al. (2001) and conditions for the CSIRO SSRs are given by BYRNEet al. (1996). All SSR PCR reactions were carried out in 12.5 µl (final volume) reactions. The volume of each primer was elevated from 0.2 µM to 0.3 µM/reac-tion for the CSIRO SSRs. The PCR reagents used for the amplification of the EMBRA microsatellites are essen-tially those of BRONDANIet al. (1998) with the following modifications: 0.1% Triton X-100, 0.1 mg/mL BSA and no DMSO. Primer sequences and recommended anneal-ing temperatures for EMBRA loci 1-20 are given by BRONDANI et al. (1998), for EMBRA 21-70 by BRONDANI et al. (2002) and for EMBRA 75–240 by BRONDANI (2001). EMCRC primers were synthesised with a fluo-rescent label (either HEX or TET) attached to the 5’ end to allow detection of PCR products by a Gel Scan 2000 real-time acrylamide gel system (Corbett Research). The EMBRA and CSIRO markers incorporated a fluores-cently labelled dUTP at 0.6 µmol/PCR reaction (Chro-matide™ tetramethylrhodamine-6-dUTP, Molecular Probes) for Gel Scan 2000 detection. PCR reaction condi-tions of microsatellite loci often required optimisation for detection using the Gel Scan 2000, by slight
[image:3.595.362.491.50.163.2]modifi-Figure 1. – Origins of the grandparents of the mapping pedi-gree in Tasmania, Australia.
[image:3.595.48.291.582.731.2]cation of the recommended annealing temperature or MgCl2content (Appendix).
All microsatellite loci were amplified using the same amplification conditions; an initial denaturation step at 94 °C for 2 minutes, followed by 30 cycles of 94 °C for 1 minute, annealing temperature for 1 minute, and an extension step at 72 °C for 1 minute. Following the 30 cycles there was a final extension step of 72 °C for 5 minutes. A ‘touchdown’ PCR was used to enhance the quality of PCR products, with the annealing tempera-ture dropping by 2 °C every 10 cycles. Annealing temper-ature varied within and between primer sets (Appen-dix).
Microsatellite fragments were separated on 15 cm 4 % polyacrylamide gels, using a Gel Scan 2000. Gel analy-sis was performed using Gene Profiler™ software (Scan-alytics, Inc.) by comparison to a Promega (CXR) 60–400 base fluorescent ladder, allowing a semi-automated scor-ing of individuals.
AFLP analysis
The method adopted for AFLP generation essentially followed the protocol of VOS et al. (1995), with minor adjustment for eucalypt DNA after MARQUES et al. (1998). The standard procedures were modified to allow restriction of genomic DNA and ligation of adaptors in a single step, with detection of fragments by a Gel Scan 2000 (see below). The DNeasy plant mini kit (Qiagen) was used to extract total genomic DNA (from 0.1 g of leaf tissue/sample) in order to provide the high purity required for thorough and even restriction of each sam-ple. DNA concentration was estimated by comparison with lambda Hind III DNA standard on 1.5 % agarose gels. Samples were diluted in de-ionised water to 20 ng/µl.
Initially, test cuts were performed with each restric-tion enzyme (EcoRI and MseI) separately to ensure each achieved complete digestion across all samples, assessed by electrophoresis on 1.5 % agarose gels with ethidium bromide staining. The restriction of genomic DNA and ligation of adaptors were performed in a single reaction. In 96 well polycarbonate plates 250 ng of genomic DNA was added to the restriction-ligation mixture and incu-bated at 37 °C overnight. The reagents for the restric-tion-ligation reaction (30 µl final volume) were as fol-lows: 3.9 U EcoRI (ie. 5 U/40 µl) (New England Biolabs), 3.9 U MseI (New England Biolabs), 0.6 U T4 Ligase (Promega), 1 x T4 Ligase buffer (Promega), 1.5 µg BSA, 0.05 M NaCl, 3 pM EcoRI adaptor, 30 pM MseI adaptor.
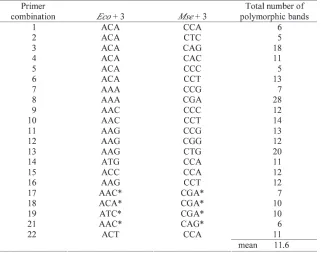
The reagents for pre-selective and selective amplifica-tion were as described by VOSet al. (1995). The thermo-cycling conditions for the pre-selective amplification were adapted from VOSet al. (1995) to promote selectivi-ty (MARQUES et al., 1998). The selective thermo-cycling conditions followed VOS et al. (1995). Primers with the optimum number of selective bases for pre-selective and selective amplification of eucalypt DNA (one and three respectively; MARQUES et al., 1998) were employed for AFLP reactions. Pre-selective primers were from MAR -QUESet al. (1998) (EcoRI +A, MseI +C). Substantial vari-ability in the number of bands produced by different primer combinations (EcoRI +3, MseI +3) in the selec-tive amplification warranted a preliminary screening of 40 primer combinations, including 22 from MARQUESet al. (1998), to allow the most informative to be employed for progeny screening (Table 1). The selectiveEcoRI (+3) primers were fluorescently labelled with TET for detec-tion by the Gel Scan 2000.
[image:4.595.140.464.503.756.2]AFLP samples from the selective amplification were combined with two volumes of formamide B-blue loading
buffer (formamide with the addition of 0.1 mg/mL bro-mophenol blue sodium salt) and denatured for 2 min-utes at 94 °C, then rapidly cooled on ice. Subsequently, AFLP fragments were separated by electrophoresis on 15 cm 6 % denaturing acrylamide gels, using a Gel-Scan 2000 real-time acrylamide gel system. Electrophoresis at 40 °C and 12000 volts for 90 minutes allowed separa-tion of bands ranging from approximately 50–450 bp in size. Bands were scored manually by comparison to a Promega (CXR) 60–400 base fluorescent ladder, utilising Gene Profiler™ software. Only bands that were clear and unambiguous across the entire mapping population were scored. Subsequently, the ‘Match bins’ function of the Database manager within the Gene Profiler™ software was used to automatically generate presence/ absence binary scores for each sample across all scored bands with match tolerance set at 0.5 %. AFLP frag-ments were given a three-point confidence rating denot-ing their quality and ease of scordenot-ing as described by SHEPHERDet al. (2003).
Linkage analysis
Following scoring, all microsatellite and AFLP gels were checked visually for scoring errors. All loci were recoded by their segregation type, according to the cross pollinated coding scheme and separated into male and female datasets for analysis by Joinmap 3.0 (VANOOIJEN and VOORRIPS, 2001). The Joinmap 3.0 package allows the integration of data with various segregation types, and recombination estimates from a variety of sources into a single map (VAN OOIJEN and VOORRIPS, 2001). Each data set included the parental genotypes at all loci (grandparental genotypes and linkage phase informa-tion were not included), with Joinmap 3.0 automatically calculating the linkage phase of each marker when cal-culating pair-wise recombination frequencies.
All loci were tested for goodness of fit to expected Mendelian segregation ratios using Chi-square goodness of fit tests. AFLP loci were expected to follow segrega-tion ratios of 3:1 (each parent heterozygous for the pres-ence of the band) or 1:1 (band heterozygous in one par-ent only). The 3:1 segregating loci were given a classifi-cation code in the locus file to instruct the programme to test for this segregation ratio, allowing for dominance. Most mapped SSR loci were fully informative, segregat-ing in approximate ratios of 1:1:1:1 (either heterozygous in both parents with 3 alleles in total, or heterozygous in both parents with 4 alleles in total). The only mapped SSR loci that followed approximate segregation ratios of 1:1 (heterozygous in only one parent), were EMBRA 6, 78, 197 and EMCRC 2 from the male parent and EMBRA 208 from the female parent.
The Joinmap 3.0 programme initially groups loci that are significantly associated (linked) on the basis of a LOD score. Groupings are derived from the test for inde-pendence of loci in a contingency table, which are then converted to a LOD score (VAN OOIJEN and VOORRIPS, 2001). There is a theoretical basis for selecting associa-tions at different LOD values, based upon genome size and the number of linkage tests (KEATS et al., 1991), however, an intuitive approach is often used in order to select a LOD score at which the contents of most groups
are relatively stable. Joinmap 3.0 is particularly suited to such an approach, by allowing the user to view the stability of groupings over a range of LOD thresholds simultaneously in tree format.
During the mapping procedure, Joinmap 3.0 uses a weighted least squares approach to sequentially build a map from pair-wise data. Within linkage groups, the maximum recombination frequency, and the minimum LOD score determines the stringency of marker order-ing. Selecting a lower recombination frequency and/or higher LOD will increase the stringency of mapping by excluding more loci from the map calculations. Within these parameters, the chi-square jump threshold restricts the allowable increase in ‘goodness-of-fit’ after the inclusion of a particular marker to an existing order. The lower the chi-square jump threshold the greater the stringency of marker ordering, with values of 3-5 recom-mended (VANOOIJENand VOORRIPS, 2001). The genotype probability function indicates the number of genotypes with a low probability, conditional upon the map and surrounding markers, thereby highlighting markers with possible genotyping errors.
Linkage groups in the comprehensive parental maps were assigned with a minimum LOD threshold of 4.0 for the male parent and 3.0 for the female parent. Within linkage groups, marker order was determined using Joinmap 3.0 default values of a minimum LOD thresh-old of 1.0, and a maximum recombination threshthresh-old of 0.4. In order to produce a map with robust marker order, a stringent maximum Chi-square goodness of fit jump threshold of 1.2 was used for all loci with the exception of EMBRA 6 which was placed at 1.8. The Kosambi mapping function was used to determine distance between markers.
parental maps. Final marker orders were accepted when there was agreement between all maps within the desig-nated parameters, giving a high degree of confidence in locus ordering. The numbering of linkage groups 1-11 (where present), in all maps followed BRONDANI et al. (1998, 2002, and unpublished data), in order to facilitate a comparison of linkage group homology.
Genotyping errors can lead to difficulty in locus order-ing and inflated map lengths. In order to detect mis-typed markers, numerous linked loci that exceeded the threshold Chi-square goodness of fit contribution, or dis-played excessive double crossovers (evidenced by low genotype probability), were checked (using the original gel image for SSR loci, or quality rating for AFLP mark-ers) for the robustness of scoring and either excluded from mapping analysis, or added as accessories to indi-cate a lower confidence in their placement relative to framework markers. Accessory markers were located on the parental maps next to their nearest framework marker by their minimum recombination frequency and LOD score. Accessory markers were not included in the integrated linkage map, unless placed as a framework marker in one parent.
Results
Marker analysis
Twenty-one of the 40 AFLP primer combinations screened were employed for genotyping, including 17 from MARQUES et al. (1998) (Table 1). These combina-tions amplified 243 polymorphic bands in total, an aver-age of 11.6 polymorphic bands per primer combination. One hundred and eighty four bands segregated in an approximate 1:1 ratio, comprising 87 from the female parent and 97 from the male parent. Fifty-nine bands segregated from both parents in an approximate 3:1 ratio.
Table 2provides a summary of the results of screening the SSR loci. In total 165 of the 280 loci screened were able to be amplified in this E. globuluscross. The rela-tive success of each set of loci reflected taxonomic dis-tance from the species in which they were developed. Of the EMCRC loci (from E. globulus) 92 % were amplifi-able, compared with only 71% of CSIRO loci (from
E. globulus and the closely related E. nitens), and only 55 % of EMBRA loci, (developed from the more distantly related E. grandis/E. urophylla). Of the 165 amplifiable SSR loci, 24 (15 %) segregated exclusively from the male parent, 19 (12 %) from the female parent only, 87 (53 %) from both parents and were thus fully informative (Table 2), while 35 (21%) were not heterozygous in either parent.
Linkage analysis
For the female parent (G1060; Figure 3a), twelve link-age groups (comprising one or more SSR or at least three AFLP loci) were defined by two-point linkage analysis at a minimum LOD score of 3.0. There were 106 framework markers, with 12 accessory markers added to make the comprehensive map, comprising 33 SSR and 85 AFLP loci (Figure 3a). Eleven markers were unlinked and 65 markers were excluded during map construction, because they did not fit the trusted order within the designated mapping parameters. Total map length was 698.3 cM. Linkage groups ranged in size from 2 cM (group 13), to 97.2 cM (group 1) with the average size being 58.2 cM. The 118 markers mapped to 117 positions separated by 105 intervals with an aver-age size of 6.6 cM. The maximum interval between markers was 33.4 cM (group 5).
For the male parent (G1026; Figure 3b), fourteen link-age groups were defined at a minimum LOD score of 4.0 and comprised three or more loci. Two groups (group 2’;
Figure 3b) correspond to linkage group 2 in the female parent, identified by fully informative SSR that were linked in the female parent and integrated map. These two groups united at LOD 3.0. However, the locus order of the resultant group departed from the established trusted order and was thus not accepted. The 14 linkage groups included 121 framework and 9 accessory mark-ers, comprising 36 SSR and 94 AFLP loci (Figure 3b). Twenty markers were unlinked and 57 markers were excluded during map construction, because they did not fit the trusted order within the designated mapping parameters. Total map length was 775.5 cM, with link-age groups ranging in size from 113.7 cM (group 3) to 6.9 cM (group 9). The average size of linkage groups was 55.4 cM. The 130 markers mapped to 127 positions sep-arated by 113 intervals with an average size of 6.9 cM. The maximum interval between markers was 28.6 cM (group 4).
SSR and AFLP loci segregating from both parents (Table 3) allowed the construction of an integrated map (Figure 3c). The integrated map featured 165 markers in 10 groups with a total map length of 701.9 cM. Thirty-seven of the markers in the integrated map had been placed in both parental maps, comprising 28 SSR and 9 AFLP, allowing the identification of homology between parental maps for ten linkage groups. A small 11thgroup
(9’) was identified in the male parent. The 165 markers comprised 33 SSR and 132 AFLP loci. Markers that seg-regated bi-parentally were placed by the average of their recombination ratio. Despite the greater number of mapped markers segregating from the male parent, no significant difference was observed in recombination fre-quencies among consecutive pairs of fully informative loci at a threshold = 0.05.
Segregation distortion
The proportion of markers exhibiting significant dis-tortion from expected Mendelian segregation ratios were greater than would be expected by chance alone, for both parental maps. Loci that departed from expected segregation ratios were included in maps on the basis of
Figures 3(a– c).– Linkage maps of Eucalyptus globulususing SSR and AFLP markers. Linkage groups are numbered following Brondani et al. 1998 and 2002. The distance between markers is indicated in Kosambi centimorgans. SSR markers are preceded by EMB (EMBRA), En or Eg (CSIRO, Isolated from E. nitens, or E. globulusrespectively) or CRC (EMCRC) to indicate their source. AFLP markers are labelled p#b# with numbers indicating the primer combination (p#) and band number (b#) respectively. Accessory markers are underlined, loci with distorted segregation ratios are indicated by asterisk; * P≤ 0.05, ** P≤ 0.01, *** P≤ 0.001,**** P≤0.0001.
Figures 3(a).– Linkage map of the female parent.
fitting the ‘trusted order’ without substantial re-order-ing, and conformation to the designated mapping para-meters (see Materials and Methods). The proportion of mapped markers with distorted segregation ( ≤ 0.05) was greater for the female 13 (11%) than the male 12 (9 %) parental maps, however this difference was not significant (X2
1d= 0.2178, P≤0.05 ).
More significant distortion also occurred on the female map, where one marker (p03b09) was distorted at
≤ 0.0001, one marker at ≤ 0.0005 (p03b18), one marker at 0.005 % (EMBRA 158) and one marker at
Figures 3(b).– Linkage map of the male parent. Group 2’ corresponds to group 2 in the female and inte-grated maps.
with the remaining 11 markers distorted at ≤ 0.05 (Figures 3aand 3b).
Distorted markers ( ≤ 0.05) mapped to 5 linkage groups in the female parent and 5 linkage groups in the male parent. The distribution of distorted markers was concentrated, on two linkage groups (male 5 and female
the AFLP marker p03b09 near the chromosome end, to lesser distortion in surrounding markers in both direc-tions. Markers inherited solely from the male parent in this group were not distorted. Shared SSR markers in the equivalent group from the male parent exhibit dis-tortion, however this was due to the deficiency of a maternal allele for all but one marker (EMCRC 8) in which there was no deficiency of alleles from either par-ent. The distortion can therefore be considered specific to the female parent. In contrast, in linkage group 5, segregation distortion was confined to markers inherit-ed from the male parent (Figure 3b), with four markers near the groups extremity distorted at ≤0.05.
Discussion
Marker polymorphism
Fifty three percent of amplifiable SSR loci screened in this study were fully informative (Table 2), compared with other reports in E. globulusof 60 % in an F1 inter-provenance cross (THAMARUSet al., 2002) and 34 % in an F1 intraprovenance cross (BUNDOCK et al., 2000). The intraprovenance nature of the mapping cross employed by BUNDOCKet al. (2000) may explain the lower propor-tion of polymorphism, compared to the interprovenance cross used herein.
The average of 12 polymorphic bands per AFLP primer combination in this study is low compared with other findings in eucalypts of 25 in an F1 interspecific cross of E. globulus and E. tereticornis (MARQUESet al., 1998) and 35 in a pseudo-backcross of E. globulus and
E. grandis (MYBURG et al., 2003). Two factors may account for these differences. Firstly, the interspecific crosses used by MARQUESet al. (1998) and MYBURGet al. (2003) are likely to produce a greater level of informa-tive polymorphism than an intraspecific cross. Secondly, differences in the detection system employed for AFLP fragments may further account for differences in poly-morphism between the studies. The sequencing gels employed for AFLP detection by MARQUES et al. (1998)
and MYBURGet al. (2003), may provide increased resolu-tion, allowing the detection of a greater number of bands per gel than the Gelscan 2000 employed in this study. However, the detection of fragments by Gelscan 2000 in conjunction with image analysis using Gene Profiler™ software allows substantially more rapid data collection, by reducing the duration of gel runs and allowing semi-automated scoring of fragments, relative to autoradiog-raphy and manual scoring as employed by MARQUESet al. (1998).
Map construction
The total map length of 701.9 cM (integrated produced using 165 markers) in this study is low in comparison to other mapping efforts in Eucalyptus (see THAMARUS et al., 2002). At the upper limit, BYRNEet al. (1995) report-ed an integratreport-ed map length of 1462 cM in E. nitens
using 335 predominantly RFLP and RAPD markers, while at the lower limit MARQUESet al. (1998) reported a total map length of 919 cM (female) and 967 cM (male) in maps comprising 268 and 200 AFLP markers, respec-tively. An important factor contributing to the low map length herein is that the pair-wise mapping algorithm employed by Joinmap software consistently produces lower map lengths compared to multi-locus likelihood based packages (BUTCHERet al., 2002) such as Outmap (WILLIAMSand WHITAKER, 2001) and Mapmaker (LANDER et al., 1987). Incomplete map coverage in some linkage groups, due to the relatively low number of mapped markers in this study, may also contribute to the observed differences in map length (see evidence below). Furthermore, the presence of genotyping errors can overestimate the proportion of double crossovers, severe-ly inflating map lengths (HACKETT and BROADFOOT, 2003). Therefore, the rigorous data checking and exclu-sion of numerous scored markers with an apparent excess of double crossovers may have had the effect of keeping map length to a minimum in this study.
[image:9.595.123.474.112.274.2]There were more linkage groups than the haploid number of chromosomes in Eucalyptus (11), identified
Figures 3(c).– Integrated linkage map. The integrated linkage map includes only framework markers that fit the order established from parental maps. Linkage group 9’ was identified in the male parent only.
from cytological studies (reviewed in POTTS and WILT -SHIRE, 1997) for both the male (14 groups) and female (12 groups) maps. The finding of a greater number of linkage groups than chromosomes is not unusual in linkage studies (KESSELI et al., 1994; WU et al., 2001), including eucalypts (BYRNEet al., 1995; MARQUESet al.,
markers and small linkage groups that could not be united with larger groups, were no doubt the cause of the greater number of linkage groups than chromosomes in parental maps within this study.
Linkage group homology
Comparative mapping studies rely on a set of common transferable markers that segregate in the species or pedigree of interest (AHUJA, 2001). Although various linkage maps have been constructed in eucalypts, the lack of transferability of markers commonly employed, such as RAPDs and AFLPs, means that linkage infor-mation and associated QTL data have been largely confined to the pedigrees used for map construction (GRATTAPAGLIA, 2000). This deficiency of marker infor-mation has been a great hindrance to comparative map-ping that would form the basis for the construction of a species wide consensus map, and more powerful QTL analysis in Eucalyptus(BRONDANIet al., 2002).
The ongoing development of numerous EMBRA SSR markers from Eucalypus grandis and E. urophyllahas begun to address the problem of marker transferability (BRONDANI et al., 1998; 2002). For example, within the section Latoangulatae (BROOKER, 2000), 46 fully infor-mative (EMBRA) SSR markers are common to linkage maps of both Eucalyptus grandis and E. urophylla
(BRONDANI et al., 2002). Between sections, comparisons have largely been limited to markers with less informa-tion content or fewer SSR loci. For example, linkage information from Eucalyptus grandis and E. urophylla
(section Latoangulatae; BRONDANI et al., 1998; GION et al., 2000) can be compared with E. globulus (section
Maidenaria) based on 3 EMBRA loci and 5 lignin genes (THAMARUS et al., 2002) or 7 fully informative EMBRA loci (BUNDOCKet al., 2000). Similarly, linkage informa-tion from Eucalyptus camaldulensis(section Exsertaria; AGRAMA et al., 2002) can be compared with E. grandis and E. urophyllaon the basis of 13 shared SSR markers (BRONDANI et al., 1998) and with E. globulus based on two (THAMARUS et al., 2002) and five (BUNDOCK et al., 2000) shared SSRs. The only study to date allowing comparison of synteny between sections in numerous SSR markers is that of MARQUES et al. (2002), which considered synteny of SSR loci and QTLs across
Euca-lyptus grandis, E. urophylla, E. tereticornis (section
Exsertaria) and E. globulus. MARQUES et al. (2002) reported only the homologies supported by at least 3 SSR loci in two different species, comprising 22 SSR across 8 linkage groups in E. globulus.
In an attempt to allow comparison between this and previous studies, 37 of the 41 SSR mapped herein were in common with other linkage studies in Eucalyptus.
Importantly, this study included SSR loci developed from a variety of sources, allowing a wider comparabili-ty to other studies than was possible based solely on EMBRA markers (MARQUES et al., 2002). This included 27 EMBRA markers in common with BRONDANI et al. (1998, 2002, and unpublished data), three EMCRC and four EMBRA markers in common with BUNDOCK et al. (2000) and seven CSIRO markers in common with THAMARUSet al. (2002).
The presence of 27 fully informative SSRs in common allowed all linkage groups identified by BRONDANIet al. (1998, 2002, and unpublished data) to be recognised in this pedigree (Table 4). Five linkage groups had three or more fully informative markers per group, allowing comparison of marker order. In agreement with past findings (THAMARUS et al., 2002; MARQUES et al., 2002; BUNDOCK et al., 2000), all linkage groupings of the EMBRA markers identified in a two way pseudo-test-cross of E. grandis/urophylla (BRONDANI et al., 1998, 2002, and unpublished data), were preserved in the
E. globulus maps in this study. However, a few minor inconsistencies in map distance and the order of mark-ers were apparent. Permutations of marker order were evident in three of these five linkage groups. These involved mainly closely linked markers- EMBRA 208 and EMBRA 168 in linkage group 5 and EMBRA 127 and EMBRA 155, located at the end of linkage group 10. A more substantial difference occurs in linkage group 8, where EMBRA 197 and EMBRA 48 differ in order rela-tive to EMBRA 30 between maps of E. grandis/urophyl-la and this study. Similarly, on linkage group 4, EMBRA 66 maps to the same position as EMBRA 130 in E. gran-dis/urophylla but is separated by 23 cM in this study and is in a different position relative to EMBRA 186.
SSR markers shared between this study and maps produced by BUNDOCKet al. (2000), from an
[image:11.595.132.465.608.755.2]nance cross of E. globulus, and THAMARUS et al. (2002), using an interprovenance F1 cross of E. globulus, both with parents originating from the same localities as those in this study (Table 4) allows tentative identifica-tion of homologous linkage groups. Homology between 5 linkage groups in this study and 7 linkage groups of BUNDOCK et al. (2000) are proposed on the basis of shared (EMBRA, and EMCRC) SSR. Only two homolo-gous groups (corresponding to 3 groups from BUNDOCKet al., 2000) could be identified directly from shared mark-ers, while the remaining homologies could be inferred by comparing EMBRA loci shared between each map and
E. grandis/urophylla. This inference is justified as both this study and BUNDOCK et al. (2000), found complete agreement between linkage groupings with E. gran-dis/urophylla(BRONDANIet al., 1998, 2002, and unpub-lished data). However, in the case of BUNDOCK et al. (2000) there where more linkage groups than chromo-somes. As a result some linkage groups identified by BRONDANI et al. (1998) were equivalent to 2 linkage groups in the maps of BUNDOCKet al. (2000). Additional-ly, there is a slight difference between the linkage groupings herein and those of BUNDOCKet al. (2000). A single marker (EMCRC 9) maps to linkage group 7 in this study, but to a linkage group homologous to 9 in the study of BUNDOCKet al. (2000; the linkage group nomen-clature used by BUNDOCK et al. (2000), differs to that used in the present study (Table 4)).
The differences in marker order between this map and those produced by BRONDANI et al. (1998, 2002 and unpublished data) and BUNDOCKet al. (2000) may repre-sent actual differences caused by mechanisms such as chromosomal rearrangements between the mapping populations. Some evidence in support of chromosomal rearrangements between eucalypt species is provided by the fact that AGRAMAet al. (2002) also found a difference in marker order (in E. camaldulensis) compared with
E. grandis and E. urophylla (BRONDANI et al., 1998) in the equivalent linkage group (8) to this study. Alterna-tively, amplification of non-target sites due to multiple copies of the same SSR loci, may have occurred as ERPELDING et al. (1996) found when transferring SSR between wheat and barley. On the other hand, the dis-crepancies may be artefacts of mapping imprecision. Because very few apparent recombinants can change map order, accurate ordering of closely linked markers is often problematic, requiring very large mapping popu-lations (REMINGTONet al., 1999). Indeed practical limita-tions upon the number of individuals used in mapping populations of forest trees may account for the alterna-tions in marker order which have occurred between parental maps produced in various tree species (MALIEPAARDet al., 1998; DEVEYet al., 1999), including Eucalyptus(BRONDANIet al., 2002; MARQUESet al., 1998; 2002). At present, the number of comparable linkage maps produced in Eucalyptus species is insufficient to conclusively confirm or refute the occurrence of chromo-somal rearrangements between species. Hence, further mapping using larger populations and more markers is required in E. globulus and other Symphyomyrtus
species to clarify the nature and extent of any differ-ences in marker order at both the interspecific and intraspecific levels.
When compared with the map of THAMARUS et al. (2002), all linkage groups of shared (CSIRO and EMBRA) SSR markers were conserved. Homology between 7 linkage groups of THAMARUSet al. (2002) and this study are inferred on the basis of 1 or 2 SSR in com-mon per linkage group. However, there are some incon-sistencies in the relative position of markers within linkage groups between maps. Specifically, the CSIRO marker Eg86 maps to the end of linkage group 2 herein, but a third of the way along the equivalent group in THAMARUS et al. (2002). Similarly, the CSIRO marker Eg99 maps to the end of the linkage group 11 herein but close to the middle of the equivalent linkage group in THAMARUS et al. (2002). Similar discrepancies in the exact map location of specific markers have been noted previously in Eucalyptus(MARQUESet al., 1998; MYBURG et al., 2003; THAMARUSet al., 2002) and in the absence of evidence for chromosomal rearrangement are often attributable to sampling error (MYBURG et al., 2003) or differences in map coverage between studies. Incomplete map coverage of some linkage groups in the present study is the most likely cause of the above discrepancies.
Segregation distortion
The proportion of markers in this study displaying distortion from expected Mendelian segregation ratios is greater than would be expected by chance alone. For example, 12 markers from the male parent and 13 markers from the female parent exhibited segregation distortion (at ≤ 0.05), clearly exceeding expectations for the male (6.5/130) and female (5.9/118) parents. The concentration of many of the distorted markers in two groups (male 5 and female 2) suggests a biological cause, rather than other potential factors, such as geno-typing errors, that might produce an apparent distortion of segregation ratios (KEARSEY and POONI, 1996). The female group 2 is notable, in that all markers from this group are distorted and a gradient in the level of distor-tion from a maximum ( ≤0.0001) in p03b09 occurs in this linkage group. Such departures from expected Mendelian segregation ratios have been widely docu-mented in plants and animals (e.g. GILLETand GREGO -RIUS, 1992; BRADSHAW and STETTLER, 1994), including Eucalyptus (VAILLANCOURT et al., 1995; BUNDOCK et al., 2000; MYBURGet al., 2003). Numerous mechanisms have been hypothesised to explain such distorted segregation ratios, operating at various stages of development (reviewed by GILLET and GREGORIUS, 1992). These include prezygotic mechanisms such as gametophytic incompatibility systems (e.g. GEBHARDT et al., 1991), meiotic drive (e.g. BUCKLER et al., 1999) and haploid expressed deleterious alleles and post-zygotic mecha-nisms such as the expression of genetic load (e.g. GION et al., 2000; BRADSHAWand STETTLER, 1994) and hybrid incompatibility systems (e.g. RIESEBERGet al., 1995).
Ideally, a survey of allele frequencies before and after fertilisation would allow discrimination between segre-gation distortion due to pre-zygotic mechanisms such as meiotic drive and haploid expressed deleterious alleles and post-zygotic mechanisms such as genetic load (GILLET and GREGORIUS, 1992). Lacking such informa-tion, pre-zygotic mechanisms remain a possible cause of segregation distortion. However, the death of ~25 % of the planted F2 generation before they were sampled for this study suggests that some post-zygotic selection mechanism may well play a substantial role in distort-ing expected segregation ratios, as opposed to meiotic drive, haploid deleterious alleles or gametophytic incom-patibility which would occur at the pre-zygotic stage. A close agreement between the number of individuals with the under represented genotype class in the most dis-torted markers from this group (p03b09 and p03b18) and the number of genotypes with at least one dead individual from the mapping population, is consistent with the effects of post-zygotic selective mechanisms (GILLET and GREGORIUS, 1992), such as genetic load or hybrid incompatibility.
The expression of genetic load involves the effects of deleterious or lethal alleles distorting segregation ratios of linked markers. Eucalypts are highly heterozygous and are known to carry many deleterious alleles in the heterozygous condition (POTTS and WILTSHIRE, 1997; PATTERSON et al., 2000). Such genes could possibly account for the observed segregation distortion from the female parent (group 2) in this study, as in VAILLAN -COURTet al. (1995). Under this hypothesis, the distortion of the entire female linkage group 2 could be explained by one or several genes with a strong effect on viability segregating close to the markers where the distortion peaks, with diminishing effects toward the other extremity of the linkage group due to the effects of link-age.
Another possible post-zygotic mechanism contributing to segregation distortion is hybrid incompatibility resulting from the broad inter-provenance origin of the grandparents in the mapping pedigree. Trees from these locations are differentiated by nuclear microsatellites (POTTS et al., 2004) and as previously mentioned, are also classified into different geographical races on the basis of morphology (DUTKOWSKIand POTTS, 1999). High levels of inviability have been noted in various interspe-cific hybrid combinations within Eucalyptus (reviewed by POTTSand DUNGEY, 2004). This process may also be applicable to broad intraspecific crosses such as the mapping pedigree in this study. For example, in an F1 (intraspecific) inter-provenance cross between E. globu-lus from King Island and Taranna, a reduced viability has been noted relative to an intra-provenance cross from King Island. However, the Taranna intra-prove-nance cross also performed poorly (VOLKER, 2002). Although most studies have demonstrated hybrid incompatibility in the F1generation, barriers to hybridi-sation may also extend to further generations (outbreed-ing depression) as noted by POTTSet al. (2000) where a reduced growth and survival of E. globulusby E. nitens
affected F1and F2generations. Two general mechanisms are postulated to contribute to hybrid incompatibility,
chromosomal rearrangements and genetic incompatibili-ty between differentiated taxa (RIESEBERG et al., 1995). Genetic incompatibility may occur between differentiat-ed populations of the same species due to processes such as the disruption of coadaptive gene complexes and the introduction of adaptive, or maladaptive genes (POTTSet al., 2003). As previously discussed, there is as yet no conclusive evidence for gross chromosomal rearrange-ments in Eucalyptusat the intra- or interspecific level. Thus both general mechanisms remain possible causes of the observed segregation distortion in female linkage group 2.
Conclusion
The inclusion of numerous fully informative SSR, in conjunction with AFLP markers, has allowed the con-struction of parental and consensus maps in this pedi-gree of E. globulus.Mapping SSR markers derived from
a variety of sources has demonstrated almost complete homology in linkage groupings across a range of Sym-phyomyrtus species, encompassing multiple sections, although some minor differences in the distance and order of markers within linkage groups were apparent. Further mapping within E. globulususing an expanded set of SSR markers will clarify the nature and extent of any differences between Symphyomyrtusspecies, paving the way for further comparative mapping and ultimate-ly consensus maps of the subgenus. The low success in transfer of SSR loci from E. grandis/urophylla, from which most SSR in Eucalyptus have been developed, suggests that more SSRs will be required in order to produce high coverage maps in E. globulusbased exclu-sively on these markers. Segregation distortion of some markers has been demonstrated, concentrated in two gender specific groups. In the case of the severe distor-tion in the female group 2, post zygotic mechanisms are a likely cause.
Acknowledgements
We would like to thank KELSEYJOYCEand Gunns Ltd. for access to the trial site. The Australian Research Council and the Cooperative Research Centre for Sustain-able Production Forestry for financial assistance. DARIO GRATTAPAGLIA and ROSANI BRONDANI for providing SSR primers. PAUL TILYARD for assistance collecting foliage samples. REBECCAJONESand ADAMSMOLENSKIfor techni-cal assistance and DOROTHYSTEANEfor comments on the manuscript.
References
AGRAMA, H. A., T. L. GEORGEand S. F. SALAH(2002): Con-struction of genome map for Eucalyptus camaldulensis
DEHN. Silvae Genetica 51: 201–206.
AHUJA, M. R. (2001): Recent advances in molecular genet-ics of forest trees. Euphytica 121: 173–195.
AVISE, J. C. (1994): Molecular markers, natural history and evolution. Chapman and Hall International, New York.
BRADSHAW, H. D. and R. F. STETTLER (1994): Molecular genetics of growth and development in PopulusII. Seg-regation distortion due to genetic load. Theoretical and Applied Genetics 89: 551–558.
BRONDANI, R. P. V., C. BRONDANI, R. TARCHINIand D. GRAT -TAPAGLIA (1998): Development, characterization and mapping of microsatellite markers in Eucalyptus gran-dis and Eucalyptus urophylla. Theoretical & Applied Genetics 97: 816–827.
BRONDANI, R. P. V. (2001): Development, characterization and mapping of microsatellite markers in Eucalyptus.
PhD thesis, University of Brasília, Brazil.
BRONDANI, R. P. V., C. BRONDANI and D. GRATTAPAGLIA (2002): Towards a genus-wide reference linkage map for
Eucalyptus based exclusively on highly informative microsatellite markers. Molecular Genetics & Genomics 267: 338–347.
BROOKER, M. I. H. (2000): A new classification of the genus
Eucalyptus L’Hér. (Myrtaceae). Australian Systematic Botany 13: 79–148.
BUCKLER, E. S., T. L. PHELPS-DURR, C. S. KEITHBUCKLER, R. KELLY DAWE, J. F. DOEBLEY and T. P. HOLTSFORD (1999): Meiotic drive of chromosomal knobs reshaped the maize genome. Genetics 153: 415–426.
BUNDOCK, P. C., M. HAYDEN and R. E. VAILLANCOURT (2000): Linkage maps of Eucalyptus globulus using RAPD and microsatellite markers. Silvae Genetica 49: 223–232.
BUTCHER, P. A., E. R. WILLIAMS, D. WHITAKER, S. LING, T. P. SPEEDand G. F. MORAN(2002): Improving linkage analysis in outcrossed forest trees – an example from
Acacia mangium.Theoretical and Applied Genetics 104: 1185–1191.
BYRNE, M., J. C. MURRELL, B. ALLEN and G. F. MORAN (1995): An integrated genetic linkage map for eucalypts using RFLP, RAPD and isozyme markers. Theoretical and Applied genetics 91: 869–875.
BYRNE, M., M. I. MARQUES-GARCIA, T. UREN, D. S. SMITH and G. F. MORAN (1996): Conservation and genetic diversity of microsatellite loci in the genus Eucalyptus.
Australian Journal of Botany 44: 331–341.
CARNEGIE, A. J., P. J. KEANE, P. K. ADESand I. W. SMITH (1994): Variation in susceptibility of Eucalyptus globu-lusprovenances to Mycosphaerellaleaf disease. Canadi-an Journal of Forest Research 24: 1751–1757.
CERVERA, M. T., C. PLOMIONand C. MALPICA(2000): Molec-ular markers and genome mapping in woody plants, pp. 375–394. In: Molecular biology of woody plants, edited by JAIN, S. M. and MINOCHA, S. C., Volume 1, Kluwer Academic Publishers, Netherlands.
CERVERA, M. T., V. STORME, B. IVENS, J. GUSMÃO, B. H. LIU, V. HOSTYN, J. V. SLYCKEN, M. V. MONTAGUand W. BOER -JAN(2001): Dense genetic linkage maps of three Popu-lus species (Populus deltoides, P. nigra and P. tri-chocarpa) based on AFLP and microsatellite markers. Genetics 158: 787–809.
DEVEY, M. E., M. M. SEWELL, T. L. URENand D. B. NEALE (1999): Comparative mapping in loblolly and radiata pine using RFLP and microsatellite markers. Theoreti-cal & Applied Genetics 99: 656–662.
DOYLE, J. J. and J. L. DOYLE (1990): Isolation of plant DNA from fresh tissue. Focus 12, 13–15.
DUTKOWSKI, G. W. and B. M. POTTS (1999): Geographic patterns of genetic variation in Eucalyptus globulus
ssp. globulus and a revised racial classification. Aus-tralian Journal of Botany 47: 237–263.
EDWARDS, J. H. (1991): The reliability of locus orderings. Annals of Human Genetics 55: 315–320.
ELDRIDGE, K., J. DAVIDSON, C. HARWOODand G. VANWYK (1993): Eucalypt domestication and breeding. Oxford University Press, New York.
ERPELDING, J. E., N. K. BLAKE, T. K. BLAKEand L. E. TAL -BERT (1996): Transfer of sequence tagged site PCR markers between wheat and barley. Genome 39: 802–810.
GEBHARDT, C., E. RITTER, E. BARONE, T. DEBENER, B. WALKEMEIER, U. SCHACHTSCHNABEL, H. KAUFMANN, R. D. THOMPSON, M. W. BONEIRBALE, M. W. GANAL, S. D. TANKSLEY and F. SALAMINI (1991): RFLP maps of potato and their alignment with the homologous tomato genome. Theoretical and Applied Genetics 83: 49–57. GILLET, E. and H.-R. GREGORIUS (1992): What can be
inferred from open pollinated progenies about the source of observed segregation distortion? – A case study in Castanea sativa Mill. Silvae Genetica 41: 82–87.
GION, J.-M., P. RECH, J. GRIMA PETTENATI, D. VERHAEGEN and C. PLOMION (2000): Mapping candidate genes in
GRATTAPAGLIA, D. (1997): Opportunities and challenges for the incorporation of genomic analysis in Eucalyptus
breeding, pp. 129–136. In: Silviculture and Improve-ment of Eucalypts, Proceedings IUFRO Conference, Salvador, Brazil.
GRATTAPAGLIA, D. (2000): Molecular breeding of E ucalyp-tus,pp. 451–474. In:Molecular biology of woody plants, edited by JAIN, S. M. and MINOCHA, S. C., Volume 1, Kluwer Academic Publishers, Netherlands.
GRATTAPAGLIA, D. and R. SEDEROFF(1994): Genetic linkage maps of Eucalyptus grandis and Eucalyptus urophylla
using a pseudo-testcross mapping strategy and RAPD markers. Genetics 137: 1121–1137.
GUPTA, V., A. MUKHOPADHYAY, N. ARUMUGAM, Y. S. SODHI and A. K. PRADHAN (2004): Molecular tagging of erucic acid trait in oilseed mustard (Brassica juncea) by QTL mapping and single nucleotide polymorphisms in FAE1 gene. Theoretical and Applied Genetics 108: 743–749. HACKETT, C. A. and L. B. BROADFOOT (2003): Effects of
genotyping errors, missing values and segregation dis-tortion in molecular marker data on the construction of linkage maps. Heredity 90: 33–38.
JONES, M. E., R. L. STOKOE, M. J. CROSS, L. J. SCOTT, T. L. MAGUIRE and M. SHEPHERD (2001): Isolation of microsatellite loci from spotted gum (Corymbia variega-ta), and cross-species amplification in Corymbia and
Eucalyptus.Molecular Ecology Notes 1: 276–278. KEARSEY, M. J. and H. S. POONI (1996): The genetical
analysis of quantitative traits. Chapman and Hall, Lon-don.
KEATS, B. J. B., S. L. SHERMAN, N. E. MORTON, E. B. ROB -SON, K. H. BUETOW, P. E. CARTWRIGHT, A. CHAKRAVARTI, U. FRANCKE, P. P. GREENand J. OTT(1991): Guidelines for human linkage maps – an International System for Human Linkage Maps (ISLM 1990). Annals Human Genetics 55: 1–6.
KESSELI, R., I. PARAN and R. W. MICHELMORE (1994): Analysis of a detailed genetic linkage map of Lactuca sativa (Lettuce) constructed from RFLP and RAPD markers. Genetics 136: 1435–1446.
LANDER, E. S., P. GREEN, J. ABRAHAMSON, A. BARLOW, M. J. DALY, S. E. LINCOLNand L. NEWBURG(1987) Map-maker: an interactive computer package for construct-ing primary genetic linkage maps of experimental and natural populations. Genomics 1: 174–181.
MALIEPAARD, C., F. H. ALSTON, G. VANARKEL, L. M. BROWN, E. CHEVREAU, F. DUNEMANN, K. M. EVANS, S. GARDINER, P. GUILFORD, A. W. VANHEUSDEN, J. JANSE, F. LAURENS, J. R. LYNN, A. G. MANGANARIS, A. P. M. DEN NIJS, N. PERIAM, E. RIKKERINK, P. ROCHE, C. RYDER, S. SANSAVINI, H. SCHMIDT, S. TARTARINI, J. J. VERHAEGH, M. VRIELINK-VANGINGELand G. J. KING(1998): Aligning male and female linkage maps of apple (Malus pumila
Mill.) using multi-allelic markers. Theoretical and Applied Genetics 97: 60–73.
MARQUES, C. M., J. A. ARAUJO, J. G. FERRIERA, R. WHET -TEN, D. M. OMALLEY, B. H. LIUand R. SEDEROFF(1998): AFLP genetic maps of Eucalyptus globulus and
E. tereticornis. Theoretical and Applied Genetics 96: 727–737.
MARQUES, C. M., R. P. V. BRONDANI, D. GRATTAPAGLIAand R. SEDEROFF (2002): Conservation and synteny of SSR loci and QTLs for vegetative propagation in four Euca-lyptus species. Theoretical and Applied Genetics 105: 474–478.
MYBURG, A. A., D. L. REMINGTON, D. M. O’MALLEY, R. R. SEDEROFF and R. W. WHETTEN (2001): High-throughput AFLP analysis using infrared dye-labeled
primers and an automated DNA sequencer. BioTech-niques 30: 348–357.
MYBURG, A. A., A. R. GRIFFIN, R. R. SEDEROFF and R. W. WHETTEN (2003): Comparative genetic linkage maps of Eucalyptus grandis, Eucalyptus globulus and their F1 hybrid based on a double pseudo-backcross mapping approach. Theoretical and Applied Genetics 107: 1028–1042.
PATTERSON, B., C. M. WOLBANG, R. E. VAILLANCOURT and B. M. POTTS (2000): Inheritance of two chlorophyll mutants in Eucalyptus globulus. Silvae Genetica 49: 290–291.
PLOMION, C., N. BAHRMAN, C. DURELand D. M. O’MALLEY (1995): Genomic mapping in Pinus pinaster (maritime pine) using RAPD and protein markers. Heredity 74: 661–668.
POTTS, B. M. and R. J. E. WILTSHIRE (1997): Eucalypt genetics and genecology, pp 56–91. In:Eucalypt ecology: individuals to ecosystems, edited by WILLIAMS, J., WOINARSKI, J., Cambridge University Press, Cambridge. POTTS, B. M., P. W. VOLKER, P. A. TILYARD and K. JOYCE (2000): The genetics of hybridisation in the temperate Eucalyptus. pp. 200–210. In: DUNGEY, H. S., DIETERS, M. J., NIKLES, D. G. (eds) Hybrid Breeding and Genetics of Forest Trees, Proceedings of QFRI/CRC-SPF Sympo-sium, Noosa, Queensland, Australia.
POTTS, B. M., R. C. BARBOUR, A. B. HINGSTONand R. E. VAILLANCOURT(2003): Turner Review no. 6, Genetic pol-lution of native eucalypt gene pools-identifying the risks. Australian Journal of Botany 51: 1–25.
POTTS, B. M. and H. S. DUNGEY (2004): Interspecific hybridization of Eucalyptus:key issues for breeders and geneticists. New Forests27: 115–138.
POTTS, B. M., R. E. VAILLANCOURT, G. JORDAN, G. DUTKOWSKI, J. COSTA ESILVA, G. MCKINNON, D. STEANE, P. VOLKER, G. LOPEZ, L. APIOLAZA, Y. LI, C. MARQUESand N. BORRALHO (2004): Exploration of the Eucalyptus globulus gene pool. Plenary paper, pp 46–61. In: BOR -RALHO, N., PERIERA, J. S., MARQUES, C., COUTINHO, J., MADEIRA, M., TOME, M. (eds) Eucalyptusin a changing world. Proceedings IUFRO Conference. RAIZ, Instituto Investigação de Floresta e Papel, Aveiro, Portugal. REMINGTON, D. L., R. W. WHETTEN, B. H. LIU and D. M.
O’MALLEY(1999): Construction of an AFLP genetic map with nearly complete genome coverage in Pinus taeda.
Theoretical and Applied Genetics 98: 1279–1292. RIESEBERG, L. H., C. R. LINDER and G. J. SEILER (1995):
Chromosomal and genic barriers to introgression in Helianthus. Genetics 141: 1163–1171.
SHEPHERD, M., M. CROSS, M. J. DIETERS and R. HENRY (2003): Genetic maps for Pinus elliottiivar. elliottiiand
P. caribaea var. hondurensis using AFLP and microsatellite markers. Theoretical and Applied Genet-ics 106: 1409–1419.
SEWELL, M. M. and D. B. NEALE(2000): Mapping quanti-tative traits in forest trees, pp 407–423. In: Molecular biology of woody plants, edited by JAIN, S. M. and MINOCHA, S. C., Volume 1, Kluwer Academic Publishers, The Netherlands.
STEANE, D. A., R. E. VAILLANCOURT, J. RUSSELL, W. POWELL and D. MARSHALLand B. M. POTTS(2001): Development and characterisation of microsatellite loci in Eucalyptus globulus(Myrtaceae). Silvae Genetica50: 89–91. THAMARUS, K. A., K. GROOM, J. MURRELL, M. BYRNE and
VAILLANCOURT, R. E., B. M. POTTS, A. MANSON, T. ELDRIDGE and J. B. REID (1995): Using RAPDs to detect QTLs in an interspecific F2 hybrid of Eucalyptus. pp 430–433. In: POTTS, B. M., BORRALHO, N. M. G., REID, J. B., CROMER, R. N., TIBBITS, W. N. and RAYMOND, C. A. (eds) Eucalypt plantations: Improving fibre yield and quality. Proceedings papers CRC IUFRO conference, Hobart, Australia.
VANOOIJEN, J. W. and R. E. VOORRIPS (2001): Joinmap® 3.0, software for the calculation of genetic linkage maps. Plant Research International, Wageningen, the Netherlands.
VERHAEGEN, D. and C. PLOMION (1996): Genetic mapping in Eucalyptus urophyllaand Eucalyptus grandis using RAPD markers. Genome 39: 1051–1061.
VOLKER, P. W. (2002): Genetics of Eucalyptus globulus, E. nitensand F1hybrid. PhD Thesis, University of Tas-mania, Australia.
VOS, P., R. HOGERS, M. BLEEKER, M. REIJANS, T. VAN DE LEE, M. HORNES, A. FRIJTERS, J. POT, J. PELEMAN, M. KUIPER and M. ZABEAU (1995): AFLP: a new tech-nique for DNA fingerprinting. Nucleic Acids Research 23: 4407–4414.
WILLIAMS, E. R. and D. WHITAKER(2001): Outmap©1.0, a
package for genetic mapping, CSIRO forestry and forest products, Canberra, Australia and University of Waika-to, Hamilton, New Zealand.
WU, R. L., Y. F. HAN, J. J. HU, J. J. FANG, L. LI, M. L. LI and Z. B. ZENG (2001): An integrated genetic map of
Populus deltoides based on amplified fragment length polymorphisms. Theoretical & Applied Genetics 100: 1249–1256.
Abstract
Calycophyllum spruceanum (Benth.) Hook. f. ex K. Shum. is an important timber-tree species in the Peru-vian Amazon Basin. As farmers and industry often use wood from young trees, it is important to investigate variation in juvenile wood properties in this species. A provenance/progeny test was established to evaluate genetic variation in growth and wood properties of young trees, the strength of their genetic control as well as their interrelationships both at the genetic and the phenotypic level in different planting zones. In this paper, results are presented for tree height and stem diameter (near ground level) at 16, 28 and 39 months; and stem diameter and basic density of the wood at breast height at 39 months. Significant variation due to provenances and especially due to families within prove-nances was found in growth and wood density. Pheno-typic and genetic correlations indicated that larger trees tended to have denser wood. Wood density had higher heritability than height and diameter; and genetic
con-trol over height, diameter and density was generally highest in the planting zone where trees grew most rapidly.
Key words: provenance, family, environment, heritability, phe-notypic and genetic correlations, juvenile wood.
Introduction
The Peruvian Amazon has many valuable timber-tree species, but there has been little research on genetic variation in these species. Farmers and industry com-monly use juvenile wood, and they will probably use it even more in the future with the promotion of agro-forestry and small-scale plantation agro-forestry. Tree breed-ers, therefore, should initiate research on genetic varia-tion in properties of juvenile wood to see whether it is possible to improve them through breeding work and to measure the impact of selection for juvenile wood traits on other traits (ZOBELand SPRAGUE, 1998).
Calycophyllum spruceanum (Benth.) Hook. f. ex K. Shum. (Rubiaceae family) is a pioneer species that colo-nizes the floodplain and disturbed forests in the Amazon Basin (LINARES et al., 1992). The breeding system has not been studied, but is assumed to be primarily out-crossing like the majority of tropical trees (BAWA et al., 1990). Trees have hermaphroditic flowers, and mature in 2 to 3 years in open-grown conditions. There is proba-bly extensive gene flow, producing high levels of genetic variation within populations and relatively low genetic
Genetic Variation and Correlations between Growth and Wood Density of
Calycophyllum spruceanum
at an Early Age in the Peruvian Amazon
By C. SOTELOMONTES1),*), R. E. HERNÁNDEZ1), J. BEAULIEU2)and J. C. WEBER3)
(Received 17thFebruary 2006)
1) Centre de recherche sur le bois, Pavillon Gene Kruger,
Univer-sité Laval, Québec (Québec), G1K7P4, Canada.
2) Natural Resources Canada, Canadian Forest Service, Fibre
Centre, 1055 du P.E.P.S., P.O. Box 10380, Stn. Sainte-Foy, Quebec, Quebec, G1V4C7, Canada.
3) World Agroforestry Centre (ICRAF), B.P. 320, Bamako, Mali;
and Adjunct Professor, Faculty of Forestry and Geomatics, Laval University.