The effect of consecutive days of exercise on
markers of oxidative stress
Cecilia M. Shing, Jonathan M. Peake, Shannon M. Ahern, Natalie A. Strobel, Gary Wilson, David G. Jenkins, and Jeff S. Coombes
Abstract: We examined the influence of 3 consecutive days of high-intensity cycling on blood and urinary markers of oxi-dative stress. Eight highly-trained male cyclists (VO2 max76 ± 4 mLkg–1min–1; mean ± SD) completed an interval session (9 exercise bouts lasting 30 s each, at 150% peak power output) on day 1, followed by 2 laboratory-simulated 30 km time trials on days 2 and 3. The cyclists also completed a submaximal exercise trial matched to the interval session for oxygen consumption. Blood was collected pre- and post-exercise for the determination of malondialdehyde (MDA), total antioxi-dant status (TAS), vitamin E, and the antioxiantioxi-dant enzyme activity of superoxide dismutase and glutathione peroxidase, while urine was collected for the determination of allantoin. There were significant increases in plasma MDA concentra-tions (p < 0.01), plasma TAS (p < 0.01), and urinary allantoin excretion (p < 0.01) following the high-intensity interval session on day 1, whereas plasma vitamin E concentration significantly decreased (p = 0.028). Post-exercise changes in plasma MDA (p = 0.036), TAS concentrations (p = 0.039), and urinary allantoin excretion (p = 0.031) were all signifi-cantly attenuated over the 3 consecutive days of exercise, whereas resting plasma TAS concentration was elevated. There were no significant changes in plasma MDA, TAS, or allantoin excretion following submaximal exercise and there were no significant changes in antioxidant enzyme activity over consecutive days of exercise or following submaximal exercise. Consecutive days of high-intensity exercise enhanced resting plasma TAS concentration and reduced the post-exercise in-crease in plasma MDA concentrations.
Key words: cycling, malondialdehyde, total antioxidant status.
Re´sume´ : Nous analysons l’effet de 3 se´ances, en autant de jours, d’exercice de forte intensite´ a` ve´lo sur les marqueurs sanguins et urinaires du stress par oxydation. Huit cyclistes masculins tre`s bien entraıˆne´s (VO2 max76 ± 4 mLkg–1min–1; moyenne ± E´ T) participent le jour 1 a` une se´ance d’entraıˆnement par intervalles et re´alisent 9 efforts d’une dure´e de 30 s a` une intensite´ e´quivalent a` 150 % de leur puissance de pointe produite; aux jours 2 et 3, ils participent en laboratoire a` deux courses simule´es contre la montre sur une distance de 30 km. Les cyclistes re´alisent aussi un exercice sous-maximal et consomment la meˆme quantite´ d’oxyge`ne que celle consomme´e au cours de la se´ance d’entraıˆnement par intervalles. Avant et apre`s la se´ance d’effort, on pre´le`ve des e´chantillons sanguins afin d’analyser le contenu en propanedial (MDA), le bilan antioxydant global (TAS), la concentration de vitamine E et l’activite´ de la superoxyde dismutase et de la gluta-thion peroxydase; de plus, on recueille un e´chantillon d’urine pour analyser la concentration d’allantoı¨ne. Le jour 1, on ob-serve apre`s la se´ance d’entraıˆnement par intervalles une augmentation significative de la concentration plasmatique de MDA (p < 0,01), du TAS (p < 0,01) et de la concentration urinaire d’allantoı¨ne (p < 0,01), mais on observe aussi une di-minution de la concentration plasmatique de vitamine E (p = 0,028). Aux jours 1, 2 et 3, on observe apre`s la se´ance d’exercice une diminution significative de la concentration plasmatique de MDA (p = 0,036) et du TAS (p = 0,039) et de la concentration urinaire d’allantoı¨ne (p = 0,031); le TAS plasmatique demeure cependant e´leve´ au repos. On n’observe pas de variations significatives des concentrations plasmatiques de MDA, du TAS et de la concentration urinaire d’allan-toı¨ne a` la suite de l’effort sous-maximal et on n’observe pas de variations significatives de l’activite´ des enzymes antioxy-dantes tout au long de ces trois journe´es et a` la suite de l’effort sous-maximal. Des se´ances quotidiennes conse´cutives constitue´es d’un effort de forte intensite´ augmentent le TAS plasmatique au repos et diminuent la concentration plasma-tique de MDA apre`s l’effort.
Mots-cle´s : effort a` ve´lo, propanedial, bilan antioxydant global.
[Traduit par la Re´daction]
Introduction
Exercise is associated with an increased production of
free radicals and reactive oxygen species (ROS), and excess production of ROS has been linked to damage (oxidation) of lipids, proteins, and DNA through a process termed
oxida-Received 6 July 2006. Accepted 21 February 2007. Published on the NRC Research Press Web site at apnm.nrc.ca on 15 June 2007.
C.M. Shing,1J.M. Peake, S.M. Ahern, N.A. Strobel, G. Wilson, D.G. Jenkins, and J.S. Coombes. Exercise and Oxidative Stress Research Group, School of Human Movement Studies, Connell Building, University of Queensland, St. Lucia, Queensland 4072, Australia.
tive stress (Jenkins and Goldfarb 1993). Lipid peroxidation of cell membranes changes membrane integrity, leads to in-creased swelling, and reduces the ability of the cell to main-tain ion gradients (Merry et al. 1991). This oxidative damage to cell membranes has been associated with tissue inflammation, muscle fatigue, and impaired recovery follow-ing high-intensity exercise (Pyne 1994; Abuja 2001).
Although there is a considerable volume of literature re-porting the incidence of oxidative stress in trained and un-trained individuals in response to acute bouts of exercise (see Konig et al. (2001) for a review), limited research has investigated the extent of oxidative stress following consec-utive days of training in moderately to highly trained endur-ance athletes (Mena et al. 1991; Viguie et al. 1993; Subudhi et al. 2001) that often train at high intensities for prolonged periods of time. Many endurance athletes also race over consecutive days, which may increase their risk of incurring oxidative damage. Although adaptations to exercise-induced oxidative stress have been reported following extended training periods in rats (Criswell et al. 1993; Senturk et al. 2001; Petibois and Deleris 2005) and humans (Ji 2002), it remains unclear as to whether oxidative defense systems have the capacity to accommodate the oxidative stress re-sulting from consecutive days of intense exercise (Viguie et al. 1993; Okamura et al. 1997). Although the effects of oxi-dative stress on exercise performance are unclear (Child et al. 2000), inhibition of lipid peroxidation is associated with a reduction in muscular fatigue and attenuation of inflamma-tion (Messina et al. 2006), whereas a decrease in glutathione oxidation delays muscle fatigue (Matuszczak et al. 2005). Oxidative stress occurrence and alterations in antioxidant defenses following exercise may influence subsequent exer-cise performance and oxidative stress responses over consec-utive days of training.
The aim of the present investigation was to examine po-tential changes in urine and hematological markers of oxida-tive stress and markers of endogenous antioxidant status in highly trained cyclists over 3 consecutive days of aerobic and anaerobic exercise to reflect the high-intensity demands of cyclists’ training. We hypothesized that consecutive days of high-intensity exercise without dietary intervention would result in a cumulative increase in oxidative stress and a de-crease in antioxidant defenses.
Materials and methods
Overview
Following a familiarization visit and determination of VO2 max, subjects attended the Human Performance
Labora-tory at the University of Queensland for 3 consecutive days and performed (i) a high-intensity interval session, (ii) a 30 km time trial, and (iii) a second 30 km time trial. Between 4 and 6 days later, subjects performed a submaximal trial in which total oxygen consumed was equal to that consumed during the interval session.
Subjects
Eight highly-trained male road cyclists with a VO2 maxof
76 ± 4 mLkg–1min–1 (mean ± SD) volunteered to
partici-pate in the study (Table 1). Cyclists had a minimum of 2 years competitive racing experience. All cyclists refrained
from taking any dietary or vitamin supplements 1 month prior to and for the duration of the study. They completed a medical history questionnaire and gave their written consent to participate; the study was approved by an ethics commit-tee at The University of Queensland. For all visits, cyclists reported to the laboratory in a fasted and rested state. They had abstained from strenuous exercise for 36 h prior to the first day of consecutive high-intensity training and before the final submaximal trial. Four highly active males with VO2 max of 60 ± 6 mLkg–1min–1 volunteered to participate
as control subjects (Table 1). Highly trained male cyclists were unable to be obtained as control subjects, as they would have had to refrain from training for 4 consecutive days, which conflicted with their training schedules. The control subjects agreed to refrain from taking any dietary or vitamin supplements 1 month prior to and for the duration of the study. In addition to completing a medical history questionnaire and giving their written consent to participate, they were required to abstain from exercise for a period of 4 days. Rested and fasted blood samples were taken at the same time of day on days 2, 3, and 4. This coincided with blood sampling of the exercising subjects over the 3 consec-utive days of high-intensity exercise.
Familiarization
A familiarization visit required cyclists to complete a 30 min submaximal ride with the equipment (mouthpiece, headgear, and cycle ergometer) used in the VO2 max test.
During this visit cyclists also completed 3 high-intensity terval bouts (30 s at 620 W) to familiarize them with the in-tensity of the interval session.
VO2 maxtesting
Cyclists exercised to fatigue on an electronically braked cycle ergometer (Lode Excalibur Sport, Quinton) modified with clip-in pedals and low-profile racing handlebars; the saddle and handle bar positions of the cycle ergometer were adjusted to resemble each cyclists’ own bike, and subjects warmed up at a self-selected pace for 5 min. The incremen-tal test commenced at an initial workload of 100 W; work-load thereafter increased by 15 W every 30 s until volitional fatigue. Oxygen consumption and carbon dioxide production were measured continuously, and data were recorded by a Lab View Computer Program (South Australian Sports Insti-tute). Expired air was analyzed for fractions of expired oxy-gen (FEO2) and carbon dioxide (FECO2) every 15 s during
exercise (Ametek gas analyzers; SOV S-3A11 and COV CD3A, Pittsburgh, PA), and minute ventilation (VE) was
re-corded every 15 s using a turbine ventilometer (Morgan, Model 096, Kent, England). The gas analyzers were cali-brated immediately before and validated after each test us-ing a certified beta gas mixture (Commonwealth Industrial Gas Ltd., Brisbane, Australia); the ventilometer was cali-brated before and validated after each test using a 1 L sy-ringe in accordance with the manufacturer’s instructions. VO2 max was assumed when two of the following conditions
occurred: (i) the oxygen consumption ceased to increase linearly with a rising workload and approached a plateau or dropped slightly, the last two values agreeing within ± 2 mLkg–1min–1; (ii) 90% of age-predicted maximum heart
ratio (RER) was greater than 1.10. VO2 max was recorded as
the highest VO2 value averaged over two consecutive
read-ings, and the peak power output was recorded as the high-est 30 s power output completed during the incremental test.
High-intensity interval session
Between 4 and 6 days following the VO2 max test cyclists
completed the high-intensity interval session. They per-formed nine 30 s bouts at 150% of peak power output; 4.5 min of low-intensity exercise (cycling at 50 W) separated each bout (exercise time was comparable with the time to complete the 30 km time trial). The cyclists exercised on the electronically braked cycle ergometer, and oxygen up-take was monitored for the entire session (i.e., during the ex-ercise and recovery periods). One minute prior to the commencement of each interval, subjects could remove their mouthpiece to consume water. Oxygen consumption from the previous 30 s reading and the 30 s reading following water intake were averaged to estimate oxygen consumption for the 30 s period during which the mouthpiece was re-moved. The amount of water consumed by cyclists in each of the 4 testing sessions was between 400 and 500 mL. To-tal oxygen consumption was determined during the high-intensity interval session. Oxidative stress variables were compared between the high-intensity interval session and the point during the submaximal ride at which total oxygen consumption (and energy expenditure) was the same.
Time trials
Two laboratory simulated 30 km time trials were com-pleted by the cyclists on days 2 and 3; exercise was per-formed by each cyclist on his own bicycle that was mounted to a stationary windtrainer (Cateye, Cyclosimulator CS-1000, Japan). The rear tire was inflated to 120 psi (1 psi = 6.89 10–3 Pa), and placed gently against the friction
de-vice before it was secured; the spring-loaded release brake was removed and a wind-regulated friction load was placed against the rear wheel. Each cyclists’ same rear wheel was used for both 30 km time trials. Performance time was blinded to the subject during the 30 km time trial, but was revealed to him on completion of the trial.
Submaximal ride
Between 4 and 6 days following the second 30 km time trials, cyclists completed a submaximal ride during which the exercise intensity and duration were calculated to ensure that total oxygen consumed was equal to the total oxygen consumed during the interval session. Each cyclists’ own road bicycle was mounted to a stationary windtrainer, in the same manner as described for the 30 km time trials. Cyclists were able to observe their speed (kmh–1) and oxygen
con-sumption was monitored every 7 min (for 3 min intervals)
throughout the ride to ensure that the cyclists were riding at the required oxygen consumption.
Dietary analysis
Both cyclists and control subjects recorded their food in-take for a 24 h period prior to all experimental testing ses-sions. Diet was analyzed using Foodworks Professional (Xyris Software, Australia), which provided information on energy intake in addition to macro- and micro-nutrient in-take.
Urine collection
Urine was collected pre- and post-exercise for the high-intensity interval session, both 30 km time trials, and the submaximal session. Each cyclist was instructed to empty his bladder 1 h prior to arriving at the laboratory. He then immediately consumed 250 mL of water. Ten minutes prior to exercise, after arrival at the laboratory, each cyclist was again instructed to empty his bladder. Urine was again lected from 0 to 30 min post-exercise. All samples were col-lected by voluntary voiding in a container provided to the subject. Urine (40 mL) was acidified with 600mL of 1 mol/ L H2SO4and stored at –208C for later analysis.
Urinary allantoin
Allantoin was measured in urine because, once produced, it is cleared into the urine relatively quickly (Benzie et al. 1999; Hellsten et al. 1997; Mikami et al. 2000). The assay for determination of urinary allantoin concentration was de-veloped using a combination of previously published meth-ods by Shingfield and Offer (1999) and Grootveld and Halliwell (1987) with the following modifications. Urine samples were extracted with acetonitrile and added to hex-ane. They were placed in a freezer at –80 8C for 10 min to enable the aqueous phase to freeze. The mixture was then removed from the freezer and the hexane phase poured off and discarded, while the remaining aqueous phase was left to thaw. The thawed mixture was then evaporated using a Thermo Savant speed vacuum (SPD 111v) set at a temper-ature of 35 8C for a period of 30 min, after which it was reconstituted with formic acid prior to processing.
The concentrations of allantoin in extracted samples were determined by liquid chromatography – mass spectrometry (LC/MS) using a gradient high-performance liquid chroma-tography (HPLC) system (Shimadzu LC-10AT system, Ja-pan) coupled to a triple quadruple mass spectrometer (Perkin Elmer Sciex API 3000) operating in single ion mon-itoring mode with positive ion electrospray. Each sample was analyzed for the presence of allantoin (extraction peak at 159.1 molecular weight). A C18 column (5 mm, 50
2.0 mm) (Phenomenex) was used for reverse-phase HPLC at a flow rate of 0.2 mLmin–1. The mobile phase used in
the initial 6 min isocratic stage of each run was solvent A (0.1% formic acid in water). This isocratic stage was
fol-Table 1. Subject characteristics.
Age (y) Mass (kg) Height (cm) VO2 max(mLkg–1min–1) PPO (W)
Highly trained (n = 8) 25 (4) 67.7 (6.2) 176.4 (6.7) 75.6 (4.1) 433 (37)
Control (n = 4) 25 (1) 68.0 (2.5) 175 (6.9) 60.7 (6.3) 401 (38)
[image:3.612.96.522.82.124.2]lowed by a 3 min washing – re-equilibrating cycle that in-volved taking solvent A to 80% solvent B (0.1% formic acid in 90% acetonitrile – water) for 2 min and then chang-ing back to 100% solvent A for 1 min. A 10mL injection of each sample was analyzed. Recovery of spiked samples was 91.3% and the interassay coefficient of variation was 4.5%. Allantoin is released rapidly from muscle to blood in re-sponse to the non-enzymatic oxidation of urate and is then cleared into the urine relatively quickly (Benzie et al. 1999; Hellsten et al. 1997; Mikami et al. 2000). Allantoin was ex-pressed relative to the volume of urine produced and not corrected for creatinine, as the relationship between creati-nine and allantoin excretion is weak at high allantoin con-centrations.
Blood collection
Fasted blood samples (10 mL) were drawn from an ante-cubital vein into heparinized vacutainers; blood was taken 10 min before and 5 min after exercise. Hematocrit was de-termined in duplicate by microcentrifugation of blood in mi-crotubes and hemoglobin was measured using standard techniques (Drabkin 1965). The change in plasma volume was calculated according to the method of Dill and Costill (1974).
Collected blood was centrifuged at 1500g for 10 min at 4 8C. The plasma was collected and stored at –80 8C until later analysis. Two millilitres of red blood cells were washed with 20 mL of cold buffer (50 mmol/L Tris–HCl (pH 7.6), 5 mmol/L ethylenediaminetetraacetic acid, 1 mmol/L dithiothreitol) and again centrifuged at 1500g for 10 min at 48C. The supernatant was then removed and dis-carded and the red blood cells were lysed in 4 times their volume of ice-cold ddH2O (1 mL red blood cells to 4 mL
ddH2O). This mixture was then centrifuged (1500g for
10 min at 4 8C) and the remaining supernatant collected and frozen at –808C until later analysis.
Vitamin E
Plasma concentrations of vitamin E (a-tocopherol), total carotenoids, and total free cholesterol were determined by reverse-phase HPLC using the liquid–liquid extraction method of (Taibi and Nicotra 2002). Briefly, proteins were precipitated with Ethanol:BHT (200 gL–1), followed by a
hexane lipid extraction. After separation of the precipitated protein, 700 mL hexane was speed dried (Savant RVT400 and Savant SpeedVac SPDIIIV, Holbrook, NY, USA) and reconstituted with 100 mL methanol. Total carotenoids and vitamin E were mearsured using fluorometric detection and electrochemical detection for total cholesterol via injection of 40 mL into a LiChrospher C18 column (250 4 mm, 5 mm; Merck, Darmstadt, Germany), with a flow rate of 0.8 mLmin–1 and 10.3 MPa backpressure. Separate stock
solutions of dl-a-tocopherol (Fluka, Buchs, Switzerland) and lycopene and a- and b-carotene for total carotenoids and cholesterol (Sigma, St. Louis, Mo.) were used as exter-nal standards.
Malondialdehyde
HPLC was used to determine plasma malondialdehyde (MDA) using the method of Sim et al. (2003). The principle of this method is that malondialdehyde contained in plasma
is derivatized with 2,4-dinitrophenylhydrazine, which forms stable hydrazones that can be easily separated by HPLC us-ing diode array detection (Shimadzu, Kyoto, Japan).
Total antioxidant status
Total antioxidant status was determined by the method of Miller et al. (1993), which is based on the inhibition by anti-oxidants of the absorbance of the radical cation 2,2’-azinobis (3-ethylbenzthiazoline-6-sulfonate) (ABTS+). This radical
cation is formed by the interaction of ABTS with the ferryl-myoglobin radical species, generated by the activation of metmyoglobin with hydrogen peroxide. Antioxidant com-pounds suppress the absorbance of the ABTS+radical cation
to an extent and on a time scale dependent on the antioxi-dant capacity of the plasma. The assay was carried out on a Cobas Mira automated spectrophotometer (Roche Diagnos-tics, Basel, Switzerland). Plasma total antioxidant status was corrected for changes in plasma volume.
Antioxidant enzymes
Erythrocyte glutathione peroxidase (GPX) and superoxide dismutase (SOD) activities were determined according to the methods of Wheeler et al. (1990) and Madesh and Balasu-bramanian (1998), respectively. The assays were modified to be performed on the Cobas Mira spectrophotometer. All enzyme activities were normalized to haemoglobin concen-tration.
Statistical analysis
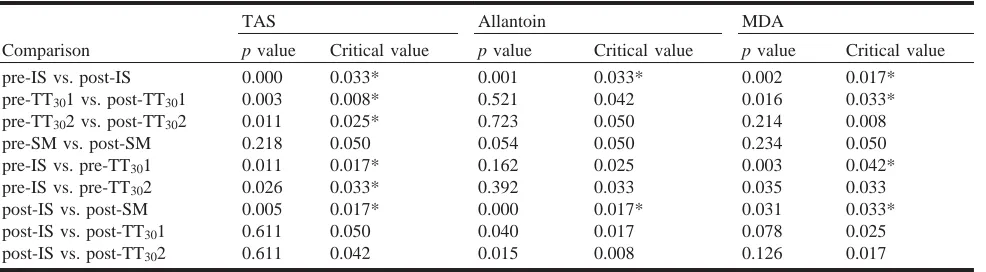
All statistical analyses were performed using SPSS ver-sion 10.0 for Windows (SPSS, Chicago, Ill.). Data was first tested for normality using the Kolmogorov–Smirnov and Shapiro–Wilk tests. To examine the effects of the 3 consec-utive days of training a time (pre- and post-exercise) trial (day 1, day 2, and day 3) repeated-measures analysis of var-iance (ANOVA) and an ANOVA for the absolute change in values over the 3 days was used with p < 0.05 as significant. When a significant main effect was found, differences be-tween trials were determined using the multiple-comparison false-discovery rate procedure (Curran-Everett 2000). The false-discovery rate was set at p < 0.05 (Table 2). Compari-sons were significant when the p value determined from a t test was less than the calculated critical value. In addition, percentage changes and effect sizes (ES) for the difference between pre- and post-exercise means were calculated. ES was interpreted as follows: 0.2 = small, 0.5 = moderate, and 0.8 = large; these terms are used in the results section (Thomas et al. 1991).
Results
The primary aim of this study was to investigate the changes in markers of oxidative stress and antioxidant de-fenses after consecutive days of exercise in highly trained cyclists. There were no significant differences between the control group and the exercising group for VO2 max, peak
differ-ences for pre-exercise measures for the interval session and submaximal trial (average exercise intensity of 58% VO2 max) for the experimental group (p > 0.05).
There was a significant timetrial interaction for plasma MDA concentration over the 3 days of high-intensity exer-cise (p = 0.046). The magnitude of the post-exerexer-cise in-crease in plasma MDA concentration across the 3 days was also significantly different (ES = 0.6, p = 0.036). Post-exercise plasma MDA concentration was significantly in-creased for the high-intensity interval session (18%, ES = 1.1) (Table 2). There was also a significant increase in plasma MDA concentration after the 30 km time trial 1 on day 2 (16%, ES = 0.8); however, the post-exercise increase for 30 km time trial 2 on day 3 was not significant (4%, ES = 0.3) (Fig. 2a). Pre-exercise MDA concentrations were sig-nificantly elevated on day 2 (ES = 1.0), but returned to baseline values on day 3 of the consecutive days of high-intensity exercise. Post-exercise MDA concentrations were not significantly increased for the submaximal session (3.3%, ES = 0.4) (Fig. 2a).
There was a significant main effect of time on urinary al-lantoin excretion over the 3 consecutive days of exercise (p = 0.031) (Fig. 2b). There was a large significant post-exer-cise increase in urinary allantoin excretion for the interval session on day 1 (171%, ES = 1.7). However, there were no significant increases in urinary allantoin excretion for 30 km time trial 1 on day 2 (38%, ES = 0.2) or 30 km time trial 2 on day 3 (23%, ES = 0.1). The magnitude of the change in urinary allantoin excretion was significantly reduced across the 3 consecutive days of high-intensity training (p < 0.01). There was a large post-exercise in-crease in urinary allantoin concentration following the sub-maximal session; however, this increase was not significant (61%, ES = 1.1).
Plasma TAS concentrations were significantly elevated post-exercise following the interval session on day 1 (13.4%, ES = 1.8) and both 30 km time trials on days 2 and 3 (8.3%, ES = 1.1 and 5.5%, ES = 0.7;, respectively) (p < 0.001). There was also a significant decrease in the magni-tude of post-exercise change in plasma TAS concentrations after exercise over the 3 consecutive days of high-intensity training (p = 0.039). Compared with pre-exercise values on day 1, pre-exercise plasma TAS was significantly elevated on days 2 (ES = 0.6) and 3 (ES = 0.8) of the consecutive
days of high-intensity exercise (Fig. 3). There was no signif-icant increase in plasma TAS concentration following the submaximal session (1.3%, ES = 0.2).
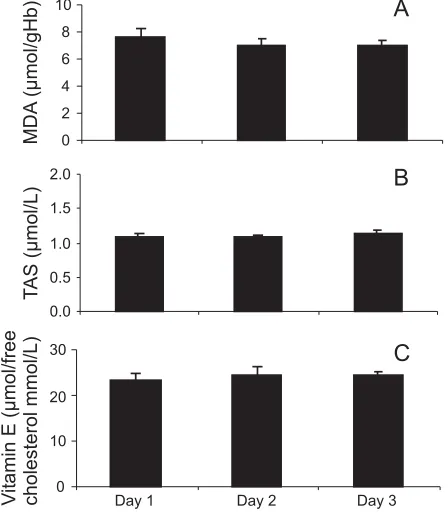
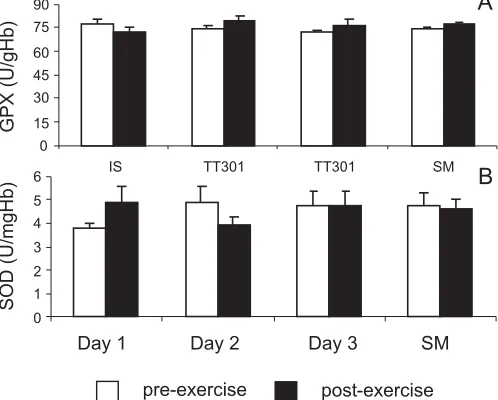
Plasma vitamin E concentration was significantly de-creased post-exercise on day 1 of consecutive days of high-intensity exercise (–10.1%, ES = 0.7); however, there were no significant changes detected between trials over the 3 consecutive days of exercise or following the submaximal trial (1.8%, ES = 0.1) (Fig. 4). Erythrocyte GPX and SOD activities remained unchanged following each exercise trial (Fig. 5).
Discussion
The aim of the present study was to determine the influ-ence of consecutive days of high-intensity exercise on markers of oxidative stress and antioxidant status in highly-trained cyclists. Post-exercise increases in biomarkers of ox-idative stress were reduced over 3 consecutive days of in-tense exercise, whereas resting plasma TAS concentrations were elevated on days 2 and 3. Although intense exercise may increase lipid peroxidation, urate oxidation, and plasma TAS, such alterations are not necessarily accompanied by changes in erythrocyte antioxidant activity.
Lipid peroxidation, as indicated by plasma MDA concen-tration, increased significantly after the interval session and the second day of high-intensity training (i.e., first 30 km time trial). Although both the interval session and the 30 km time trial on day 2 elevated post-exercise plasma MDA concentration, there was no increase for the 30 km time trial performed on day 3. Lovlin et al. (1987) investigated the re-lationship between exercise intensity and lipid peroxidation in moderately-trained males (VO2 max = 47 mLkg–1min–1)
and found that at exercise intensities of 40% and 70% VO2 max there was no evidence of oxidative stress assessed
from MDA. Exercise intensity on days 2 and 3 of the con-secutive days was comparable to 79% VO2 max, thereforeit
appears that the decrease in MDA concentration on day 3 was not related to a decrease in exercise intensity.
[image:5.612.63.556.80.216.2]In the same pattern as plasma MDA concentrations, uri-nary allantoin excretion was reduced over the 3 consecutive days of high-intensity exercise. Allantoin is produced from the non-enzymatic oxidation of urate and elevated resting concentrations of urinary allantoin have been associated
Table 2. Calculations for false-discovery rate procedure.
TAS Allantoin MDA
Comparison p value Critical value p value Critical value p value Critical value
pre-IS vs. post-IS 0.000 0.033* 0.001 0.033* 0.002 0.017*
pre-TT301 vs. post-TT301 0.003 0.008* 0.521 0.042 0.016 0.033*
pre-TT302 vs. post-TT302 0.011 0.025* 0.723 0.050 0.214 0.008
pre-SM vs. post-SM 0.218 0.050 0.054 0.050 0.234 0.050
pre-IS vs. pre-TT301 0.011 0.017* 0.162 0.025 0.003 0.042*
pre-IS vs. pre-TT302 0.026 0.033* 0.392 0.033 0.035 0.033
post-IS vs. post-SM 0.005 0.017* 0.000 0.017* 0.031 0.033*
post-IS vs. post-TT301 0.611 0.050 0.040 0.017 0.078 0.025
post-IS vs. post-TT302 0.611 0.042 0.015 0.008 0.126 0.017
Note: False-discovery rate set at 0.05. TAS, total antioxidant status; MDA, malondialdehyde; SM, submaximal; IS, interval session; TT30, 30 km
time trial. p value = achieved significance level from t test.
with oxidative stress conditions such as diabetes and rheu-matoid arthritis (Benzie et al. 1999). Allantoin was signifi-cantly increased following the interval session on day 1; however, there was no increase in response to the 30 km time trial on days 2 and 3. It remains unknown whether al-lantoin excretion was unchanged following both 30 km time trials in response to an upregulation of TAS from exercise on day 1, either owing to a decrease in the availability of urate as a substrate or as the result of unchanged levels of urate oxidation. Although allantoin excretion was not signif-icantly increased following the submaximal trial, there was a large effect of exercise (ES = 1.1) when compared with days 2 and 3 of the consecutive days of exercise. Allantoin has been produced following exercise at 100% and 90% VO2 max, but not at 40% VO2 max (Mikami et al. 2000). In
the present study, there was a large (61%, ES = 1.1) post-exercise increase in allantoin excretion following submaxi-mal exercise (average intensity of 58% VO2 max); however,
the post-exercise increase following the 30 km time trial on days 2 and 3 (average intensity of 79% VO2 max) was small
(38%, ES = 0.2 and 23%, ES = 0.1, respectively). Post-exer-cise allantoin excretion following exerPost-exer-cise on days 2 and 3, which was at a greater intensity than during the submaximal trial, may have been reduced as a result of adaptations to ex-ercise on day 1. The reduction in urinary allantoin concen-trations observed with consecutive days of training may indicate a decrease in ROS production, or a greater contribu-tion of antioxidants other than urate to scavenge ROS.
The progressive decline in markers of oxidative stress over 3 consecutive days of exercise may reflect a reduction in the production of ROS, an up-regulation and (or) adapta-tion of antioxidant defense mechanisms, or a decrease in substrate availability. Post-exercise plasma TAS concentra-tions were elevated following exercise on day 1 and resting
plasma concentrations were elevated on days 2 and 3. This upregulation of plasma antioxidants may represent a positive adaptation to consecutive days of high-intensity training. A major contributor to the total antioxidant activity of plasma is the antioxidant activity of urate (Subudhi et al. 2001). The amount of urate present in vivo prior to exercise has been shown to influence the extent of ROS production and reduce lipid peroxidation following cycling to fatigue (approx. 10– 18 min) (Green and Fraser 1988; Mikami et al. 2000). Although we did not measure plasma urate, previous reports indicate the plasma urate concentration is elevated 40% for 24 h following intermittent sprint cycle training at 120% VO2 max (Green and Fraser 1988), which was an intensity
lower than the interval session on day 1 in the present study. The increase in TAS concentration in the present study on days 2 and 3 may have contributed to a reduction in lipid peroxidation, as indicated by the reduced magnitude of post-exercise MDA concentration over the 3 consecutive days of high-intensity exercise. In contrast to the present findings, levels of lipid peroxidation following a half mara-thon have remained unchanged despite higher resting levels of plasma total antioxidant capacity (Child et al. 2000). The amount of protection against lipid peroxidation offered by elevated pre-exercise urate levels may be influenced by ex-ercise duration.
[image:6.612.77.301.94.351.2]Although plasma TAS concentrations were not depleted, vitamin E concentrations following the interval session were significantly reduced when compared with the submax-imal exercise trial (–10.1% vs. 1.8%, respectively). Previous research has shown a decrease in plasma vitamin E concen-tration following a 30 s cycle sprint (Hutler et al. 2001) and a decrease in response to maximal treadmill exercise (Viguie et al. 1993; Vasankari et al. 1997). Following submaximal exercise, studies have reported either an increase or no
change in plasma vitamin E concentration (Burton et al. 1983). Together, with the present findings, these data sug-gest that a high-intensity interval session may more readily deplete vitamin E when compared with a 30 km time trial, to protect against increased oxidative stress. Vitamin E is an important component of the lipid membrane and offers protection against lipid peroxidation (Duthie et al. 1990; Du-faux et al. 1997; Marzatico et al. 1997; Groussard et al. 2003). The decrease in plasma vitamin E following the in-terval session may have contributed to the increased suscept-ibility of lipids to peroxidation following the same trial, as indicated by the increase in plasma MDA concentration. Plasma MDA concentrations were, however, significantly elevated following the 30 km time trial on day 2, whereas plasma vitamin E levels were unchanged. The protective role of endogenous vitamin E in preventing lipid peroxida-tion at varying exercise intensities requires further investiga-tion.
[image:7.612.332.544.116.247.2]Reports of alterations in erythrocyte antioxidant enzyme activity after exercise are equivocal (Duthie et al. 1990). In the present study, erythrocyte GPX and SOD activities did
[image:7.612.67.276.160.473.2]Fig. 2. Plasma malondialdehyde concentration (A) and urinary al-lantoin excretion (B) pre- and post-exercise. Day 1, interval ses-sion; day 2, 30 km time trial 1; day 3, 30 km time trial 2; SM, submaximal. Data are mean ± SEM. Asterisk (*) denotes signifi-cantly different versus pre-exercise, p < 0.01. Dagger ({) indicates that the change from pre- to post-exercise was significantly differ-ent between interval and SM sessions. Double dagger ({) indicates a significant difference between pre-exercise values.
[image:7.612.316.565.298.498.2]Fig. 3. Plasma total antioxidant status pre- and post-exercise. Day 1, interval session; day 2, 30 km time trial 1; day 3, 30 km time trial 2; SM, submaximal. Data are mean ± SEM. Asterisk (*) de-notes significantly different versus pre-exercise. Dagger ({) indi-cates that the change from pre- to post-exercise was significantly different between interval and SM sessions. Double dagger ({) in-dicates significant difference between pre-exercise values.
Fig. 4. Plasma vitamin E pre- and post-exercise. Day 1, interval session: day 2, 30 km time trial 1; day 3, 30 km time trial 2; SM, submaximal. Data are mean ± SEM. Asterisk (*) denotes signifi-cantly different versus pre-exercise.
[image:7.612.68.276.585.741.2]not change in response to 3 consecutive days of high-inten-sity exercise or submaximal exercise. These findings are consistent with those of Duthie et al. (Subudhi et al. 2001), who found no change in erythrocyte GPX, catalase, or SOD activities in 7 highly trained males immediately and 5 d fol-lowing a half-marathon. GPX activity has also remained un-changed over a period of land and snow training in elite alpine skiers (Tauler et al. 1999). In contrast to the present findings, previous research showed increased GPX activity in trained athletes both immediately and during 60 min of recovery following a duathlon race (Tauler et al. 1999). SOD activity has also been reported to increase following a 2800 km, 20 d road race (Mena et al. 1991). It is possible that the duration of exercise in the present study may not have been sufficient to alter erythrocyte antioxidant enzyme activities.
Data from the present investigation suggest that although oxidative stress occurs following the initial days of high-intensity exercise, there is no cumulative effect of succes-sive days of high-intensity exercise on the oxidation of lipids and protein in highly trained cyclists. TAS remains elevated for 24 h following high-intensity intermittent exer-cise and may offer protection against subsequent oxidative stress over consecutive days of high-intensity training. Although intense exercise may increase lipid peroxidation, urate oxidation, and plasma TAS, such alterations are not necessarily accompanied by changes in erythrocyte antioxi-dant activity. As antioxiantioxi-dant defenses were not depleted, highly-trained cyclists appear to have antioxidant defense systems that cope with ROS production associated with 3 consecutive days of high-intensity training. Mechanisms that offer additional protection from oxidative stress during the initial days of consecutive days of high-intensity exer-cise, such as antioxidant supplementation that may enhance plasma TAS levels and plasma vitamin E levels, require fur-ther investigation.
References
Abuja, P.M. 2001. Atherosclerosis: cell biology and lipoproteins. Curr. Opin. Lipidol. 12: 591–593. doi:10.1097/00041433-200110000-00017. PMID:11561180.
Benzie, I.F., Chung, W., and Tomlinson, B. 1999. Simultaneous measurement of allantoin and urate in plasma: analytical evalua-tion and potential clinical applicaevalua-tion in oxidant:antioxidant bal-ance studies. Clin. Chem. 45: 901–904. PMID:10352002. Burton, G.W., Cheeseman, K.H., Doba, T., Ingold, K.U., and
Sla-ter, T.F. 1983. Vitamin E as an antioxidant in vitro and in vivo. Ciba Found. Symp. 101: 4–18. PMID:6557906.
Child, R.B., Wilkinson, D.M., and Fallowfield, J.L. 2000. Effects of a training taper on tissue damage indices, serum antioxidant capacity and half-marathon running performance. Int. J. Sports Med. 21: 325–331. doi:10.1055/s-2000-3778. PMID:10950440. Criswell, D., Powers, S., Dodd, S., Lawler, J., Edwards, W.,
Re-nshler, K., et al. 1993. High intensity training-induced changes in skeletal muscle antioxidant enzyme activity. Med. Sci. Sports Exerc. 25: 1135–1140. PMID:8231758.
Curran-Everett, D. 2000. Multiple comparisons: philosophies and illustrations. Am. J. Physiol. Regul. Integr. Comp. Physiol. 279: R1–R8. PMID:10896857.
Dill, D.B., and Costill, D.L. 1974. Calculation of percentage changes in volumes of blood, plasma, and red cells in dehydra-tion. J. Appl. Physiol. 37: 247–248. PMID:4850854.
Drabkin, D.L. 1965. The molecular weight of haemoglobin, its iron and nitrogen content and optical properties—their relevance in the problem of a rReference standard for haemoglobin measure-ment. Bibl. Haematol. 21: 33–42. PMID:14336774.
Dufaux, B., Heine, O., Kothe, A., Prinz, U., and Rost, R. 1997. Blood glutathione status following distance running. Int. J. Sports Med. 18: 89–93. doi:10.1055/s-2007-972601. PMID: 9081263.
Duthie, G.G., Robertson, J.D., Maughan, R.J., and Morrice, P.C. 1990. Blood antioxidant status and erythrocyte lipid peroxida-tion following distance running. Arch. Biochem. Biophys. 282: 78–83. doi:10.1016/0003-9861(90)90089-H. PMID:2221920. Green, H.J., and Fraser, I.G. 1988. Differential effects of exercise
intensity on serum uric acid concentration. Med. Sci. Sports Ex-erc. 20: 55–59. PMID:3343917.
Grootveld, M., and Halliwell, B. 1987. Measurement of allantoin and uric acid in human body fluids. A potential index of free-radical reactions in vivo? Biochem. J. 243: 803–808. PMID:3663100.
Groussard, C., Machefer, G., Rannou, F., Faure, H., Zouhal, H., Sergent, O., et al. 2003. Physical fitness and plasma non-enzy-matic antioxidant status at rest and after a wingate test. Can. J. Appl. Physiol. 28: 79–92. PMID:12671197.
Hellsten, Y., Tullson, P.C., Richter, E.A., and Bangsbo, J. 1996. Oxidation of urate in human skeletal muscle during exercise. Free Radic. Biol. Med. 22: 169–174.
Hutler, M., Woweries, S., Leithauser, R., Boning, D., and Beneke, R. 2001. Exercise-induced changes in blood levels of alpha-to-copherol. Eur. J. Appl. Physiol. 85: 151–156. PMID:11513309. Jenkins, R.R., and Goldfarb, A. 1993. Introduction: oxidant stress,
aging and exercise. Med. Sci. Sports Exerc. 25: 210–212. PMID:8450723.
Ji, L.L. 2002. Exercise-induced modulation of antioxidant defense. Ann. N. Y. Acad. Sci. 959: 82–92. PMID:11976188.
Konig, D., Wagner, K.H., Elmadfa, I., and Berg, A. 2001. Exercise and oxidative stress: significance of antioxidants with reference to inflammatory, muscular, and systemic stress. Exerc. Immunol. Rev. 7: 108–133. PMID:11579745.
Lovlin, R., Cottle, W., Pyke, I., Kavanagh, M., and Belcastro, A. 1987. Are indices of free radical damage related to exercise in-tensity. Eur. J. Appl. Physiol. Occup. Physiol. 56: 313–316. PMID:3569239.
Madesh, M., and Balasubramanian, K.A. 1998. Microtiter plate assay for superoxide dismutase using MTT reduction by super-oxide. Indian J. Biochem. Biophys. 35: 184–188. PMID: 9803669.
Marzatico, F., Pansarasa, O., Bertorelli, L., Somenzini, L., and Della Valle, G. 1997. Blood free radical antioxidant enzymes and lipid peroxides following long-distance and lactacidemic performances in highly trained aerobic and sprint athletes. J. Sports Med. Phys. Fitness, 37: 235–239. PMID:9509820. Matuszczak, Y., Farid, M., Jones, J., Lansdowne, S., Smith, M.A.,
Taylor, A.A., et al. 2005. Effects of N-acetylcysteine on glu-tathione oxidation and fatigue during handgrip exercise. Muscle Nerve, 32: 633–638. doi:10.1002/mus.20385. PMID:16025522. Mena, P., Maynar, M., Gutierrez, J.M., Maynar, J., Timon, J., and
Campillo, J.E. 1991. Erythrocyte free radical scavenger enzymes in bicycle professional racers. Adaptation to training. Int. J. Sports Med. 12: 563–566. PMID:1797698.
Merry, P., Grootveld, M., Lunec, J., and Blake, D.R. 1991. Oxida-tive damage to lipids within the inflamed human joint provides evidence of radical-mediated hypoxic-reperfusion injury. Am. J. Clin. Nutr. 53(Suppl. 1): 362S–369S. PMID:1985412.
L., Monici, M.C., et al. 2006. Lipid peroxidation inhibition blunts nuclear factor-kappaB activation, reduces skeletal muscle degeneration, and enhances muscle function in mdx mice. Am. J. Pathol. 168: 918–926. doi:10.2353/ajpath.2006.050673. PMID:16507907.
Mikami, T., Yoshino, Y., and Ito, A. 2000. Does a relationship ex-ist between the urate pool in the body and lipid peroxidation during exercise? Free Radic. Res. 32: 31–39. doi:10.1080/ 10715760000300041. PMID:10625215.
Miller, N.J., Rice-Evans, C., Davies, M.J., Gopinathan, V., and Milner, A. 1993. A novel method for measuring antioxidant ca-pacity and its application to monitoring the antioxidant status in premature neonates. Clin. Sci. (Lond.), 84: 407–412. PMID: 8482045.
Okamura, K., Doi, T., Hamada, K., Sakurai, M., Yoshioka, Y., Mit-suzono, R., et al. 1997. Effect of repeated exercise on urinary 8-hydroxy-deoxyguanosine excretion in humans. Free Radic. Res. 26: 507–514. PMID:9212344.
Petibois, C., and Deleris, G. 2005. Erythrocyte adaptation to oxida-tive stress in endurance training. Arch. Med. Res. 36: 524–531. doi:10.1016/j.arcmed.2005.03.047. PMID:16099333.
Pyne, D.B. 1994. Exercise-induced muscle damage and inflamma-tion: a review. Aust. J. Sci. Med. Sport, 26: 49–58. PMID:8665277.
Senturk, U.K., Gunduz, F., Kuru, O., Aktekin, M.R., Kipmen, D., Yalcin, O., et al. 2001. Exercise-induced oxidative stress affects erythrocytes in sedentary rats but not exercise-trained rats. J. Appl. Physiol. 91: 1999–2004. PMID:11641336.
Shingfield, K.J., and Offer, N.W. 1999. Simultaneous determina-tion of purine metabolites, creatinine and pseudouridine in rumi-nant urine by reversed-phase high-performance liquid chromatography. J. Chromatogr. B Biomed. Sci. Appl. 723: 81– 94. doi:10.1016/S0378-4347(98)00549-0. PMID:10080636. Sim, A.S., Salonikas, C., Naidoo, D., and Wilcken, D.E. 2003.
Im-proved method for plasma malondialdehyde measurement by high-performance liquid chromatography using methyl malon-dialdehyde as an internal standard. J. Chromatogr. B Analyt. Technol. Biomed. Life Sci. 785: 337–344. PMID:12554147. Subudhi, A.W., Davis, S.L., Kipp, R.W., and Askew, E.W. 2001.
Antioxidant status and oxidative stress in elite alpine ski racers. Int. J. Sport Nutr. Exerc. Metab. 11: 32–41. PMID:11334023. Taibi, G., and Nicotra, C.M. 2002. Development and validation of
a fast and sensitive chromatographic assay for all-trans-retinol and tocopherols in human serum and plasma using liquid-liquid extraction. J. Chromatogr. B Analyt. Technol. Biomed. Life Sci. 780: 261–267. PMID:12401351.
Tauler, P., Gimeno, I., Aguilo, A., Guix, M.P., and Pons, A. 1999. Regulation of erythrocyte antioxidant enzyme activities in ath-letes during competition and short-term recovery. Pflugers Arch. 438: 782–787. doi:10.1007/s004240051107. PMID: 10591066.
Thomas, J.R., Salazar, W., and Landers, D.M. 1991. What is miss-ing in p <.05? Effect size. Res. Q. Exerc. Sport, 62: 344–348. PMID:1925064.
Vasankari, T.J., Kujala, U.M., Vasankari, T.M., Vuorimaa, T., and Ahotupa, M. 1997. Effects of acute prolonged exercise on-serum and LDL oxidation and antioxidant defences. Free Radic. Biol. Med. 22: 509–513. doi:10.1016/S0891-5849(96)00373-5. PMID:8981043.
Viguie, C.A., Frei, B., Shigenaga, M.K., Ames, B.N., Packer, L., and Brooks, G.A. 1993. Antioxidant status and indexes of oxida-tive stress during consecuoxida-tive days of exercise. J. Appl. Physiol. 75: 566–572. PMID:7693646.