Published by The Economic
and Social Research Institute
Whitaker Square Sir John Rogerson’s
Quay Dublin 2
Quarterly
Economic
Commentary
Winter 2010
ALANBARRETT
IDEKEARNEY
THOMASCONEFREY
CORMACO’SULLIVAN
ESRI
THEECONOMIC ANDSOCIALRESEARCHINSTITUTE ISSN 0376-7191
E ESRI
QUAR
TERL
Y
ECONOMIC COMMENT
AR
Y
Alan Bar
re
tt,
Ide K
earne
y,
Thomas Conefr
e
y, Cormac O’Sullivan
W
inter 2010
Q
U A R T E R LY
E
C O N O M I C
C
O M M E N TA R Y
Winter 2010
A
LANB
ARRETTI
DEK
EARNEYT
HOMASC
ONEFREYC
ORMACO’S
ULLIVANThe forecasts in this Commentary are based on data available by early-January 2011
R
E S E A R C H
B
U L L E T I N
10/4
Editor: Tim Callan
Available to download from www.esri.ie
The Economic and Social Research Institute (Limited Company No 18269) Registered office: Whitaker Square, Sir John Rogerson’s Quay, Dublin 2
Price €90 per copy or €350 per year, (including Medium-Term Review, 2008-2015)
Alan Barrett is a Research Professor, Ide Kearney is an Associate Research Professor and both are Editors of the Commentary, Thomas Conefrey was a Research Analyst and Cormac O’Sullivan is a Research Assistant at the Economic and Social Research Institute (ESRI).
The Commentary and Research Bulletin contained within have been accepted for publication
CONTENTS
Page
QUARTERLY ECONOMIC COMMENTARY
Alan Barrett, Ide Kearney, Thomas Conefrey and Cormac O’Sullivan
SUMMARY 1
Forecast National Accounts 2 The International Economy 5 The Domestic Economy 11 General Assessment 44
RESEARCH BULLETIN 10/4
A Good News Story About Irish Health Care
Richard Layte 47
On International Equity Weights and National Decision Making on Climate Change 51
David Anthoff and Richard S.J. Tol
Progression in Higher Education: The Value of Multi-Variate Analysis 55
Selina McCoy, Delma Byrne
Cultural Differences in Parenting Practices 57
Aisling Murray
S
UMMARY
T
ABLE
2009 2010(e)* 2011(f) 2012(f)
OUTPUT
(Real Annual Growth %)
Private Consumer Expenditure -7.0 -1 - ¾ - ½ Public Net Current Expenditure -4.4 -5 -3½ -3 Investment -31.0 -24½ -6 3¼
Exports -4.1 8¾ 6 5
Imports -9.7 4 3 ¾ 3¼
Gross Domestic Product (GDP) -7.6 ¼ 1½ 2¼ Gross National Product (GNP) -10.7 -1¼ ¼ 1½ GNP per capita (constant prices) -11.4 -1½ ½ 1½
PRICES
(Annual Growth %)
Harmonised Index of Consumer Prices (HICP) -1.7 -1½ 1 1 Consumer Price Index (CPI) -4.5 -1 2 1½
Wage Growth -0.8 -3 -1 0
LABOUR MARKET
Employment Levels (ILO basis (000s)) 1,929 1,851 1,826 1,831 Unemployment Levels (ILO basis (000s)) 259 287 287 273 Unemployment Rate (as % of Labour Force) 11.8 13½ 13½ 13
PUBLIC FINANCE
Exchequer Balance (€bn) -24.6 -18.7 -17.9 -15.8 General Government Balance (€bn) -23.0 -50.2 -15.4 -12.8 General Government Balance (% of GDP) -14.4 -31½ -9 ½ -7¾ Excluding Bank Payments -11.9 -11½
General Government Debt (% of GDP) 65.6 93½ 99 104½
EXTERNAL TRADE
Balance of Payments Current Account (€bn) -4.9 -0.1 1.7 2.9 Current Account (% of GNP) -3.7 -0 1¼ 2¼
EXCHANGE AND INTEREST RATES (end of year)
US$/€ Exchange Rate 1.39 1.31 1.29 1.29 STG£/€ Exchange Rate 0.89 0.85 0.84 0.84 Main ECB Interest Rate 1.00 1.00 1.25 2.25
1
S
UMMARY
T
he forecasts in this Commentary see GDP growing by 1½ per cent in real terms in 2011 and by 2¼ per cent in 2012. The corresponding figures for GNP are ¼ per cent in 2011 and 1½ per cent in 2012. Following the pattern of 2010, the growth which is envisaged for 2011 and 2012 is made up of a strong export performance together with further contractions in domestic demand.Exports are forecast to grow by 6 per cent in 2011 and by 5 per cent in 2012. By contrast, consumption is expected to fall by ¾ per cent in 2011 and by a further ½ per cent in 2012. On-going uncertainty with respect to job stability, wages and taxation are likely to act against any rebound in consumption spending over the forecast horizon. Government purchases of goods and services and public investment are expected to continue shrinking in both 2011 and 2012. We see the banking crisis as being a key factor in the continued depressed level of both consumption and investment through an absence of affordable credit.
Our GDP and GNP growth forecasts are lower than the corresponding forecasts which underpinned Budget 2011. As a result, we see the ratio of general government debt to GDP reaching 104.5 per cent in 2012, as compared to 102 per cent which is the forecast figure in Budget 2011. As we discuss in the General Assessment, given the uncertainties surrounding all forecasts, we would not place too great an emphasis on the difference. Instead, we take it as being an on-going indicator of the challenges which are faced in restoring the public finances to a sustainable path. We expect the general government deficit to be 9.6 per cent of GDP in 2011 and 7.8 per cent in 2012.
While our forecasts envisage positive growth in both GNP and GDP for the first time since 2007, the rates of growth are still slow. For 2011, we see the growth in GNP and GDP being accompanied by continued employment falls as output growth is achieved through productivity growth. Employment is expected to average 1.83 million in 2011, down 1¼ per cent on the 2010 number. We do expect employment growth in 2012 but at just 5,000, this is tiny relative to the labour force. The rate of unemployment is expected to average 13 ½ per cent in 2011 and 13 per cent in 2012. Net outward migration is forecast to be 100,000 over the two year period April 2010 to April 2012. The highest rate of net outflow in the 1980s occurred in 1989 when the rate reached 44,000. Hence, our forecast for an average annual net outflow of 50,000 is high in historic terms, albeit against a larger population base.
We expect the Consumer Price Index (CPI) to average 2 per cent in 2011 and 1 ½ per cent in 2012. For Harmonised Index of Consumer Prices (HICP), we expect 1 per cent in both 2011 and 2012. We expect wages to fall by 1 per cent in 2011 and for them to remain constant next year.
2
NATIONAL ACCOUNTS 2010 (Estimate)
A: Expenditure on Gross National Product
2009 2010 Change in 2010
Estimate €bn %
€bn €bn Value Volume Value Price Volume
Private Consumer Expenditure 84.3 81.8 -2.5 -0.8 -3 -2 -1
Public Net Current Expenditure 27.7 26.1 -1.6 -1.4 -5 ¾ - ¾ -5 Gross Fixed Capital Formation 24.7 18.0 -6.8 -6.1 -27 ¼ -3 ¾ -24 ½ Exports of Goods and Services (X) 144.8 156.9 12.2 12.5 8 ½ - ¼ 8 ¾
Physical Changes in Stocks -2.3 -0.1 2.2 1.7
Final Demand 279.3 282.8 3.5 5.0 1 ¼ - ½ 1 ¾
less: 0.0 0.0 0.0 0.0
Imports of Goods and Services (M) 120.4 124.6 4.2 4.9 3 ½ - ½ 4 less:
Statistical Discrepancy -0.7 -0.7 0.0 -0.1
GDP at Market Prices 159.6 159.0 -0.7 0.2 - ½ - ½ ¼
less:
Net Factor Payments (F) -28.4 -30.8 -2.4 -2.1 8 ½ 1 7 ½
GNP at Market Prices 131.2 128.1 -3.1 -1.8 -2 ¼ -1 -1 ¼
B: Gross National Product by Origin
2009 2010 Change in 2010 Estimate
€bn €bn €bn %
Agriculture, Forestry, Fishing 2.2 2.4 0.2 10
Non-Agricultural: Wages, etc. 72.7 67.9 -4.8 -6 ½
Other: 53.9 59.3 5.4 10
Adjustments: Stock Appreciation 1.0 -0.2 Statistical Discrepancy -0.7 -0.7
Net Domestic Product 129.1 128.6 -0.4 - ¼
less:
Net Factor Payments -28.4 -30.8 -2.4 8 ½
National Income 100.7 97.8 -2.8 -2 ¾
Depreciation 14.8 15.0 0.2 1 ¼
GNP at Factor Cost 115.4 112.8 -2.6 -2 ¼
Taxes less Subsidies 15.8 15.3 -0.5 -3
GNP at Market Prices 131.2 128.1 -3.1 -2 ¼
C: Balance of Payments on Current Account
2009 2010 Change in 2010 Estimate
€bn €bn €bn
Exports (X) less Imports (M) 24.4 32.4 8.0
Net Factor Payments (F) -28.4 -30.8 -2.4
Net Transfers -0.9 -1.7 -0.8
Balance on Current Account -4.9 -0.1 4.8
as % of GNP -3.7 -0.1 3.6
D: GNDI and Terms of Trade
2009 2010 2010 Volume
Change Estimate
€bn €bn €bn %
Terms of Trade Loss or Gain 0.5
GNP Adjusted for Terms of Trade 131.2 130.0 -1.3 -1
GNDI* 130.3 128.2 -2.1 -1½
National Resources** 130.4 127.0 -3.4 -2½
FORECAST NATIONAL ACCOUNTS 2011
A: Expenditure on Gross National Product
2010 2011 Change in 2011
Estimate Forecast €bn %
€bn €bn Value Volume Value Price Volume
Private Consumer Expenditure 81.8 81.6 -0.2 -0.6 - ¼ ½ - ¾
Public Net Current Expenditure 26.1 25.0 -1.2 -0.9 -4 ½ -1 -3 ½
Gross Fixed Capital Formation 18.0 17.0 -1.0 -1.1 -5 ½ ½ -6
Exports of Goods and Services (X) 156.9 166.8 9.9 9.4 6 ¼ ¼ 6
Physical Changes in Stocks -0.1 0.0 0.1 0.1
Final Demand 282.8 290.4 7.7 7.0 2 ¾ ¼ 2 ½
less:
Imports of Goods and Services (M) 124.6 129.8 5.2 4.6 4 ¼ ½ 3 ¾
less:
Statistical Discrepancy -0.7 -0.7 0.0 0.0
GDP at Market Prices 159.0 161.4 2.4 2.4 1 ½ -0 1 ½
less:
Net Factor Payments (F) -30.8 -33.7 -2.8 -2.2 9 ¼ 2 7
GNP at Market Prices 128.1 127.7 -0.4 0.4 - ¼ - ¾ ¼
B: Gross National Product by Origin
2010 2011 Change in 2011 Estimate Forecast
€bn €bn €bn %
Agriculture, Forestry, Fishing 2.4 2.5 0.1 5
Non-Agricultural: Wages, etc. 67.9 66.1 -1.7 -2 ½
Other: 59.3 62.6 3.3 5 ½
Adjustments: Stock Appreciation -0.2 -0.2 0.0 0
Statistical Discrepancy -0.7 -0.7 0.0 0
Net Domestic Product 128.6 130.3 1.7 1 ¼
less:
Net Factor Payments -30.8 -33.7 -2.8 9 ¼
National Income 97.8 96.6 -1.2 -1 ¼
Depreciation 15.0 15.3 0.3 2
GNP at Factor Cost 112.8 111.9 -0.9 - ¾
Taxes less Subsidies 15.3 15.8 0.5 3
GNP at Market Prices 128.1 127.7 -0.4 - ¼
C: Balance of Payments on Current Account
2010 2011 Change in 2011 Estimate Forecast
€bn €bn €bn
Exports (X) less Imports (M) 32.4 37.1 4.7
Net Factor Payments (F) -30.8 -33.7 -2.8
Net Transfers -1.7 -1.7 0.0
Balance on Current Account -0.1 1.7 1.8
as % of GNP -0.1 1.3 1.4
D: GNDI and Terms of Trade
2010 2011 2011Volume
Change Estimate
€bn €bn €bn %
Terms of Trade Loss or Gain -0.4
GNP Adjusted for Terms of Trade 128.1 128.1 0.0 0
GNDI* 126.4 126.4 0.0 0
National Resources** 126.5 126.5 0.0 0
•GNDI is GDP adjusted for terms of trade and net international transfers. ** GNDI including capital transfers.
4
FORECAST NATIONAL ACCOUNTS 2012
A: Expenditure on Gross National Product
2011 2012 Change in 2012
Forecast Forecast €bn %
€bn €bn Value Volume Value Price Volume
Private Consumer Expenditure 81.6 82.2 0.6 -0.4 ¾ 1 ¼ - ½
Public Net Current Expenditure 25.0 23.8 -1.2 -0.7 -4 ½ -1 ¾ -3
Gross Fixed Capital Formation 17.0 17.6 0.6 0.6 3 ¾ ¼ 3 ¼
Exports of Goods and Services (X) 166.8 176.1 9.3 8.3 5 ½ ½ 5
Physical Changes in Stocks 0.0 0.1 0.1 0.0
Final Demand 290.4 299.9 9.5 8.1 3 ¼ ½ 2 ¾
less:
Imports of Goods and Services (M) 129.8 135.3 5.5 4.4 4 ¼ ¾ 3 ¼
less:
Statistical Discrepancy -0.7 -0.7 0.0 0.0
GDP at Market Prices 161.4 165.3 4.0 3.7 2 ½ ¼ 2 ¼
less:
Net Factor Payments (F) -33.7 -36.2 -2.5 -1.8 7 ½ 2 5 ¼
GNP at Market Prices 127.7 129.2 1.4 2.0 1 ¼ - ½ 1 ½
B: Gross National Product by Origin
2011 2012 Change in 2012 Forecast Forecast
€bn €bn €bn %
Agriculture, Forestry, Fishing 2.5 2.6 0.1 2
Non-Agricultural: Wages, etc. 66.1 66.3 0.1 ¼
Other: 62.6 65.3 2.8 4 ½
Adjustments: Stock Appreciation -0.2 0.0 0.2 -100
Statistical .Discrepancy -0.7 -0.7 0.0 0
Net Domestic Product 130.3 133.5 3.2 2 ½
less:
Net Factor Payments -33.7 -36.2 -2.5 7 ½
National Income 96.6 97.3 0.6 ¾
Depreciation 15.3 15.6 0.4 2 ½
GNP at Factor Cost 111.9 112.9 1.0 1
Taxes less Subsidies 15.8 16.2 0.4 2 ½
GNP at Market Prices 127.7 129.2 1.4 1 ¼
C: Balance of Payments on Current Account
2011 2012 Change in 2012 Estimate Forecast
€bn €bn €bn
Exports (X) less Imports (M) 37.1 40.8 3.8
Net Factor Payments (F) -33.7 -36.2 -2.5
Net Transfers
-1.7 -1.7 0.0
Balance on Current Account 1.7 2.9 1.3
as % of GNP 1.3 2.3 1.0
D: GNDI and Terms of Trade
2011 2012 2012 Volume Change Estimate
€bn €bn €bn %
Terms of Trade Loss or Gain -0.5
GNP Adjusted for Terms of Trade 127.7 129.2 1.5 1 ¼
GNDI* 126.0 127.5 1.5 1 ¼
National Resources** 126.1 127.6 1.5 1 ¼
5
T
HE
I
NTERNATIONAL
E
CONOMY
G
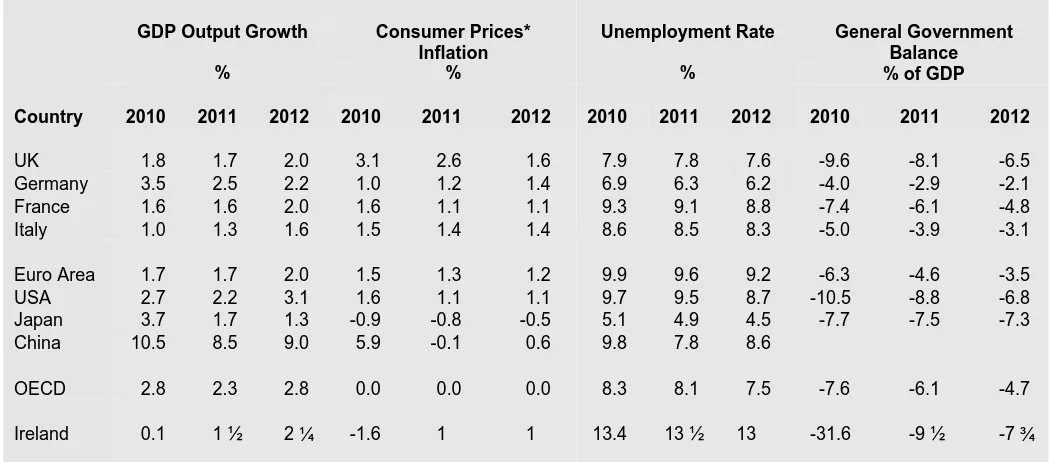
reat uncertainty surrounds the outlook for the international economy, even as the economic recovery continues. The resilient performance in 2010 of many of the world’s major economies meant that their forecasts for 2010 have been revised upwards since the Autumn Commentary. Driving this more positive outlook is a stronger than expected recovery in Britain, the Euro Area and Japan. The output of the combined OECD countries is now estimated to have increased by 2.8 per cent according to the OECDEconomic Outlook,1 up marginally from 2.7 per cent in earlier forecasts. As
mentioned in previous Commentaries, there is significant variation in international growth rates, although the division is no longer simply between developed and emerging economies. Consumption demand in the United States and China brought about export-led growth in Europe and the rest of Asia, leading to some convergence in global growth rates, even as the performance of the US economy as a whole faltered somewhat in mid 2010.Emerging economies continued to grow steadily throughout 2010, leading to an increase in their share of global GDP.
The outlook for OECD output growth in 2011 has been revised downward from 2.8 per cent to 2.3 per cent. The evidence for a protracted recovery in the USA, greater austerity in some European economies and the need for household deleveraging across the developed world are expected to depress economic activity throughout the year. With economic growth expected to remain robust in emerging economies, the pattern of the global recovery looks likely to become more unequal in 2011. In 2012, a return to more robust growth is expected in the USA and Europe, resulting in OECD output growth of 2.8 per cent.
Following disappointing mid-year results, fears of a return to negative output growth in the USA increased. GDP growth slowed to 0.4 and 0.6 per cent in the second and third quarters of 2010, respectively. However, these worries have abated in light of positive information regarding retail sales, discretionary consumer spending, manufacturing, productivity, and stock prices. Although a return to recession now looks unlikely, the recovery is predicted to be prolonged and arduous. Prospects for growth have been dampened by the need for American households to repair their balance sheets, with the savings rate estimated to have risen to 5.5 per cent in the third quarter of 2010. This process is likely to weigh on growth for some time, although it will eventually lead to a better balanced economy. Growth is also being frustrated by the problem of persistently high
1 International forecasts used in this Commentary are taken from the OECD Economic
Outlook No. 88,November 2010.
Main
6
unemployment, which stands at 9.4 per cent as of November, and continued uncertainty in the housing market. On the upside, both fiscal and monetary policy makers have committed themselves to expansionary policies in the near-term, which should help support economic recovery. The US economy is estimated to have grown by 2.7 per cent in 2010, and is forecast to grow by 2.2 per cent in 2011. The outlook for 2012 is more upbeat, with GDP expected to rise by 3.1 per cent, assuming that no significant steps are taken to reduce the fiscal deficit.
The UK economy is experiencing a trade-led recovery as greater demand both domestically and in markets in Europe, America and Asia has led to increased exports and investment in the economy in the latter half of 2010. Growth is estimated to have been 1.8 per cent in 2010, and is forecast to be 1.7 per cent in 2011 and 2.0 per cent in 2012. In 2010, growth is expected to be mainly as a result of increased investment as companies seek to restock following the rundown of inventories that occurred during the recession. The growth profile is expected to change in 2011 and 2012, with exports becoming the leading determinant of output growth. Domestic consumption, although robust throughout 2010, is expected to flag over the coming years due to the need for households to repair damaged balance sheets and weak projected disposable income, which will dampen the recovery in the short run. The government’s fiscal consolidation, as set out in the 2010 Spending Review, will also act as a drag on growth in the short run, with government expenditure projected to fall by 8.3 per cent in real terms by 2015. According to the Office for Budget Responsibility, this consolidation will reduce net public sector borrowing from 11 per cent in 2010 to 1.1 per cent of GDP by 2015-2016. In the short run, fiscal austerity is expected to knock off 0.5 per cent off the growth rate. Monetary policy is expected to remain accommodative in 2011 at the cost of higher inflation. The increasing price level, coupled with a sustained recovery, is expected to lead to a tightening of monetary policy in 2012.
7 Many Central Banks around the world have sought to aid domestic recoveries through relaxed monetary policies. In the US, Britain and the Euro Area effective interest rates were reduced close to zero and exceptional liquidity measures were provided to encourage economic activity. Quantitative easing, whereby Central Banks create money in order to purchase government bonds and other financial assets, was also employed by the Bank of England and the US Federal Reserve in order to depress interest rates and encourage investment. In November, the US Federal Reserve, citing the elevated unemployment rate and subdued inflation expectations, announced a continuation of this process. The stated intent is to buy $600 billion in US Treasury bonds before June 2011 in an attempt to bring down long-term interest rates in order to stimulate spending in the economy and prevent deflation. This policy carries with it some risk, especially if inflation exceeds the Federal Reserve’s expectations. There is also a worry that an expansionary fiscal policy will dampen the effect of quantitative easing by creating more debt, thereby increasing long-term yields.
In an international context, the impact of the Federal Reserve’s policy will be to weaken the dollar on exchange markets, thus making American exports more competitive. The excess liquidity created will also have a knock on effect on commodity and emerging markets. The evidence of this is already becoming apparent. These effects, coupled with ongoing exchange rate controls in China, have induced a protectionist response from Central Banks around the world. Countries seeking to maintain their relative competitiveness have intervened in currency markets in order to depreciate their exchange rates, while emerging economies such as Brazil and Indonesia are seeking to prevent overheating caused by the inflow of foreign investment by limiting capital flows. Governments that managed to avoid implementing protectionist trade policies must now be wary of the destabilising effects of using monetary policy for the same purpose. Without international cooperation, the so-called currency wars could lead to dangerous imbalances developing in 2011.
E
XPORTSThe performance of Irish exports remains strong as the recovery in the global economy continues, and this trend is set to continue on the basis of the growth forecasts for 2011 and 2012 discussed above. Crucially, future export potential depends on the fortunes of our main trading partners in America, Britain and the Euro Area. In the US consumer demand is expected to record weak growth due to the ongoing problems of high unemployment and high household debt, but early indicators for 2011 suggest a brighter outlook than was envisaged in mid 2010. In Britain, consumption remained robust throughout the recession, but with government austerity measures set to increase in 2011, the prospects for significant growth in consumption over the forecast period is unlikely. In Europe, which accounted for nearly 43 per cent of total Irish exports in the first three quarters of 2010, demand has grown strongly as the core economies begin to restock, but recovery is being hampered by continuing difficulties in the financial markets. If considerable steps are taken in 2011
8
1 1.1 1.2 1.3 1.4 1.5 1.6
0.6 0.65 0.7 0.75 0.8 0.85 0.9 0.95
04/01/2010 04/04/2010 04/07/2010 04/10/2010
GBP USD
EUR
/US
D
EUR
/G
B
P
and 2012 to address these issues, the European market could experience a better balanced and more sustainable recovery.
E
XCHANGER
ATES [image:13.595.159.518.352.603.2]Due to the ongoing sovereign debt problems facing several Euro Area economies, the euro has weakened relative to other main currencies. The average dollar exchange rate for 2011 thus far has been $1.31, which is significantly below the three year average of $1.39. The euro exchange rate versus the yen shows a similar change, whereas the euro/pound exchange rate has remained far more stable. Dollar and sterling exchange rate movements in 2010 are shown in Figure 1 below. A weaker euro has helped boost Ireland’s export performance in markets outside the Euro Area. Indeed, as the euro has been in the maw of a sovereign debt and financial crisis, it is surprising that it has remained as strong as it has relative to other major currencies. It is a testament to the seriousness of the crisis that the euro has weakened against the dollar even as the Federal Reserve has committed itself to adding $600 billion in extra liquidity by June of this year. Normally, this would lead to the dollar becoming significantly more competitive against the euro, but instead we observe the opposite.
Table 1: Short term International Outlook
GDP Output Growth Consumer Prices*
Inflation
Unemployment Rate General Government
Balance
% % % % of GDP
Country 2010 2011 2012 2010 2011 2012 2010 2011 2012 2010 2011 2012
UK 1.8 1.7 2.0 3.1 2.6 1.6 7.9 7.8 7.6 -9.6 -8.1 -6.5 Germany 3.5 2.5 2.2 1.0 1.2 1.4 6.9 6.3 6.2 -4.0 -2.9 -2.1 France 1.6 1.6 2.0 1.6 1.1 1.1 9.3 9.1 8.8 -7.4 -6.1 -4.8 Italy 1.0 1.3 1.6 1.5 1.4 1.4 8.6 8.5 8.3 -5.0 -3.9 -3.1
Euro Area 1.7 1.7 2.0 1.5 1.3 1.2 9.9 9.6 9.2 -6.3 -4.6 -3.5 USA 2.7 2.2 3.1 1.6 1.1 1.1 9.7 9.5 8.7 -10.5 -8.8 -6.8 Japan 3.7 1.7 1.3 -0.9 -0.8 -0.5 5.1 4.9 4.5 -7.7 -7.5 -7.3 China 10.5 8.5 9.0 5.9 -0.1 0.6 9.8 7.8 8.6
OECD 2.8 2.3 2.8 0.0 0.0 0.0 8.3 8.1 7.5 -7.6 -6.1 -4.7 Ireland 0.1 1 ½ 2 ¼ -1.6 1 1 13.4 13 ½ 13 -31.6 -9 ½ -7 ¾
Source: OECD Economic Outlook No. 88, November 2010.
10
I
NTERESTR
ATESInterest rates were cut to historically low levels during the course of 2009, and were maintained throughout 2010. Looking ahead to 2011 and 2012, there is likely to be some upward movement in interest rates as the European economy improves and attention turns to curbing inflation. Already in 2011, Euro Area inflation has surprised on the upside as oil and other commodities rise. These are inflationary pressures that were in place before 2008, and the global recession has provided only a momentary respite from the underlying trends that are driving these markets. Managing the twin goals of ensuring that the recovery is sustainable and yet avoiding the build-up of inflationary pressures will be a major task facing the ECB in 2011 and 2012.
11
T
HE
D
OMESTIC
E
CONOMY
T
he most recent Central Statistics Office estimates from the QuarterlyNational Accounts (QNA) for GDP and GNP suggest that the economy
grew slightly in Q3. Cumulating estimated activity over the first three quarters of the year would suggest that the dramatic collapse in the economy over the course of 2008 and 2009 has finally come to an end. We estimate that volume GDP will broadly remain unchanged in 2010, while GNP could shrink up to 1¼ per cent. While the ending of the recession is a significant positive development, it is driven entirely by the contribution of net exports to overall growth. Exports have been growing strongly throughout 2010. However, the domestic economy, and in particular private consumption, has continued to contract. Our estimate for 2010 is that private consumption in volume terms will contract by 1 per cent, and is likely to continue to fall in 2011 and 2012. This is due to, inter alia, a significant deterioration in consumer confidence in the second half of 2010, the likely impact of the 2011 budgetary package on disposable income and the anticipated further job losses, particularly concentrated in the financial and public sector.
Using the QNA Q3 figures, we have calculated the implied carryover growth rate for 2010, as shown in Table 2. This is the growth rate that would occur if economic activity were to remain unchanged from the level recorded in the third quarter of 2010. Based on pure carryover, the latest
QNA estimates suggest GDP would shrink marginally in 2010 by ½ per cent. Our estimate for 2010 GDP growth is very close to this, -¼ per cent. We expect the domestic economy to continue to shrink, counterbalanced by external demand, with exports performing strongly.
Table 2: Implied Carryover from Quarterly National Accounts Q3, Constant Price Growth Rates
CSO Estimate
Carryover Based on First Three
Quarters
QEC
Estimate
2009 2010 2010
CONSTANT PRICES
Consumption -7.0 -1.0 -1.0 Government Expenditure -4.4 -4.9 -5.0 Investment -31.0 -27.4 -24.5
Exports -4.1 9.9 8.7
Imports -9.7 6.6 4.0
12
-6% -5% -4% -3% -2% -1% 0% 1%
2008Q3 2008Q4 2009Q1 2009Q2 2009Q3 2009Q4 2010Q1 2010Q2 2010Q3
Source: Quarterly National Accounts, CSO
D
omestic consumption decreased by 0.5 per cent in the third quarter of 2010 according to the latest figures from the Quarterly National Accounts [image:17.595.172.516.179.410.2](QNA Q3 2010). Consumption was 1.3 per cent lower than Q3 2009, compared to a yearly decline of 1.1 per cent in Q2. The continuing weakness of domestic consumption is shown in Figure 2. Although the decline in consumption is not as dramatic as was seen earlier in the crisis, its ongoing contraction will weigh on future investment, employment and inflation prospects.
Figure 2: Quarter-on-Quarter Percentage Change in Volume of Consumption, Seasonally Adjusted
Table 3 presents recent trends in a range of indicators of consumption. The reduced pace of the annualised fall in retail sales is driven largely by the ongoing recovery of the motor industry, which is buoyed by the government’s scrappage scheme. The retail sales index was down by 1 per cent in value terms in November compared to November of last year, but the index excluding motor sales was down by 2 per cent.
Table 3: Recent Indicators of Consumption (Annualised Volume Growth Rates)
Retail Sales (Unadjusted) Trips Abroad
New Vehicle Sales
All Vehicle Sales All
Businesses
Excluding Motor Trade
Annualised Growth Rates
13
0 10 20 30 40 50 60 70 80 90 100
2008M11 2009M05 2009M11 2010M05 2010M11 Consumer Sentiment Index Index of Current Economic Conditions Index of Consumer Expectations
Source: Consumer Sentiment Index, KBC Ireland and ESRI
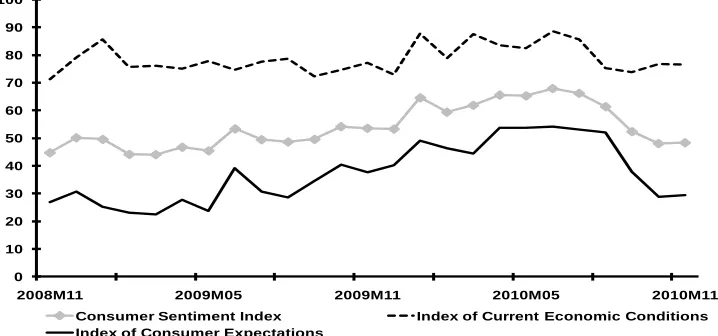
Consumer confidence has been badly shaken by the continued ill-health of the economy that necessitated intervention from the IMF and the EU, as well as a particularly difficult budget and an upward revision of the cost of the domestic banking crisis. The KBC/ESRI Consumer Sentiment Index
[image:18.595.171.530.196.364.2]has fallen from a height of 67.9 in June to 44.4 in December. The decline in confidence since mid 2010 can be seen in Figure 3 below.
Figure 3: KBC/ESRI Consumer Sentiment Index
In 2010 we estimate that consumption fell by 1 per cent, which is a downward revision of our previous estimate of a ½ per cent drop, as a result of the worsening situation observed in Q3. In light of the greater fiscal austerity measures introduced in the budget, we have also revised downward our expectations for consumption growth in 2011. We now predict that consumption growth will fall by ¾ in 2011, which will in turn have implications for investment and employment prospects. Owing to the continued programme of fiscal austerity and poor employment prospects, the forecast for 2012 is for a contraction of ½ per cent.
A
fter surprising on the upside in Q2, investment contracted significantly in Q3, according to the latest data from the Quarterly National Accounts.Investment in transport equipment (principally aircraft) was the main driver behind this decline, falling by nearly €1 billion, with investment in other machinery and equipment down nearly €300 million. This decline is unsurprising given the anaemic outlook for domestic consumption. Comparing Q3 2010 with Q3 2009, investment is down 30.9 per cent with significant reductions recorded in housing (dwellings and improvements), other building and construction, transfer costs, and machinery and equipment. Investment now represents just 14 per cent of GNP, compared to an average of 26 per cent in 2008. Figure 4 shows the deterioration in investment as proportion of GNP over the past two years.
Table 4: Gross Fixed Capital Formation
2009 % Change in 2010 2010 % Change in 2011 2011 % Change in 2012 2012
€bn Volume Value €bn Volume Value €bn Volume Value €bn
Housing 7.4 -36 ¼ -37 ¼ 4.6 -15 -15 ¼ 3.9 5 ½ 6 ¾ 4.2
Other Building 8.6 -25 -32 ½ 5.8 -10 -12 ¾ 5.1 0 -3 4.9 Transfer Costs 0.6 -40 -60 0.2 -5 -10 0.2 0 0 0.2 Building and
Construction 16.6 -30 ¾ -35 ½ 10.7 -12 -13 ¾ 9.2 2 ¼ 1 ¼ 9.3 Machinery and
Equipment 8.1 -10 -10 ½ 7.3 5 6 ¾ 7.8 5 6 ¾ 8.3
15
5% 10% 15% 20% 25% 30% 35%
2007Q1 2007Q3 2008Q1 2008Q3 2009Q1 2009Q3 2010Q1 2010Q3
Source:CSO, Quarterly National Accounts
0 20,000 40,000 60,000 80,000 100,000 120,000
2005Q3 2006Q3 2007Q3 2008Q3 2009Q3 2010Q3
Planning permissions Commencements Registrations Completions
[image:20.595.157.513.75.331.2]Source: CSO and Department of the Environment, Heritage and Local Government. Figure 4: Investment as a Share of GNP (Seasonally Adjusted)
Looking at the housing market, the contraction continued in 2010, as shown in Figure 5. On an annualised basis, planning permissions for houses and apartments stood at 20,493 in 2010 Q3, 58.5 per cent lower than in 2009 Q3. Completions are down 47.5 per cent and registrations are down 50 per cent on the same basis. We estimate that house completions reached 14,500 by the end of 2010, which is an increase on our previous estimate. Activity is expected to remain weak in 2011 and 2012, with 10,000 completions forecast for each of those years.
[image:20.595.175.503.485.691.2]16
According to the permanent tsb/ESRI House Price Index, the pace of decline has continued to ease in the third quarter of 2010, falling by just 1.3 per cent compared to the second quarter and 14.8 per cent lower than in the third quarter of 2009. The House Price Index has thus far fallen by 36 per cent from its peak in early 2007, with the fall being most acute in Dublin where the index is down 45 per cent. We expect this trend to continue in to 2011, but to then bottom out in 2012. The peak to trough fall is expected to be in the region of 50 per cent, with prices remaining essentially flat thereafter.
Investment as a whole is expected to have contracted by 24½ per cent in 2010, which is in line with our earlier forecasts. Investment in building and construction is estimated to have decreased by 30¾ per cent, whereas investment in machinery and equipment fell by 10 per cent. Investment will fall by a further 6 per cent in 2011, with the moderated pace of decline coming from an expected increase of 5 per cent in investment in machinery and equipment. Building and construction is expected to be a drag on growth in 2011 and 2012, but continuing investment in machinery and equipment is expected to lead to an increase in total investment of 3¼ per cent in 2012.
T
he Exchequer Returns for December 2010 confirmed the pattern on tax revenues which has emerged since the middle of 2010, namely that tax revenues have finally stabilised. In Figure 6 we can see the very rapid growth in the gap between tax revenues and voted expenditures between 2007 and 2009. From a position of surplus in 2007, the gap widened to over €14billion within a two year period and at the end of 2010 stood at €14.6 billion. This measure of the deficit, which excludes the effects of all once-off payments to banks, debt interest payments or transfers to the National Pension Reserve Fund, and also excludes all once-off revenue windfalls, is a useful yardstick for gauging the success of budgetary policy in relation to the fiscal crisis. On the basis of this metric, the measures adopted over the past number of years have been sufficient to stabilise the deficit.Figure 6: Exchequer Returns, Year Ended September
0 10 20 30 40 50 60
2005 2006 2007 2008 2009 2010
Bil
lio
n
s
Stamps +CGT CT VAT Income Voted expenditure Total tax revenue
Source: Department of Finance
17
Table 5: Public Finances
2009 €bn
% Change
2010 €bn
% Change
2011 €bn
% Change
2012 €bn
Current Revenue 33.9 1 ¾ 34.4 6 ½ 36.7 3.0 37.8 of which: Tax Revenue 33.0 -4 31.8 9 ¼ 34.7 5.7 36.7 Current Expenditure 45.2 4 47.0 3 48.4 -2.3 47.3 of which: Voted 40.3 ¾ 40.5 3 41.7 -4.9 39.7
Current Surplus -11.4 -12.6 -11.7 -18.7 -9.5
Capital Receipts 1.5 22 ¾ 1.8 19 2.1 -23.6 1.6 Capital Expenditure 14.7 -46 8.0 4 8.3 -4.0 7.9 of which: Voted 6.9 -14 ¼ 5.9 -27 4.3 -7.9 4.0
Capital Borrowing -13.3 -6.2 -6.1 2.8 -6.3
Exchequer Balance -24.6 -18.7 -17.9 -15.9
as % of GNP -18.8 -14 ¾ -14 -12 ¼
General Government
Balance -23.0 -50.2 -15.4 -12.8
as % of GDP -14.4 -31 ½ -9 ½ -7 ¾
Gross Debt as % of GDP 65.6 93 ½ 99 104 ½
Net Debt as % of GDP* 38.2 68 ¾ 88 ¼ 94
*Net of liquid assets in NPRF and Exchequer Balances.
However, as discussed in the previous Commentary, the stabilisation of this deficit has been overtaken by the costs of the bank bailout. With an estimated €31.4 billion additional funds included in the 2010 General Government Deficit, this has led to the measured headline deficit as a percentage of GDP of 31¾ per cent of GDP.2 This has in turn led to a
significant jump in the Irish government debt burden, with gross government debt estimated at 93½ per cent of GDP3. Excluding these
bank bailout monies, the underlying deficit is 11½ per cent of GDP.
The Budget Book 2011 lays out in some detail the budgetary adjustments to be implemented in the years 2011 to 2014. We have implemented illustrative packages based on this information for 2011 and 2012 as follows. The total package for 2011 includes a total adjustment of €6 billion, which is composed of a €1.4 billion increase in direct taxation (of which €1 billion on income tax), €1.8 billion reduction in capital spending, €2 billion reduction in current expenditure (of which €1 billion savings on transfer payments) and €660 million on once-off revenues. The total package for 2012 includes an adjustment of €3.6 billion which is composed of €1.5 billion on income taxes, €400 million reduction in capital
2 This figure is higher than in the previous Commentary which assumed a once-off bank
bailout cost of €30.7 billion, the most recent data from the Budget Book suggest this number is closer to €31.4 bn.
3 This is marginally lower than the official estimate in the Budget Book because this
18
expenditure, €1.7 billion reduction in current expenditure (of which €700 million is on transfer payments).
Over the two year period, these adjustments add an ex ante €3 billion to the burden of direct taxation with a direct negative effect on personal disposable income. This is reflected in the negative growth in personal consumption in 2011 and 2012. Together with direct cuts to current and capital expenditure, which mean we forecast volume declines in government consumption in both years and a significant scaling back in public sector investment, this means that domestic demand will continue to contract in 2011 and 2012.
Our estimates suggest that this package would be sufficient to bring the General Government Deficit to well below 10 per cent of GDP, at 9½per cent. In general for 2011 our forecasts are close to those of the Budget Book. However in 2012 our forecasts for growth and employment are lower than the official forecasts. This in turn means that our forecast for total taxation is €1.5 billion lower than the official forecasts. This is mainly driven by lower forecasts of income taxation driven by our lower employment forecasts. Offsetting this, we have a lower estimate of the debt interest bill in 2012, the official estimate is €6.9 billion, and we estimate that this could be €6 billion. 4
In relation to the forecast of gross and net debt shown in Table 5, we have assumed that Exchequer cash balances are run down in 2011 and 2012 so that by the end of 2012 net debt is forecast to be in the order of €155 billion or 94 per cent of GDP.5 More than €50 billion of this debt is
related to funding the banking system (excluding NAMA).
T
he Quarterly National Accounts for Q3 2010 indicate that, having fallen in 2008 and 2009, there has been a vigorous recovery in exports in 2010. Based on carryover alone, the QNA data suggest that exports could have grown in volume terms by up to 10 per cent in 2010. Figure 7 shows the quarterly data on volume exports and imports from the QNA. Since the end of 2007 quarterly volume exports fell steadily until the end of 2009. Since the beginning of 2010 there has been a strong recovery in exports, with the total value of exports in 2010 Q3 reaching a record high at 103 per cent of GDP.
4 In calculating our debt interest bill for 2011 and 2012, we include the cost of refinancing
rollover debt and net off the implied run down of exchequer cash balances and the NPRF as indicated in Table 6 of the Budget Book (p. D19). We assume an interest rate of 6 per cent on new borrowings and net of €1.5 billion from the final figure, reflecting the decision to introduce an interest holiday on promissory notes for 2011 and 2012.
5 The net debt is calculated by deducting liquid assets from the gross debt figures. These
include Exchequer cash balances and the National Pension Reserve Fund. However we have excluded €17.5, an estimate of the directed investments into the Irish banking system of the NPRF by the end of 2011. From this calculation from 2011 onwards. Hence the discreet increase in the net debt figure in 2011.
Table 6: Exports of Goods and Services
2009 % Change in 20010 2010 % Change in 2011 2011 % Change in 2012 2012
€bn Volume Value €bn Volume Value €bn Volume Value €bn
Merchandise 77 7 ½ 7 ½ 83 6 6 ½ 88 5 5 ½ 93
Tourism 4 - ½ -1 3 5 ¾ 8 4 6 ¾ 9 4 Other Services 63 10 ½ 10 69 6 6 74 5 5 ½ 78
Exports of Goods
and Services 144 8 ¾ 8 ½ 156 6 6 ¼ 166 5 5 ½ 175
FISIM Adjustment 1 1 1 1
20
Figure7: Quarterly Volume Exports and Imports, Constant Prices, Seasonally Adjusted
The strong pick up in exports in 2010 has been largely concentrated in exports of services, in particular computer services and business services. In value terms, growth in non-tourism services averaged 8.8 per cent in the year ended 2010 Q3, while growth in merchandise exports was just 2 per cent. In volume terms merchandise exports grew slightly faster at 2.7 per cent, reflecting the fall in the export price deflator. This matches the fall in the wholesale price index for manufacturing of 0.5 per cent in the year ended 2010 Q3.
Since 2000 the total value of merchandise exports has not changed considerably. Continued price declines have meant that the volume of merchandise trade has continued to rise. However, the mainstay of growth in exports since 2000 has been in the services sector. Services exports in 2010 are estimated to account for over 46 per cent of total exports, up from 21 per cent in 2000.
As discussed in the International section above, we expect the gradual upturn in the world economy to continue to support the demand for Irish exports over the forecast horizon. We estimate export growth of 6 per cent in 2011 and 5 per cent in 2012. While this is significantly slower than the 8.7 per cent estimated growth rate for 2010, it does underpin the positive growth forecast in 2011 and 2012. With strong growth in the industrial sector and in particular in the pharmaceuticals sector, we expect merchandise exports to grow in volume terms by 6 per cent in 2011 and 5 per cent in 2012. Tourism exports, which have fallen dramatically since 2007 (by over 30 per cent), are expected to pick up in 2011 and 2012. Non-tourism exports are expected to grow by 6 per cent in 2011 and 5 per cent in 2012. In relation to the terms of trade, we expect export prices to continue to lag the growth in import prices, with consequent terms of trade losses over the next two years.
25000 27000 29000 31000 33000 35000 37000 39000 41000 43000
2006Q1 2006Q3 2007Q1 2007Q3 2008Q1 2008Q3 2009Q1 2009Q3 2010Q1 2010Q3
Exports of Goods and Services (Excluding Factor Income Flows) Imports of Goods and Services (Excluding Factor Income Flows)
€
m
illi
o
n
21
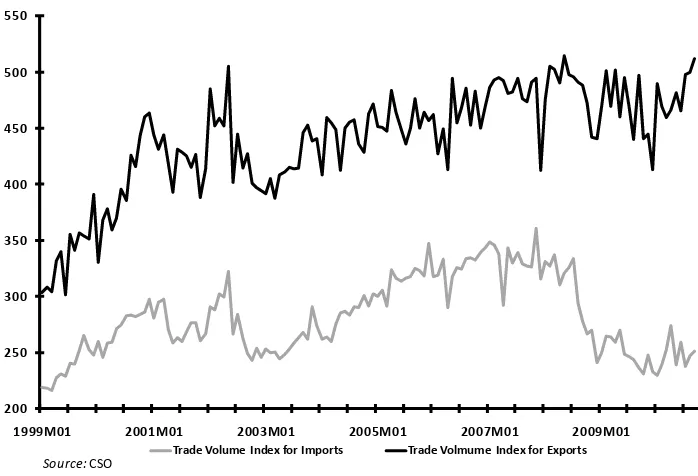
[image:26.595.172.521.181.419.2]T
he Quarterly National Accounts for Q3 2010 indicate that volume imports fell by over 15 per cent between 2007Q4 and 2009 Q4 (see Figure 7 above). In particular merchandise imports fell dramatically over that period as shown in Figure 8. During the course of 2010, the collapse in merchandise imports has ceased and we estimate growth of 3 per cent in volume merchandise imports.Figure 8: Merchandise Trade Index, Seasonally Adjusted (Base 1990=100)
By contrast, services imports have been growing strongly according to the latest data available for 2010, at a rate of 4.6 per cent in the year ended September 2010. This was largely due to growth in imports of business services and royalties. During this period tourism imports fell by 7.8 per cent, while transport imports fell by 4.1 per cent.
On the basis of these trends and our forecasts for continued falls in consumption and investment in 2011 and 2012, we expect the volume of merchandise imports to grow by 1 ½ per cent in 2011 and 2012. With regard to services imports, we expect non-tourism services imports to increase by 3 ¾ per cent in volume in 2011 and by 3¼ per cent in 2012.
200 250 300 350 400 450 500 550
1999M01 2001M01 2003M01 2005M01 2007M01 2009M01
Trade Volume Index for Imports Trade Volmume Index for Exports
Source: CSO
Table 7: Imports of Goods and Services
2009 % Change in 20010 2010 % Change in 2011 2011 % Change in 2012 2012
€bn Volume Value €bn Volume Value €bn €bn Volume Value
Merchandise 45 2 ½ 2 46 1 ½ 3 ½ 47 1 ½ 3 ½ 49
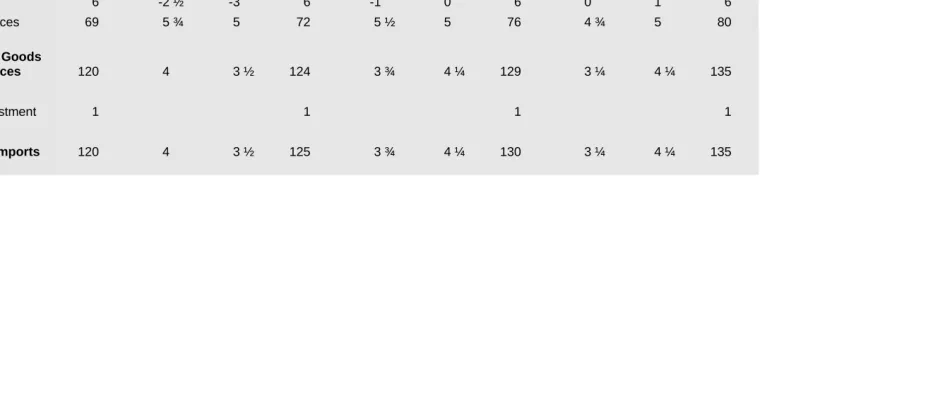
Tourism 6 -2 ½ -3 6 -1 0 6 0 1 6 Other Services 69 5 ¾ 5 72 5 ½ 5 76 4 ¾ 5 80
Imports of Goods
and Services 120 4 3 ½ 124 3 ¾ 4 ¼ 129 3 ¼ 4 ¼ 135
FISIM Adjustment 1 1 1 1
23
O
ur forecasts for merchandise exports and imports imply an expansion of the merchandise trade surplus in 2011and 2012. The merchandise surplus is expected to increase by €7 billion between 2010 and 2012. The services trade deficit is estimated to have narrowed significantly in 2010 as a result of strong growth in services exports. In 2011 and 2012, we expect the services trade deficit to stabilise at around -€4 billion.. On the basis of our projections, in particular the expected increase in the merchandise trade surplus, we expect a significant expansion in the overall trade balance to over 30 per cent of GNP by 2012. [image:28.595.174.519.334.575.2]Regarding net factor flows, the latest Balance of Payments data indicate a steady increase in net investment income outflows since the beginning of 2009. We expect the net factor income deficit to increase by 9¼ per cent in 2010 and by a further 7½ per cent in 2010. However, overall the expansion in the merchandise trade surplus should contribute to a rapid narrowing of the current account deficit which we expect to be broadly in balance in 2010 before moving into a surplus of 2¼ per cent of GNP by 2012.
Figure 9: Annualised Net Factor Flows, Balance of Payments
‐32000
‐30000
‐28000
‐26000
‐24000
‐22000
‐20000
2003Q1 2004Q1 2005Q1 2006Q1 2007Q1 2008Q1 2009Q1 2010Q1
Source:CSO, Balance of International Payments
24
Table 8: Balance of Payments*
2009 Change 2010 Change 2011 Change 2012
€bn % €bn % €bn % €bn
Merchandise Trade Balance 32.4 37.3 41.0 44.2 Service Trade Balance -8.4 -5.4 -4.6 -4.0
Trade Balance in Goods and
Services on BoP basis 24.0 31.9 36.5 40.2
% of GNP 18.3 24 ¾ 28 ½ 31 ¼
Total Debit Flows 82.4 -3 ¾ 79.2 ½ 79.7 2 81.2 Total Credit Flows 54.5 -10 49.0 -5 46.6 -2 45.6
Net Factor Flows -27.9 8 ½ -30.3 9 ¼ -33.1 7 ½ -35.6
Net Current Transfers -0.9 -1.7 -1.7 -1.7
Balance on Current Account -4.9 -0.1 1.7 2.9
Capital Transfers -1.3 0.1 0.1 0.1
Effective Current Balance -6.1 0.0 1.8 3.0
% of GNP -4.7 -0 1 ½ 2 ¼
*This table includes adjustments to Balance of Payments basis.
T
able 9 includes a range of indicators of economic performance for recent years and for the forecast period. The first line shows the familiar GNP value, which we forecast will increase by ¼ per cent in 2011 and 1½ per cent in 2012. In terms of income per head, were this forecast to prove correct, this would mean that income per head at the end of 2012 would be at levels last seen in 2002.
Finally, the last line in the table can be viewed as an indicator of competitiveness. While it is not the case that there is some target level for labour’s share of output, the increase in the value of the variable into 2009 points to declining competitiveness. If our forecasts are correct, there will be a significant improvement in competitiveness and this is reflected in the fall in labour’s share out to 2012.
Table 9: Performance Indicators
Performance Indicators 2005 2006 2007 2008 2009 2010 2011 2012
GNP, in constant prices 6.0 6.5 4.5 -3.5 -10.7 -1 ¼ ¼ 1 ½ GNP adj for Terms of Trade 5.2 5.5 3.1 -5.9 -9.8 -1 0 1 ¼ GNDI, constant prices 5.1 4.9 2.8 -6.0 -9.7 -1 ½ 0 1 ¼ GNP per capita (constant prices) 3.7 4.0 1.9 -5.3 -11.4 1 ½ ½ 1 ½ Consumption per capita (constant
prices) 4.6 4.2 3.8 -3.3 -7.8 -1 ¼ - ½ - ¾ Investment in Housing/GNP 14.9 14.7 13.2 9.8 5.6 3 ½ 3 3 ¼ Investment/GNP 31.4 31.2 30.8 25.7 18.8 14 13 ¼ 13 ¾ Domestic Demand 9.0 6.4 5.5 -5.2 -13.9 -5 -2 0 Labour share of GNP 47.5 46.8 48.0 51.3 55.4 53 51 ¾ 51 ¼
Measures of
25
A
ccording to the Quarterly National Accounts for Q3 2010, industrial output grew by 1.4 per cent between Q2 and Q3 (seasonally adjusted). However, as can be seen from Figure 10, there continues to be marked differences within this sector across construction and non-construction industrial activity. Non-building industry grew by almost 3 per cent, thereby reversing the contraction which had been observed between Q1 and Q2. Comparing the year ending Q3 2010 to the year ending Q3 2009, output has increased by over 10 per cent, thereby echoing the strong performance of exports as discussed above. The on-going contraction in construction activity is also seen in Figure 10, with the latest quarterly fall measured at -8.2 per cent. Again comparing the year ending in Q3 2009 and 2010, construction output is down by almost one third.Figure 10: Quarter-on-Quarter Growth Rates in Industry, Seasonally Adjusted
With eleven months of data for 2010 now available from the CSO’s
Index of Industrial Production, it is possible to get a clear sense of what output figures for the full year will be. In Figure 11, we show output growth figures for the traditional and modern sectors for the twelve month period from November to November. As can be seen, the modern sector has seen output grow by 8.8 per cent in the twelve months to November 2010. Growth in the traditional sector, at just 0.4 per cent in the corresponding period, is a good deal lower. However, the most recent signs are more encouraging. Comparing the six month period June-November 2010 with the corresponding period in 2009, output in the traditional sector has increased by 10.7 per cent.
‐25%
‐20%
‐15%
‐10%
‐5% 0% 5% 10% 15% 20%
2008Q1 2008Q2 2008Q3 2008Q4 2009Q1 2009Q2 2009Q3 2009Q4 2010Q1 2010Q2 2010Q3 Industy (non‐building) Building and Construction
Source:CSO, Quarterly National Accounts
26
‐2.0%
‐1.5%
‐1.0%
‐0.5% 0.0% 0.5%
2007Q4 2008Q1 2008Q2 2008Q3 2008Q4 2009Q1 2009Q2 2009Q3 2009Q4 2010Q1 2010Q2 2010Q3
Source:CSO, Quarterly National Accounts
Figure 11: Rates of Growth in Industrial Output 2006 to 2010, Based on November to November Comparisons
[image:31.595.161.514.108.330.2]The services sector continued to shrink in Q3, according to the Quarterly National Accounts. As shown in Figure 12, services output fell by 1.7 per cent between Q2 and Q3 based on seasonally adjusted data. This rate of decline equalled the previous poorest quarters since the start of 2008. All three sub-sectors registered declines in output in Q3. For Distribution, Transport and Communication the decline was 2.4 per cent; the declines for Public Administration and Defence and Other Services (including Rent) were 0.1 per cent and 1.6 per cent respectively.
Figure 12: Quarter-on-Quarter Growth Rates in Services, Seasonally Adjusted
As regards our forecasts, we expect services output to grow by ½ per cent in 2011 and by 1 per cent 2012. We expect non-building industrial output to grow by 5 per cent in 2011 and 2012. We expect building and
‐20%
‐15%
‐10%
‐5% 0% 5% 10%
2006 2007 2008 2009 2010
Modern Traditional sector
27 construction output to fall by 12¼ per cent in 2011 and by a further 2¼ per cent in 2012. We expect agricultural output to rise by 2 per cent in 2011 and by 1 per cent in 2012.
Box 1: Irish Agriculture in 2010
While overall GDP contracted by 7.6 per cent in 2009, the decline in agricultural output and incomes far exceeded the declines recorded in most other sectors of the Irish economy. Income in agriculture fell by almost a third in 2009, the largest annual decline in the operating surplus based on records dating back to 1973. Preliminary estimates from the CSO6 indicate
that the agriculture sector is likely to have outperformed most other sectors of the Irish economy in 2010 with large increases in the value and volume of agricultural output recorded over the course of the year. The latest data indicate that the operating surplus increased by 46 per cent in 2010, making good the losses incurred in 2009.
The fall in agricultural income in 2009 was driven by sharp falls in the value of agricultural output, especially milk and cereals, with poor weather and flooding also likely to have contributed to the reduction in output. A reversal of this trend was seen in 2010 with output at farm gate prices increasing by over 16 per cent in value and 6 per cent in volume (Table 1A). Expenditure on inputs remained broadly unchanged in 2010 (the value of intermediate consumption increased by 0.3 per cent) while the deduction for depreciation fell by 4.5 per cent from 2008. Combined with the increase in output, this contributed to the dramatic increase in the overall operating surplus in 2010.
[image:32.595.166.527.478.698.2]The structure of the agricultural sector is illustrated in Figure 1A which shows the share of gross output accounted for by the main commodities. In 2009, cattle and milk output accounted for almost 60 per cent of total gross output with cereals accounting for around 4 per cent of output.
Figure 1A: Structure of Agriculture Sector: Main Commodities
6 Central Statistics Office, 2010. Output, Input and Income in Agriculture 2010- Preliminary
Estimates.
0% 10% 20% 30% 40% 50% 60% 70% 80% 90% 100%
1990 1995 2000 2005 2010
Cattle Pigs Sheep Milk Cereals Crops Other
28
The main commodity outputs from Irish farms experienced substantial price falls in 2009 as shown in Table 1A. The downturn in the international economy impacted on global food demand and contributed to the decrease in commodity prices observed over the course of 2009. The value of milk output declined by almost 33 per cent, due almost entirely to a decrease in milk prices. Cereals output declined by over 50 per cent in value and 30 per cent in volume. There was also an 11 per cent decline in the value of livestock output in 2009, again primarily driven by price falls. The price of agricultural commodities recovered strongly in 2010 aided by the upturn in the world economy, renewed demand from emerging Asia and tighter supplies. Driven by these positive price developments, the value of milk output increased by almost 39 per cent in 2010 while the value of livestock and cereals output increased by 9 per cent and 89 per cent respectively.
[image:33.595.67.520.387.767.2]Net value added at basic prices measures the prices farmers receive for their output, net of product specific subsidies and taxes. In 2009, this declined by 77 per cent to just €195.5 million. The increase in agricultural output in 2010 resulted in a strong recovery in net value added at basic prices which increased almost seven fold to €930 million in 2010. In addition, farmers receive direct payments which in 2010 amounted to €1.8 billion. Thus, the operating surplus in agriculture increased from €1.6 billion in 2009 to €2.3 billion in 2009, an increase of 46 per cent.
Table 1A: Output, Input and Income in Agriculture
2009 2010 Value Volume Price
Euro Million Annual % Change
All Livestock 2,197.8 2,400.5 9.2 8.0 1.1
Livestock - Cattle 1,450.2 1,627.8 12.2 12.8 -0.5
Livestock - Pigs 306.7 330.7 7.8 7.4 0.4
Livestock - Sheep 157.5 169.6 7.7 -7.5 16.4
All Livestock Products 1,142 1,571.2 37.6 7.1 28.5
Livestock Products - Milk 1,100.2 1,526.8 38.8 7.2 29.5
All Crops 1,371.7 1,507.2 9.9 1.6 8.1
All Cereals 107 202 88.8 7.6 75.5
Crops - Forage Plants 851.7 857.7 0.7 -1.5 2.2
Goods Output at Producer Prices 4,711.6 5,478.9 16.3 6.2 9.5
Contract Work 268.7 268.7 0.0 0.0 0.0
Subsidies less Taxes on Products 15.1 10.1
Agricultural Output at Basic Prices 4,995.4 5,757.7
Intermediate Consumption 4,070.8 4,083.1
Gross Value Added at Basic Prices 924.6 1,674.6
Fixed Capital Consumption 780.6 745.6
Net Value Added at Basic Prices 144 929.1
Other Subsidies Less Taxes on
Production 1,843.8 1,773.4
Factor Income 1,987.8 2,702.4
Compensation of Employees 427.7 424.5
29 To derive a measure of farm income at basic prices, it is necessary to deduct from net value added at basic prices expenditure by farmers on hired labour, interest payments on borrowed capital and land rental. In 2010, these totalled €424.5 million, €271.8 million and €148.9 million respectively. This implies that in 2010, farm income at basic prices was just €84 million. The equivalent figure for 2009 was minus €713 million. The return to farm enterprises continues to depend almost entirely on direct payments paid for by the EU under the CAP and by the Exchequer.7 This
highlights the dependence of farm enterprises on direct payments, a situation which leaves the agricultural sector highly vulnerable to future reforms of the CAP and to changes in the EU budget.
Nevertheless the prospects for the dairy sector, which has been gradually increasing its share of overall output over time, remains bright. Ireland’s grass-based production model gives it a comparative advantage in this area. The sector should be well placed to take advantage of the expected strong demand for dairy products as a result of income growth, urbanisation and favourable demographic trends.8 The planned abolition of
EU milk quotas in 2015 also presents opportunities for expansion in the dairy sector.9
A
ccording to the Quarterly National Household Survey for Q3 2010, there were 1.85 million people employed in that quarter. This represented a fall of 3.7 per cent on the total employed in the corresponding quarter of 2009. While this implies that the economy is still suffering significant job losses, this was the slowest pace of employment fall since Q3 of 2008 (as can be seen from Figure 13). The number unemployed stood at 299,000 in Q3, an increase of 6.9 per cent on a year earlier. This meant that the unemployment rate was 13.9 per cent in Q3 2010, and 13.6 per cent on a seasonally adjusted basis. By comparison, the average rate of unemployment across the Euro Area is 9.8 per cent (Q2). Within that group of countries, only Spain and Estonia have higher rates of unemployment, at 20.1 per cent and 18.6 per cent respectively.
7 In addition, payment of capital grants under the Farm Waste Management Scheme is
expected to exceed €900 million. Payments to farmers under this scheme are being made on a phased basis over the period to 2011.
8 See the FAPRI 2010 World Agricultural Outlook http://www.fapri.iastate.edu/outlook/2010/ 9 The Food Harvest 2020 report published in mid 2010 sets out a strategy for the medium-
term development of the agri-food sector in Ireland. See http://www.agriculture.gov.ie/media/migration/agri-foodindustry/foodharvest2020/
Table 10: GDP by Sector
2009 % Change 2010 % Change 2011 % Change 2012
€bn Volume Value €bn Volume Value €bn Volume Value €bn
Agriculture 3.0 5 10 3.3 2 5 3.4 1 2 3.5
Industry: 45.6 ¼ -1 ¼ 45.0 2 ¾ 2 ¼ 46.1 4 ¾ 4 ¼ 48.0
Other Industry 37.5 7 6 39.7 5 4 ½ 41.5 5 4 ½ 43.4 Building & Construction 8.1 -30 ¼ -34 ¾ 5.3 -12 ¼ -14 4.5 2 ¼ 1 ¼ 4.6
Services: 96.1 ¼ 0 96.1 ½ ¾ 96.8 1 1 ½ 98.4
Public Administration &
Defence 6.4 -3 -3 ¾ 6.1 -3 -4 5.9 -2 ½ -4 5.6 Distribution, Transport
and Communications 21.8 -2 -4 20.9 ½ ½ 21.0 ½ ½ 21.1 Other Services
(including rent) 67.9 1 1 ¾ 69.1 1 1 ¼ 69.9 1 ½ 2 ½ 71.6
31
‐10 ‐8 ‐6 ‐4 ‐2 0 2 4
2008Q1 2008Q2 2008Q3 2008Q4 2009Q1 2009Q2 2009Q3 2009Q4 2010Q1 2010Q2 2010Q3
%
[image:36.595.154.516.115.339.2]Source: CSO, Quarterly National Household Survey
Figure 13: Year-on-Year Percentage Change in Employment, Q1 2008 to Q3 2010
The Live Register provides the most up-to-date indicator of trends in unemployment and had exhibited some positive signs in the latter part of last year. The number on the Live Register peaked in August at 455,000 (seasonally adjusted). Falls in September, October and November saw this number fall to 438,000 in November. However, an increase was seen again in December, with the number rising to 444,000.
32
Table 11: Employment and Unemployment
Annual Averages 000s
2009 2010 2011 2012
Agriculture 96 86 89 90 Industry 411 360 345 345 Services 1,422 1,405 1,392 1,396 Total at Work 1,929 1,851 1,826 1,831 Unemployed 259 287 287 273
Labour Force 2,187 2,138 2,113 2,104 Unemployment Rate % 11.8 13 ½ 13 ½ 13 Net Migration -7.8 -34.5 -60.0 -40.0 of which: Inward Migration 57.3 30.8 15.0 20.0 Change in Participation Rate* -1.2 -1 ¼ ½
Note: Participation rate measured as share of population aged 15-64 years; Both
participation rate and the migration figures are based on Q2 figures in each year.
Turning to our forecasts, we expect employment to average 1.83 million in 2011, down 25,000 on the 2010 figure (or minus 1¼ per cent). Although the economy is expected to grow in 2011, the output growth will be achieved through productivity growth alone. For 2012, we expect employment to rise although the pace of increase, at just ¼ per cent, is expected to be miniscule. As with 2011, productivity growth will dominate. For both 2011 and 2012, the expected absence of any significant employment growth is related in part to the fact that growth is expected to come via the export sector. This is less employment intensive than the domestic sectors of the economy. We expect the rate of unemployment to average 13 ½ per cent in 2011 and for it to fall to 13 per cent in 2012. But as noted in the preceding paragraph, a part of this fall in the rate of unemployment in 2012, and indeed the stability in the rate between 2010 and 2011, is explained by our view on emigration. We expect net outward migration to be 60,000 in the year to April 2011 and 40,000 in the subsequent twelve months.