From clusters to queries: exploiting uncertainty in the
modularity landscape of complex networks
James P Gilbert
Synthetic Biology Research Centre University of Nottingham Nottingham, United Kingdom NG7 2RD
Jamie Twycross
School of Computer Science University of Nottingham Nottingham, United Kingdom NG8 1BB
ABSTRACT
Uncovering latent community structure in complex networks is a field that has received an enormous amount of attention. Unfor-tunately, whilst potentially very powerful, unsupervised methods for uncovering labels based on topology alone has been shown to suffer from several difficulties. For example, the search space for many module extraction approaches, such as the modularity maximisation algorithm, appears to be extremely glassy, with many high valued solutions that lack any real similarity to one another. However, in this paper we argue that this is not a flaw with the modularity maximisation algorithm but, rather, information that can be used to aid the context specific classification of functional re-lationships between vertices. Formally, we present an approach for generating a high value modularity consensus space for a network, based on the ensemble space of locally optimal modular partitions. We then use this approach to uncover latent relationships, given small query sets. The methods developed in this paper are applied to biological and social datasets with ground-truth label data, using a small number of examples used as seed sets to uncover relation-ships. When tested on both real and synthetic datasets our method is shown to achieve high levels of classification accuracy in a con-text specific manner, with results comparable to random walk with restart methods.
1
INTRODUCTION
A fundamental issue at the heart of machine learning methods ap-plied to large scale datasets is the ability to correctly identify classes of related objects in an unsupervised manner. In network science,
this methodology is often referred to ascommunitydetection [13].
Many algorithms exist to solve this problem [13], yet initial start-ing conditions or different optimisation strategies may result in conflicting results even when the same objective function is being maximised [17]. In this paper, we develop an intuitive method to use the uncertainty amongst a high number of near optimal solu-tions to measure context sensitive relasolu-tionships between small sets of labelled vertices. This approach can be based on labels that are not first order neighbours to find other potentially related vertices. The use of community detection is widespread. For example, a core goal in systems biology is to characterise the function and functional relationships between genes, proteins or metabolites within a larger network [15]. In many situations, only the role of a small number of genes is known, with much of the annotation for a given organism being computed through naive homology infor-mation that ignores the role of a gene within a wider context. The advent of high throughput experimental datasets has allowed the
construction of proteome scale networks, leading to the observation of non-trivial topological properties such as densely connected clus-ters [11]. These densely connected clusclus-ters are widely believed to be associated with specific function, such as multi-protein complexes or biochemical pathways.
As a form of unsupervised machine learning, module extraction methods largely focus on optimising some objective function with the goal of finding meaningful clusterings. Perhaps the most popu-lar of these methods is that of modupopu-larity maximisation [29], which seeks to find the most unexpected partition of a graph with respect to a given null model. Overlapping methods have recently been
applied to this problem in bothcrisp[1, 24] andfuzzy[19] based
algorithms which have been widely used to uncover latent rela-tionships without labelling schemes. In previous work, we found that most of these methods have significant disagreement when evaluated in a practical context [14].
The number and size of communities is, generally, not known a priori, and the problem has been shown to be NP-hard [4]. The
work of Good et al. [17] recently highlighted that the popular
modularity maximisation algorithm has a highly “glassy” search space. In essence, for real, heterogeneous networks there are many locally optimal partitions that bear little resemblance to each other by measure of mutual information. This allows greedy optimisation algorithms [3] to trivially find solutions that score extremely high values of modularity. In order to solve this issue, certain approaches use a consensus based approach to clustering, combining many high value partitions into a given median partition [22].
However, in this paper, we do not seek to find a single “best” partition, whether overlapping or not and our objective is not to uncover labels but to use limited and small sets of labels to give the notion of a membership score to some grouping. Instead, we use the large number of highly modular solutions to form the in-dex for a search query system. In essence, this is a method of semi-supervised learning that attempts to find items related given labelled sets of vertices using topology alone. Each high value parti-tion can be treated as informaparti-tion about the relaparti-tionships between vertices. That is to say, there is not a single, correct view of the underlying community structure to a network, but rather, many different context dependent definitions. As the objective of commu-nity detection approaches is to relate information, it is assumed that some labelled meta-data can be used to find unlabelled, potentially related vertices.
More formally, the problem tackled in this paper can be for-mulated as follows: Given a graph made up of vertices and edges
G=(V,E), and a query setS⊂V, we ask the question;How well is
Figure 1: Modularity search space of anE. colimetabolic net-work. Distance between partitions is calculated using vari-ation of informvari-ation [27] and dimensionality reduction is performed using curvilinear component analysis [10]. The inset (top) demonstrates the landscape of the high modular-ity partitions. Figure generated with the software of Goodet al.[17].
We propose an algorithm that pre-computes an index of cluster-ings for a given complex network, based on the fast greedy Louvain algorithm [3], used in a distributed manner. The detected clus-ters then form the basis of a search algorithm that allows one to compute the relatedness of nodes to a given query set. The query-ing method is a polynomial time algorithm that could be trivially adapted to form the basis of many user facing applications. This approach is then applied to synthetic benchmark networks with known, ground-truth labels as well as social and protein-protein interaction networks with high quality ground truth label sets.
2
EXPLOITING THE MODULARITY QUERY
SPACE
To characterise latent community structure, one of the most popular approaches is to use modularity maximisation given by the equation [29]
Q= 1
2m
Õ
i,j
Ai j−
kikj
2m
δ(ci,cj), (1)
wheremis the number of edges in the network,Ai jis the binary
variable indicating the adjacency of nodesiandj,kiis the degree of
a vertex,ciindicates the community of a given vertex andδ(ci,cj)is
the Kronecker delta such thatδ(ci,cj)=1 ifci =cjand 0 otherwise.
As a combinatorial optimisation problem, there are many different
algorithmic approaches to finding high values ofQ.
The work by [17] forms the basis of the motivation of the ap-proach taken here. In this study, the authors discovered that the modularity search space for many real-world networks contains a huge number of high value solutions. Each of these solution
Many representations of modular structure
[image:2.612.322.552.84.295.2]Select Query Nodes Create global relatedness ranking
Figure 2: Outline of the proposed approach to querying net-works by using multiple, high quality representations of modular networks.
partitions are extremely close to the global maxima, making it both
difficult to find the optimal value ofQand difficult to argue that the
highest scoring partition is the “true” community structure. This fact is visually demonstrated with the software from [17] in Figure
1, which shows the modularity search space of anE. colimetabolic
network reconstruction [20]. The similarity between the partitions is compared with the variation of information measure [27] and dimensionality of the space is reduced with curvilinear component
analysis [10]1.
In this work, we consider each high value partition to be informa-tion about latent relainforma-tionships between vertices inferred through the topology of the network. This approach, in and of itself is not unique, as there have been previous approaches that use the con-sensus of an ensemble of clusters to create high quality overlapping clustering of networks [22]. Such an approach, whilst well prin-cipled, is a context insensitive view of the modular structure of a graph.
The objective, then, is to use the disagreement between the set of highly modular partitions as information; that is to say, to infer the probability that sets of vertices are contained within the same cluster. Whilst methods based on simulated annealing can be used to guarantee full coverage of the network, the following section describes a method adapted from the greedy agglomerative Louvain algorithm [3].
2.1
Algorithm outline
A broad outline of the proposed method is presented in Figure 2. In essence, the objective is to use multiple modular representations
1The reader should note that axis on these plots are a result of the dimensionality
reduction performed by curvilinear component analysis [10] and, therefore, have no natural interpretation.
of a given dataset to generate a relatedness score for a given set of query vertices.
In order to cover the space of high modularity partitions, ran-domly generated starting partitions are computed with a random cut set. To achieve this, each edge is either placed inside the cut set or not as the result of an independent Bernoulli trial. Each random partition is used as the starting partition for the greedy Louvain process. In principle, any search exploration procedure, such as simulated annealing [17] could be used. The Louvain algorithm
was selected as it is fast, running inO(nlogn)time complexity [3],
and because it is a greedy algorithm and is guaranteed to stop after finding a locally maximal solution.
The Louvain algorithm is conceptually very simple; starting from a random partition, clusters are agglomerated if the merge results
in a positive change in modularity∆Q. When no possible moves
result in an increase in modularity the algorithm has found a local optima.
The indexcoverageis directly proportional to the number of
starting random partitions. A full coverage index could be consid-ered as every locally optimal partition. Given that there is no free lunch and it is impossible to know every solution, one can only ensure a full coverage index through an exhaustive search over the
2mpossible starting cut sets, where m is the number of edges in
the graph. Consequently, the approach taken here is to use a large but not exhaustive subset of the possible solutions using a suitably large space of 2000 solutions for the networks studied in this paper
2.
2.2
Measuring the quality of relationships
Given a query of vertices, the relatedness to other vertices in a network is quantifiable by the fraction of times they are clustered with the query set, given the set of high quality partitions. Formally,
this can be expressed in terms of theexpansion scoreof a given
vertex,
µi(S)= 1
|P ||S|
Õ
P∈ P
Õ
j∈S
δ(cpi,cpj), (2)
whereSdenotes a query set,Pis a given partition in the space of
all high quality partitionsP,cipindicates the cluster vertexiis
con-tained in within partitionPandδ(u,v)is the Dirac delta function
that equals 1 ifcpi andcpj are the same cluster and 0 otherwise. As
a simple example, for a pair of verticesiandSsuch thatS={j}we
would considerµito be the number of timesiandjappear in the
same cluster, given an ensemble of network clusterings. We define
µi(S)for all vertices in the network, including those inS. However,
for the case whereiis inSwe, instead, consider the valueµi(S−i)
to remove bias.
3
RESULTS
3.1
Cross-validation method
In this study we test a small number of labels that we intend to use in order to evaluate how well our method correctly generalises to discover unlabelled vertices. We would like to test a significantly
2Initial results indicate that a significantly smaller space of partitions may still yield
high quality results but we note that further work is required to asses the best number of partitions in a practical context.
smaller number of seed nodes than two class classification methods used in previous studies, which use leave-one-out cross validation [21]. The cross validation procedure we devise is described as follows and depends on the size of the community and the number of initial seed labels being used.
For this work we would like to capture binary classification
performance,true positives (tp),true negatives (tn), false positives (fp)
andfalse negatives (fn), on our datasets of community memberships. In order to generate the different sets for the cross validation we take each label set and generate unique sample sets of vertices from the known true positive labels.
As the seed label sets can be as small as 3 vertices, exhaustive cross validation was not possible for all labelling schemes. Conse-quently, cross validation is either conducted on an exhaustive set
of all possible |Ss|
unique labellings or 120 seed queries sampled
randomly without replacement from the possible subsets3, where
Sis the set of gold standard true labels andsis the size of the
randomly selected seed sets.
As the selected seed sets can be contained within multiple com-munities, we consider the set of true positives not to be the commu-nity for which the seed set is randomly selected, but all communities for which that seed set is a subset of. This is because the purpose of the approach presented within this paper is to distinguish between different communities in a context specific manner, if the overlap between two communities is represented by the seed nodes this should be considered in the tests.
It should therefore be noted that presented receiver operator characteristic (ROC) scores are dependent on community sizes. We also note that we do not consider separate training and test sets in this study as the method does not use any examples when building the index space from partitions of the graph.
Formally, the steps for this procedure with a given label setS
are outlined as follows:
• Generate up to 120 unique subsets of sizes, randomly
sampled without replacement (setT).
• For each test subset{∀St∈T|St ⊂S∧ |St|=s}, generate
theµi(St)score for all vertices in the network
• Exclude vertices inStfrom the test
• Consider the true community membership ofStto be the
true positive set.
• Consider each of the nodes inV not in the community
membership ofStto be the true negative set.
• Generate a network wide average ROC curve interpolated
from all test subsets from all communities.
In the case for the synthetic networks tested below, true labels are drawn from the known communities, with each tested in isolation. For the real world networks tested the labels are considered in the same manner though many nodes have no assigned labels. Every community is considered with different seed set sizes.
3.2
Random walk with restart
In the following sections compare our method with the commonly used random walk with restart method as described in [21]. This
simulates an infinite random walk with a fixed probability,αthat a
3This is equivalent to 10
3
combinations, given time constraints, an exhaustive sample would not be possible for the larger communities in this study.
walker would teleport back to the initial seed nodes. Formally, the random walk with restart algorithm uses the form
®
pt+1=(1−α)Wp®t+αp®0, (3)
whereWis the row normalised adjacency matrix of a graph,p®0is
the initial walk vector such thatp®0= |S1| for vertices in the seed
set. The random walk algorithm repeats equation 3 fromp®0until
the L1 norm betweenp®t andp®t+1converges to 0, simulating the
steady state vectorp®∞. For the tests performed in this work we use
a restart probabilityα =0.25.
3.3
Synthetic networks
In this section we test the method on benchmark networks con-structed with a ground-truth community structure. To evaluate how our method performs we use the undirected, unweighted LFR benchmark [23] in overlapping and non-overlapping forms. We test the area under the ROC curve (AUC) scores for networks varying the mixing parameter (fraction of edges between communities) and the fraction of overlapping nodes. In these tests, the community
distribution is defined with a power law coefficient of−1.0, the
degree distribution is defined with a power law coefficient of−2.0.
The number of nodes is stated in the text.
3.3.1 Non-overlapping modules.Figure 3 represents tests on 10
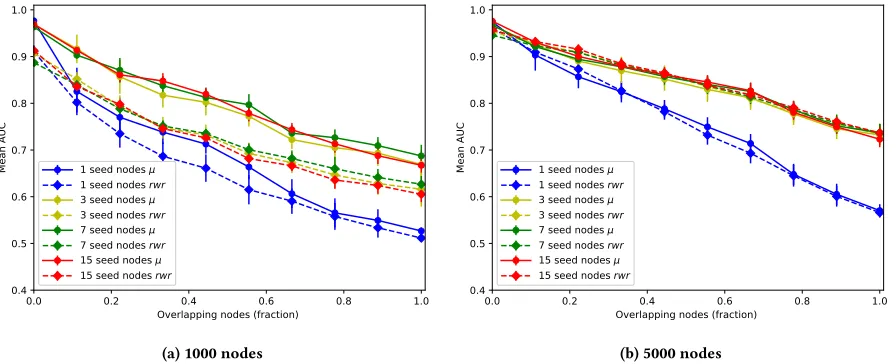
networks with 1000 and 5000 nodes varying the mixing coefficient (number of edges between communities). As one would expect, the prediction of the method drops off steeply where communities are less defined above a mixing coefficient of 0.6. Using larger seed sets also improves accuracy with some prediction of true communities being possible at extremely high levels of mixing. Overall, results are comparable to the random walk with restart method, with slightly improved performance with a smaller number of seed nodes.
3.3.2 Overlapping modules.In Figure 4 we show the results of
network performance when tested against an increasing level of overlapping communities. For these tests we fix the mixing
coeffi-cient at 0.3. Here, each vertex can belong to up to 4 communities.
In order to test performance we varied the fraction of nodes that are in more than one community. The method still has an AUC score above 0.5 when all nodes are placed in multiple communities. This indicates that the method is capable of uncovering latent over-lapping memberships even when given a relatively small number of seed nodes. As with the non-overlapping results, the scores are comparable with the rwr method with performance slightly improved in the case of 1000 node models, but comparable for 5000 node models.
3.4
Real networks
In order to test the performance of the semi-supervised classifica-tion on real-world data we present our findings on example net-works with metadata communities. All datasets use the largest single connected component sub-graph. The real networks used are:
• EU emails core dataset (EU emails) [25]This anonymised dataset is taken from the SNAP database [26] and contains
986 nodes and 16,687 edges representing emails between
individuals. The metadata community labels represent dif-ferent departments within the organisation. In total there are 42 communities, 39 of which contain at least 3 nodes.
• Yeast protein-protein interaction network (Yeast PPI)
[35] This dataset is a collection of recorded binary inter-actions between proteins collected with high-throughput yeast-2-hybrid assays. The metadata used are known, ex-perimentally validated protein complexes from [31]. The network contains 6222 nodes in the largest connected com-ponent, with 22,386 edges. There are 409 experimentally validated protein complexes, 236 of which contain 3 or more nodes. The protein complexes are typically very small in terms of number of proteins, with 90% of the complexes containing less than 10 proteins and only 2 complexes containing 50 or more proteins.
• Escherichia coliprotein-protein interaction network (E.coli PPI) [34]For theE. colidataset we used manually curated interacting proteins from [34]. The network con-tains 1913 nodes and 7252 edges, the protein complexes range in size between 3 and 65 nodes. 85% of the complexes contain 10 or less nodes.
• Arabidopsis thalianaprotein-protein interaction net-work (Arabidopsis PPI)[11]. The network itself contains 4519 nodes and 11,096 edges. For the Arabidopsis dataset, the complex sources were more limited. Consequently, we obtained all gene ontology annotations under the GO term“Protein-containing complex”from AmiGO [6] where experimentally collected physical interaction evidence was acquired. At the time of writing, this resulted in 7 com-plexes containing between 4 and 12 nodes. In addition, we included small protein complexes from the IntAct database [30], resulting in a total of 165 unique complexes. As the labels for this dataset are small it was not possible to test algorithm performance with 15 seed nodes.
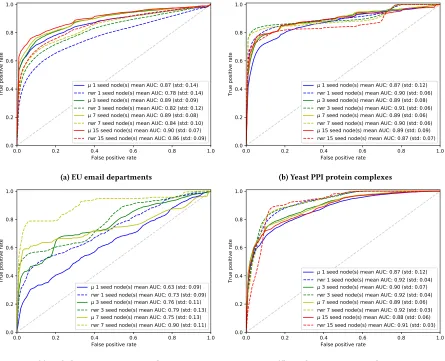
ROC curves generated with the cross validation procedure de-scribed in Section 3.1 are shown in Figure 5. These results represent ROC curves and mean AUC statistics.
The results of our method are comparable to the random walk with restart approach, which performs better on the datasets tested with the exception of the EU email dataset for which our model produces higher AUC scores.
In the case of theArabidopsis thaliananetwork the protein
com-plexes tested are significantly smaller than for other networks and so a comparison of seed sizes is not possible. However, in the other networks studied, using 3 or more seed nodes appears to improve results, though for 15 seed nodes the results are not significantly better than with 7 seeds. The lower quality labels within the Ara-bidopsis protein complex dataset likely explains the significant difference in results when compared with other protein interaction datasets.
3.4.1 Tests on gene ontology labels. In a practical situation the
higher quality label sets described above are not likely to be avail-able. Consequently, we wish to highlight that the method also serves as a useful network reduction tool where the quality of la-bels is not well defined. In order to achieve this goal, for each of the biological data sets in this study, we acquired all Gene Ontology
0.0 0.2 0.4 0.6 0.8 1.0 Mixing coefficient
0.4 0.5 0.6 0.7 0.8 0.9 1.0
M
ea
n
A
UC
1 seed nodes μ 1 seed nodes rwr 3 seed nodes μ 3 seed nodes rwr 7 seed nodes μ 7 seed nodes rwr 15 seed nodes μ 15 seed nodes rwr
(a) 1000 nodes
0.0 0.2 0.4 0.6 0.8 1.0 Mixing coefficient
0.4 0.5 0.6 0.7 0.8 0.9 1.0
M
ea
n
A
UC
1 seed nodes μ 1 seed nodes rwr 3 seed nodes μ 3 seed nodes rwr 7 seed nodes μ 7 seed nodes rwr 15 seed nodes μ 15 seed nodes rwr
[image:5.612.86.529.85.270.2](b) 5000 nodes
Figure 3: Non-overlapping LFR community networks with varying seed nodes with 1000 and 5000 nodes. Data points repre-sent mean AUC scores for all communities on 10 sampled networks at varying mixing coefficients. Error bars reprerepre-sent one standard deviation.
0.0 0.2 0.4 0.6 0.8 1.0 Overlapping nodes (fraction)
0.4 0.5 0.6 0.7 0.8 0.9 1.0
M
ea
n
A
UC
1 seed nodes μ 1 seed nodes rwr 3 seed nodes μ 3 seed nodes rwr 7 seed nodes μ 7 seed nodes rwr 15 seed nodes μ 15 seed nodes rwr
(a) 1000 nodes
0.0 0.2 0.4 0.6 0.8 1.0 Overlapping nodes (fraction)
0.4 0.5 0.6 0.7 0.8 0.9 1.0
M
ea
n
A
UC
1 seed nodes μ 1 seed nodes rwr 3 seed nodes μ 3 seed nodes rwr 7 seed nodes μ 7 seed nodes rwr 15 seed nodes μ 15 seed nodes rwr
(b) 5000 nodes
Figure 4: Overlapping LFR community networks with varying seed nodes with 1000 and 5000 nodes. Data points represent mean AUC scores for all communities on 10 sampled networks at varying overlapping fraction of nodes. Error bars represent one standard deviation.
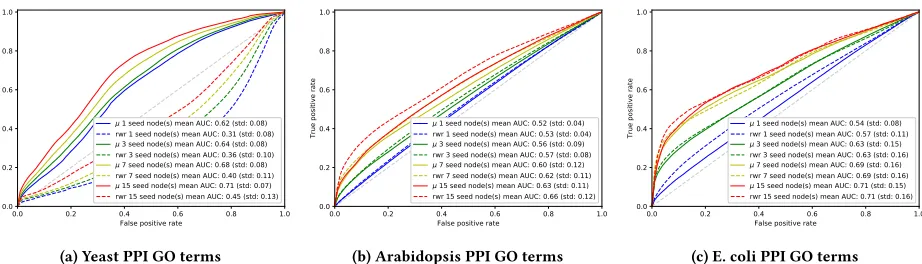
terms for each of the proteins from AmiGO [7]. Gene Ontology is a controlled vocabulary of terms associated with biological functions in three broad categories of Cellular Components (CC), Metabolic Functions (MF) and Biological Processes (BP), forming a hierarchy of terms and associated sub terms.
These labels are not all likely to be represented within the protein-protein interaction networks, though many biological processes
are. For the Yeast,ArabidopsisandE. coliPPIs we collected 85, 549
and 420 terms covering at least 3 nodes, respectively. As expected, average ROC and AUC scores shown in Figure 6 are considerably lower than for the Protein complexes for both our method and the rwr approach. Notably, however, the performance of the rwr
approach is significantly worse than one would expect to find at random for the Yeast GO terms. The reason for this performance remains unknown, however, it is likely to to the fact that the gene ontology labels are poorly represented in the dataset. However, this approach should be considered in contrast to conventional gene enrichment strategies on conventional network clusters [8].
4
DISCUSSION
The semi-supervised method for vertex classification presented in this work has been shown to produce good results on both synthetic benchmarks and real-world datasets. Interestingly, this method is capable of correctly classifying communities with only a small
[image:5.612.85.533.329.511.2]0.0 0.2 0.4 0.6 0.8 1.0 False positive rate
0.0 0.2 0.4 0.6 0.8 1.0
Tru
e p
osi
tiv
e r
ate
μ 1 seed node(s) mean AUC: 0.87 (std: 0.14) rwr 1 seed node(s) mean AUC: 0.78 (std: 0.14) μ 3 seed node(s) mean AUC: 0.89 (std: 0.09) rwr 3 seed node(s) mean AUC: 0.82 (std: 0.12) μ 7 seed node(s) mean AUC: 0.89 (std: 0.08) rwr 7 seed node(s) mean AUC: 0.84 (std: 0.10) μ 15 seed node(s) mean AUC: 0.90 (std: 0.07) rwr 15 seed node(s) mean AUC: 0.86 (std: 0.09)
(a) EU email departments
0.0 0.2 0.4 0.6 0.8 1.0 False positive rate
0.0 0.2 0.4 0.6 0.8 1.0
Tru
e p
osi
tiv
e r
ate
μ 1 seed node(s) mean AUC: 0.87 (std: 0.12) rwr 1 seed node(s) mean AUC: 0.90 (std: 0.06) μ 3 seed node(s) mean AUC: 0.89 (std: 0.08) rwr 3 seed node(s) mean AUC: 0.91 (std: 0.06) μ 7 seed node(s) mean AUC: 0.89 (std: 0.06) rwr 7 seed node(s) mean AUC: 0.90 (std: 0.06) μ 15 seed node(s) mean AUC: 0.89 (std: 0.09) rwr 15 seed node(s) mean AUC: 0.87 (std: 0.07)
(b) Yeast PPI protein complexes
0.0 0.2 0.4 0.6 0.8 1.0 False positive rate
0.0 0.2 0.4 0.6 0.8 1.0
Tru
e p
osi
tiv
e r
ate
μ 1 seed node(s) mean AUC: 0.63 (std: 0.09) rwr 1 seed node(s) mean AUC: 0.73 (std: 0.09) μ 3 seed node(s) mean AUC: 0.76 (std: 0.11) rwr 3 seed node(s) mean AUC: 0.79 (std: 0.13) μ 7 seed node(s) mean AUC: 0.75 (std: 0.13) rwr 7 seed node(s) mean AUC: 0.90 (std: 0.11)
(c) Arabidopsis PPI protein complexes
0.0 0.2 0.4 0.6 0.8 1.0 False positive rate
0.0 0.2 0.4 0.6 0.8 1.0
Tru
e p
osi
tiv
e r
ate
μ 1 seed node(s) mean AUC: 0.87 (std: 0.12) rwr 1 seed node(s) mean AUC: 0.92 (std: 0.04) μ 3 seed node(s) mean AUC: 0.90 (std: 0.07) rwr 3 seed node(s) mean AUC: 0.92 (std: 0.04) μ 7 seed node(s) mean AUC: 0.89 (std: 0.06) rwr 7 seed node(s) mean AUC: 0.92 (std: 0.03) μ 15 seed node(s) mean AUC: 0.88 (std: 0.06) rwr 15 seed node(s) mean AUC: 0.91 (std: 0.03)
[image:6.612.85.530.86.447.2](d) E. coli PPI protein complexes
Figure 5: Receiver operator characteristic (ROC) curves for the high quality labels for real networks described in Section 3.4. Results represent the averages over all receiver operating characteristic scores from all samples of label sets with the cross validation procedure described in 3.1.
number of seed query vertices. These results show that this query method could be used as a powerful exploratory tool in network analysis.
The fact that the method is able to uncover small protein com-plexes seems to contradict the principle that modularity maximisa-tion algorithms have a resolumaximisa-tion limit [12]. Whilst this appears to be the case it is important to note that the resolution limit applies to a single partition of space. Further work is needed to investigate why small communities are still detectable. However, we speculate that it is likely due to the fact that the co-classification of vertices between different partitions remains fairly tolerant to changes. In other words, the small cluster of nodes is always clustered in the same community, regardless of the partition. We do note that, where communities are very small, any approach will be extremely sensitive to false positive and false negative results. As such, this should be considered when using any method of this form as an exploratory tool.
The approach also appears to be tolerant to a small number of seed nodes. This is interesting as in most sampled cases the relevant nodes are unlikely to be direct neighbours. From the perspective of exploratory studies, this implies that a small number of query vertices can be used to find potentially related vertices.
5
RELATED WORK
This work relates very strongly to the idea of local community
detection, more specifically the idea ofseed set expansion[16]. Here,
a given seed set is created and random walks are analysed to find clearly related communities of vertices. One of the most common approaches to finding related vertices in a network is the random walk with restart (RWR) [5, 21] explained in section 3.2. This ap-proach has been applied in fields as diverse as recommender systems and the detection of potential drug targets [9]. In RWR the relat-edness of any pair of vertices can be seen as the probability of a
0.0 0.2 0.4 0.6 0.8 1.0 False positive rate
0.0 0.2 0.4 0.6 0.8 1.0
Tru
e p
osi
tiv
e r
ate
μ 1 seed node(s) mean AUC: 0.62 (std: 0.08)
rwr 1 seed node(s) mean AUC: 0.31 (std: 0.08)
μ 3 seed node(s) mean AUC: 0.64 (std: 0.08)
rwr 3 seed node(s) mean AUC: 0.36 (std: 0.10)
μ 7 seed node(s) mean AUC: 0.68 (std: 0.08)
rwr 7 seed node(s) mean AUC: 0.40 (std: 0.11)
μ 15 seed node(s) mean AUC: 0.71 (std: 0.07)
rwr 15 seed node(s) mean AUC: 0.45 (std: 0.13)
(a) Yeast PPI GO terms
0.0 0.2 0.4 0.6 0.8 1.0 False positive rate
0.0 0.2 0.4 0.6 0.8 1.0
Tru
e p
osi
tiv
e r
ate
μ 1 seed node(s) mean AUC: 0.52 (std: 0.04)
rwr 1 seed node(s) mean AUC: 0.53 (std: 0.04)
μ 3 seed node(s) mean AUC: 0.56 (std: 0.09)
rwr 3 seed node(s) mean AUC: 0.57 (std: 0.08)
μ 7 seed node(s) mean AUC: 0.60 (std: 0.12)
rwr 7 seed node(s) mean AUC: 0.62 (std: 0.11)
μ 15 seed node(s) mean AUC: 0.63 (std: 0.11)
rwr 15 seed node(s) mean AUC: 0.66 (std: 0.12)
(b) Arabidopsis PPI GO terms
0.0 0.2 0.4 0.6 0.8 1.0 False positive rate
0.0 0.2 0.4 0.6 0.8 1.0
Tru
e p
osi
tiv
e r
ate
μ 1 seed node(s) mean AUC: 0.54 (std: 0.08)
rwr 1 seed node(s) mean AUC: 0.57 (std: 0.11)
μ 3 seed node(s) mean AUC: 0.63 (std: 0.15)
rwr 3 seed node(s) mean AUC: 0.63 (std: 0.16)
μ 7 seed node(s) mean AUC: 0.69 (std: 0.16)
rwr 7 seed node(s) mean AUC: 0.69 (std: 0.16)
μ 15 seed node(s) mean AUC: 0.71 (std: 0.15)
rwr 15 seed node(s) mean AUC: 0.71 (std: 0.16)
[image:7.612.77.538.82.214.2](c) E. coli PPI GO terms
Figure 6: Receiver operator characteristic (ROC) curves for gene ontology labels for real networks described in Section 3.4. Results represent the averages over all receiver operating characteristic scores from all samples of label sets with the cross validation procedure described in 3.1.
particle traversing the graph starting at a given vertex and end-ing at another. Conceptually, RWR is very similar to the method presented in this paper given that the user has a given query. The RWR probability as analogous though not equivalent to the value ofµi(S).
The reader may also consider the similarity of this approach to that of label propagation [18, 32], which seeks to find communities based on a vote, where at different time steps a node updates it’s label to to be the most common amongst its neighbours. A common problem with label propagation schemes is that they often fail to converge, resulting in many competing clusterings of a network.
We liken this to the problem encountered by Goodet al. [17] in
modularity maximisation. A core contribution of this paper is that, in such situations, there is no single, context independent labelling scheme that can be seen as the “true” community structure, overlapping or not. Indeed, the approach applied here is extremely general and could be adapted to the label propagation approach (or any other community detection algorithm) should sufficient
semi-supervised group memberships be knowna priori.
Many existing method are based on the idea of a locally dense
subgraph containingall query nodes[2]. In contrast, the query
approach presented here does not require the queries to be a self contained sub-graph. Indeed, queries can contain spurious nodes that are topologically distant from one another - the result is that
theµi(S)score for the query set will likely be very low. Further
investigation into how to evaluate the quality of high averageµi(S)
fori∈Sis left to future work.
In the field of community detection, a number of very recent articles have focused on using metadata to improve the results of community detection approaches. These algorithms, however, are distinct from the approach taken here as the metadata is not used in the module discovery process. Furthermore, the results in this work attempt to explicitly label unlabelled data and only require a relatively small number of labels to operate in such a fashion. In contrast, the recent approach by Newman and Clauset [28], for example, uses examples in which practically the entire network contains labels which is less useful from the perspective of label discovery.
6
CONCLUSIONS
This paper has presented a novel approach to semi-supervised com-munity detection utilising a consensus of high scoring partitions computed with the popular modularity maximisation approach. Previously the glassy search space of this optimisation algorithm has been seen as a major limitation. However, in this work we con-sider each locally optimal partition to be information regarding the true multi-class labels that are likely present in real networks. The approach presented here differs from other ensemble approaches in that the objective is to provide a probabilistic framework for label classification. Performance was shown to be strong on both synthetically generated networks and real-world ground truth com-munities with relatively small sets of labels. In the case of synthetic networks communities are correctly detected up to the detectability threshold. For real world networks with small label sets, aver-age AUC scores were comparable to the random walk with restart method for the high quality datasets tested in this study.
However, this approach requires the community landscape to contain many local maxima, a property likely shared by many real-world, heterogeneous networks. Similarly, the method presented here requires both some labelled data and the labels to be relevant in the context of the underlying network.
This work presents a number of interesting potential future av-enues for research, such as observing how query sets change in time dynamic or multi-scale networks. Furthermore, as the algo-rithm is trivial to run in a distributed manner, this approach could be applied to larger graphs than those studied in this paper. Fur-ther research should also be conducted into how this approach could be applied to other partition quality functions, such as the in-fomap algorithm [33]. The method was implemented in python and all software is available at https://github.com/SBRCNottingham/ cluster query tool.
ACKNOWLEDGEMENTS
We would like to thank Nicole Pearcy and Jenna Reps for assis-tance preparing this manuscript. We are grateful for access to the University of Nottingham High Performance Computing Facility. This work was supported by the UK Biotechnology and Biological Sciences Research Council (BBSRC) grant BB/L013940/1.
REFERENCES
[1] Yong-Yeol Ahn, James P Bagrow, and Sune Lehmann. 2010. Link communities
reveal multiscale complexity in networks.Nature466, 7307 (2010), 761–764.
[2] Austin R Benson, David F Gleich, and Jure Leskovec. 2016. Higher-order
organi-zation of complex networks.Science353, 6295 (2016), 163–166.
[3] Vincent D Blondel, Jean-Loup Guillaume, Renaud Lambiotte, and Etienne
Lefeb-vre. 2008. Fast unfolding of communities in large networks.Journal of Statistical
Mechanics: Theory and Experiment2008, 10 (2008), P10008.
[4] Ulrik Brandes, Daniel Delling, Marco Gaertler, Robert G¨orke, Martin Hoefer, Zoran Nikoloski, and Dorothea Wagner. 2007. On Finding Graph Clusterings with Maximum Modularity Graph-Theoretic Concepts in Computer Science. InGraph-Theoretic Concepts in Computer Science, Andreas Brandst¨adt, Dieter Kratsch, and Haiko M¨uller (Eds.). Lecture Notes in Computer Science, Vol. 4769. Springer Berlin / Heidelberg, Berlin, Heidelberg, Chapter 12, 121–132. https: //doi.org/10.1007/978-3-540-74839-7 12
[5] Tolga Can, Orhan C¸amoˇglu, and Ambuj K Singh. 2005. Analysis of
protein-protein interaction networks using random walks. InProceedings of the 5th
international workshop on Bioinformatics. ACM, 61–68.
[6] Seth Carbon, Amelia Ireland, Christopher J Mungall, ShengQiang Shu, Brad Marshall, Suzanna Lewis, et al. 2009. AmiGO: online access to ontology and
annotation data.Bioinformatics25, 2 (2009), 288–289.
[7] Seth Carbon, Amelia Ireland, Christopher J Mungall, ShengQiang Shu, Brad Marshall, Suzanna Lewis, AmiGO Hub, and Web Presence Working Group. 2008.
AmiGO: online access to ontology and annotation data.Bioinformatics25, 2
(2008), 288–289.
[8] Edward Y Chen, Christopher M Tan, Yan Kou, Qiaonan Duan, Zichen Wang, Gabriela Vaz Meirelles, Neil R Clark, and Avi Ma’ayan. 2013. Enrichr: interactive
and collaborative HTML5 gene list enrichment analysis tool.BMC bioinformatics
14, 1 (2013), 128.
[9] Xing Chen, Ming-Xi Liu, and Gui-Ying Yan. 2012. Drug–target interaction
prediction by random walk on the heterogeneous network.Molecular BioSystems
8, 7 (2012), 1970–1978.
[10] Pierre Demartines and Jeanny H´erault. 1997. Curvilinear component analysis:
A self-organizing neural network for nonlinear mapping of data sets.Neural
Networks, IEEE Transactions on8, 1 (1997), 148–154.
[11] Matija Dreze, Anne-Ruxandra Carvunis, Benoit Charloteaux, Mary Galli, Samuel J Pevzner, Murat Tasan, Yong-Yeol Ahn, Padmavathi Balumuri, Albert-L´aszl´o Barab´asi, Vanessa Bautista, et al. 2011. Evidence for network evolution in
an Arabidopsis interactome map.Science333, 6042 (2011), 601–607.
[12] Santo Fortunato and Marc Barth´elemy. 2007. Resolution limit in community
detection.Proceedings of the National Academy of Sciences of the United States of
America104, 1 (2007), 36–41.
[13] Santo Fortunato and Darko Hric. 2016. Community detection in networks: A
user guide.Physics Reports659 (2016), 1–44.
[14] JP Gilbert. 2015.A probabilistic model for the evaluation of module extraction
algorithms in complex biological networks. Ph.D. Dissertation. University of Nottingham.
[15] Michelle Girvan and Mark EJ Newman. 2002. Community structure in social
and biological networks.Proceedings of the national academy of sciences99, 12
(2002), 7821–7826.
[16] David F Gleich and C Seshadhri. 2012. Vertex neighborhoods, low conductance
cuts, and good seeds for local community methods. InProceedings of the 18th
ACM SIGKDD international conference on Knowledge discovery and data mining. ACM, 597–605.
[17] Benjamin H Good, Yves-Alexandre de Montjoye, and Aaron Clauset. 2010.
Per-formance of modularity maximization in practical contexts.Physical Review E
81, 4 (2010), 046106.
[18] Steve Gregory. 2010. Finding overlapping communities in networks by label
propagation.New Journal of Physics12, 10 (2010), 103018.
[19] Steve Gregory. 2011. Fuzzy overlapping communities in networks.Journal of
Statistical Mechanics: Theory and Experiment2011, 02 (2011), P02017. [20] Roger Guimera and Luis A Nunes Amaral. 2005. Functional cartography of
complex metabolic networks.Nature433, 7028 (2005), 895–900.
[21] Sebastian K¨ohler, Sebastian Bauer, Denise Horn, and Peter N Robinson. 2008.
Walking the interactome for prioritization of candidate disease genes. The
American Journal of Human Genetics82, 4 (2008), 949–958.
[22] Andrea Lancichinetti and Santo Fortunato. 2012. Consensus clustering in complex
networks.Scientific reports2 (2012).
[23] Andrea Lancichinetti, Santo Fortunato, and Filippo Radicchi. 2008. Benchmark
graphs for testing community detection algorithms. Physical Review E78, 4
(2008), 046110.
[24] A. Lancichinetti, F. Radicchi, J.J. Ramasco, and S. Fortunato. 2011. Finding
statistically significant communities in networks.PloS one6, 4 (2011), e18961.
[25] Jure Leskovec, Jon Kleinberg, and Christos Faloutsos. 2007. Graph evolution:
Densification and shrinking diameters.ACM Transactions on Knowledge Discovery
from Data (TKDD)1, 1 (2007), 2.
[26] Jure Leskovec and Andrej Krevl. 2014. SNAP Datasets: Stanford Large Network Dataset Collection. http://snap.stanford.edu/data. (June 2014).
[27] Marina Meil˘a. 2003. Comparing clusterings by the variation of information. In Learning theory and kernel machines. Springer, 173–187.
[28] Mark EJ Newman and Aaron Clauset. 2016. Structure and inference in annotated
networks.Nature Communications7 (2016), 11863.
[29] Mark EJ Newman and Michelle Girvan. 2004. Finding and evaluating community
structure in networks.Physical review E69, 2 (2004), 026113.
[30] Sandra Orchard, Mais Ammari, Bruno Aranda, Lionel Breuza, Leonardo Briganti, Fiona Broackes-Carter, Nancy H Campbell, Gayatri Chavali, Carol Chen, Noemi Del-Toro, et al. 2013. The MIntAct project—IntAct as a common curation platform
for 11 molecular interaction databases.Nucleic acids research42, D1 (2013), D358–
D363.
[31] Shuye Pu, Jessica Wong, Brian Turner, Emerson Cho, and Shoshana J Wodak.
2008. Up-to-date catalogues of yeast protein complexes.Nucleic acids research
37, 3 (2008), 825–831.
[32] Usha Nandini Raghavan, R´eka Albert, and Soundar Kumara. 2007. Near linear
time algorithm to detect community structures in large-scale networks.Physical
Review E76, 3 (2007), 036106.
[33] M Rosvall and C T Bergstrom. 2008. Maps of random walks on complex networks
reveal community structure.Proceedings of the National Academy of Sciences of
the United States of America105, 4 (Jan. 2008), 1118–1123.
[34] Chong Su, Jose M Peregrin-Alvarez, Gareth Butland, Sadhna Phanse, Vincent Fong, Andrew Emili, and John Parkinson. 2007. Bacteriome. org—an integrated
protein interaction database for E. coli.Nucleic acids research36, suppl 1 (2007),
D632–D636.
[35] Haiyuan Yu, Pascal Braun, Muhammed A Yıldırım, Irma Lemmens, Kavitha Venkatesan, Julie Sahalie, Tomoko Hirozane-Kishikawa, Fana Gebreab, Na Li, Nicolas Simonis, et al. 2008. High-quality binary protein interaction map of the
yeast interactome network.Science322, 5898 (2008), 104–110.
![Figure 1: Modularity search space of an E. coliwork. Distance between partitions is calculated using vari- metabolic net-ation of information [27] and dimensionality reduction isperformed using curvilinear component analysis [10]](https://thumb-us.123doks.com/thumbv2/123dok_us/8556388.364326/2.612.58.285.82.292/modularity-partitions-calculated-metabolic-information-dimensionality-isperformed-curvilinear.webp)