Inside Out: The Interrelationships of Sustainable
1Performance Metrics and Its Effect on Business
2Decision Making: Theory and Practice
3Mengfeng Gong1*, Andrew Simpson1, Lenny Koh1, Kim Hua Tan2 4
5
1The University of Sheffield
6
Centre for Energy, Environment and Sustainability 7
Logistics and Supply Chain Management Research Centre 8
Management School, Conduit Road, Sheffield S10 1FL, UK 9
10
2Nottingham University Business School
11
Jubilee Campus 12
Wollaton Road 13
Nottingham, NG8 1BB, UK 14
15
* Corresponding author: Mengfeng Gong ( [email protected] ) 16
http://dx.doi.org/10.1016/j.resconrec.2016.11.001
17 18 19
Abstract
20There has been an increasing interest in the use of decision-making models to achieve 21
sustainability goal in recent decades. However, a systematic review of performance 22
metrics, which are an important element of decision-making models to evaluate the 23
outcomes regarding firm’s economic, environmental and social performance, is 24
lacking. This study provides critical reflections on the current state of literature and 25
industry development regarding sustainable performance metrics and offers concrete 26
suggestions to guide future research. This study contributes to existing studies by (1) 27
exploring the interrelationship between sustainable triple-bottom performance in the 28
decision making process; (2) integrating corporate governance mechanism into 29
decision making process for sustainable consideration; and (3) conducting a 30
comparison between academic theory and industry practice regarding the performance 31
metrics proposed and employed. 32
33 34 35 36
Keywords: Business Decision Making; Corporate Governance Mechanism; 37
Performance Metrics; Sustainable Supply Chain Management
1.
Introduction
3940
Business decision-making and sustainable supply chain management (SSCM) are 41
both relatively established research fields. The former conceptualizing as “a locus of 42
innovation, planning tools, heuristic logic, or market device” (Hacklin and Wallnofer, 43
2012, pp. 166). The latter exploring “the management of material, information and 44
capital flows as well as cooperation among companies along the supply chain, taking 45
goals from the three perspectives of sustainable development, i.e., economic, 46
environmental and social, into account which are derived from customer and 47
stakeholder requirements” (Seuring and Muller, 2008). With customers’ expectations 48
and demands rapidly changing, companies targeting a customer base with high 49
awareness of all three perspectives of sustainability need careful consideration of 50
these in their business decision-making. Unfortunately, one of the most challenging 51
aspects of decision-making to achieve sustainability, is that elements of the process 52
are beyond the reach of companies’ control (Gimenez and Tachizawa, 2012). A high 53
level of environmental performance achieved by one firm can be brought to nothing 54
by its supply chain partners’ poor environmental/social performance (Faruk et al., 55
2001). For example, Apple, Samsung and Sony who has invested heavily in its 56
Corporate Social Responsibility (CSR) development face child labour claims due to 57
the poor performance of its supply chain partners (Wakefield, 2016). The problem 58
arises where the two parties have different interests and asymmetric information, such 59
that the one player cannot directly ensure that the other player is always acting in 60
mutual best interests, particularly when activities that are useful to the one player are 61
costly to the other, and where elements of what the other player does are costly to 62
observe. This asymmetric information problem exists between the companies and its 63
partners in the value chain. The extant literature has documented the important role of 64
governance mechanisms, which are defined as a set of arrangements “that coordinate 65
all stakeholder interests to ensure that the decision-making is more scientific and 66
safeguards all corporate interests” (Li et al., 2014), see also Gillan, 2006; Jensen, 67
2002; Zingales, 1998, in reducing asymmetric information problems. Therefore, to 68
meet with the newly developed sustainability requirements, firms have recognized the 69
need to not only guide their business decision internally through governance 70
mechanisms but also extend their traditional business making decision process 71
beyond the firms’ boundary to involve their supply chain partners through external 72
governance mechanisms. This prompts questions about how sustainability should be 73
measured into different levels of management decision-making through the value 74
chain and supply network to achieve sustainable production from upstream 75
relationships to sustainable consumption from downstream relationships. 76
77
To operationalize the triple bottom line (economic, social and environmental 78
interrelationships between these perspectives and to guide decision-making processes, 80
clear metrics of “performance are needed in order to judge the efficacy of any 81
decision on the resulting sustainability performance” (Hutchins and Sutherland, 2008). 82
Against this backdrop, the authors hereby extend the existing literature by 83
investigating how the academic literature address the decision-making process in the 84
context of sustainable supply chain management and identifying the gap between the 85
academic literature and industrial practices regarding sustainability related factors that 86
influence decision makers aiming to fulfil strategic sustainability goals. Current 87
research has been conduct regarding the performance indicators applied for 88
decision-making regarding sustainability (Seuring and Müller, 2008; Hutchins and 89
Sutherland, 2008; Hervani et al., 2005, Bai et al., 2012). However, this study 90
identifies little existing research that examines the interrelationship between the triple 91
perspectives, especially from the lens of triangulation between theoretical and 92
practical viewpoints. Thus, the authors contribute to the extant literature by 93
comparing the performance metrics proposed by scholarly research and employed by 94
industry. More specifically, the authors aim to answer three questions: what are the 95
metrics of performance suggested by the academic literature and what is the 96
interrelationship between these? Has industry used these metrics? What is the impact 97
of governance mechanisms on decision-making models that focus on corporate 98
sustainability performance? 99
100
In doing so, this study attempts to follow a systematic review method to identify the 101
performance metrics across a broad range literature of business decision-making 102
processes and their use within industry. Although some previous reviews (Koh et al, 103
2016) can be found, this systematic review distinguish itself from previous reviews by 104
demonstrating its in-depth rigour of the methodology adopted and also the new 105
research directions proposed as a result of the triangulation between theory and 106
practice to comprehensively understand the interrelationship between the triple 107
perspectives. A major debate of this study is that a significant proportion of current 108
business model building research assume there is an implicit or explicit win-win 109
situation between three sustainable perspectives: economic, social and environmental, 110
however this may not exist. More specifically, current literature argues that by 111
investing in social and environmental perspectives, the company can realise better 112
economic performance. Even if there might be short-term conflict, a long-run win-win 113
situation exists. However, this study suggests that instead of turning a blind eye on the 114
interrelationship between the three sustainable perspectives by assuming a win-win 115
situation for all cases, it is practical to go inside the box and test the interrelationship 116
among these perspectives before building business decision models; a reverse 117
causality from improved economic performance to improved environmental and 118
social performance or a negative relationship between economic performance and 119
environmental and social performance might exist, which have significant 120
examination of this interrelationship under different governance mechanisms and 122
conditions and call attention to the contingency perspective in future study. 123
124
The unique points of this study also involve a content analysis of annual reports, 125
sustainability reports and corporate reasonability reports of the top 50 listed 126
manufactures selected from FTSE 250 companies. Consequently, this study 127
contributes to both the academic and professional communities. For researchers, the 128
authors summarize current knowledge and suggest some directions for future research. 129
For professionals, this study can be used to guide what performance metrics can be 130
implemented by businesses. 131
132
The structure of this study is as follows. The next section provides a summary of the 133
methodology and outlines the research protocol adopted to identify the systematic 134
review sample papers. The results of the search and initial analysis are presented, 135
followed by a discussion of the findings. Finally, conclusions are drawn, with 136
implications for management practice and further academic research. 137
138
2.
Methodology
139140
This study applies a systematic review approach to provide a comprehensive literature 141
review. Systematic review is a rigorous review methodology originally developed 142
mainly within medical research and first outlined for the field of management and 143
organization studies by Tranfield et al (2003). By adopting a scientific, transparent 144
and replicable process, systematic reviews differ from more traditional approaches to 145
literature reviews. Through exhaustive searches of published work, with a clear audit 146
trail of the decisions and actions taken, the aim is to reduce bias and error (Tranfield 147
et al., 2003). The principle aim is to draw a balanced understanding of research in a 148
specific field without selecting for publication field or location, and to obtain a 149
reliable overview of a subject that cannot be achieved by a single non-longitudinal 150
study (Tranfield et al., 2003). As outlined by Thorpe (2005), a systematic literature 151
review should provide: transparency - each search of the available research studies is 152
recorded (Denyer and Neely, 2004), clarity - a clear, stepped series of searches is 153
presented (Tranfield et al., 2003), focus, - unify research and practitioner communities 154
(Leseure et al., 2005), equality - studies are reviewed on their own merits with no 155
distinction between the nature of journals (Pittaway et al., 2004), accessibility – the 156
reviews are made available outside of the specialist in the forms of searchable 157
database with broad coverage (Pittaway et al., 2004). 158
159
Following the procedures laid out by recent systematic review (Dekkers et al., 2013; 160
Fogliatto et al., 2012; Keupp et al., 2012), the authors applied two stages of search 161
strings. Step one involved identifying potential relevant papers, the authors selected 162
(Hubbard, 2009). The triple bottom line, of environmental, social, economic 164
sustainability is a central concept to help operationalize sustainability (Elkington, 165
1997, Seuring and Müller, 2008). As such, three search strings (“environmental 166
sustainability” AND “management”, “economic sustainability” AND “management”, 167
and “social sustainability” AND “management”) are searched using 2 databases: 168
Scopus and Web of Science, using key word search of [“Environmental sustainability 169
AND management”], [“Economic sustainability AND management”] and [“Social 170
sustainability AND management”] within title, abstract and keyword fields (Table 1). 171
The sample period covers from January 2007 to March 2016, to ensure this study 172
reflect the recent development in this field. 173
174
The choice for Scopus and Web of Science is due to the fact that each of the two 175
databases are documented to have extensive coverage for peer review journals (Meho 176
and Yang, 2007). As of 5th May 2016, Thomson Reuters Web of Science had covered 177
more than 12,000 of the high impact research journals and contains over 90 million 178
records. By January 2016, Elsevier’s Scopus has covered over 21,500 peer-reviewed 179
journals and over 60 million records. 180
181
Table 1: Search String 182
Stage 1 Stage 2 (based on the Stage 1
database) Search String 1: Environmental sustainability
AND management
Search string 4: Supply chain
Search String 2: Economic sustainability AND management
Search String 3: Social sustainability AND management
183
Both databases are searched individually with the selected keywords. Only published 184
peer‐reviewed journal articles were considered. Equally, As argued by Newbert, 185
(2007), David and Han (2004) and Gosling and Naim, (2009), the authors considered 186
that by restricting the search to peer‐reviewed journals, the quality control of search 187
results was enhanced due to the peer review process to which articles published in 188
such journals are subject to prior to publication. This step generated a total 34,442 189
articles in English (16, 564 articles in Scopus and 17, 878 articles in Web of Science). 190
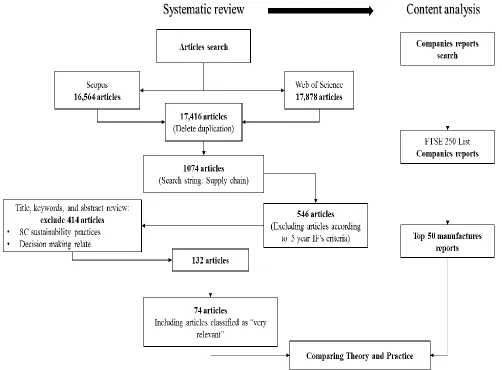
After deleting duplicates, the total number of unique articles in is 17, 416. The 191
process of is illustrated in Figure 1. 192
193
Following the previous step, the authors further searched the papers identified for 194
reference to Supply Chains as indicated in Table 1 in order to broadly capture the 195
potential list of studies that might be related to the authors’ research questions. This 196
reviewed the authors excluded journals where the 5-year impact factor was less than 198
3.0 for science journals and 1.0 for social science journals. As noted by Moed (2010) 199
impact factors vary between disciplines, with science journals often having higher 200
impact factors than those in the social sciences, by setting these levels the authors 201
intend to capture only research published in highly rated journals. After excluding all 202
articles with 5-year impact factor less than the journal’s exclusion criteria, 546 unique 203
articles remained. 204
205
The penultimate step of the review consisted of reading the titles, abstracts and key 206
words of all unique citations with one criteria: remove papers with abstracts that 207
describe content not relevant to the research topic. The process of initial review by 208
title, abstract and key words, follows the two-tier methodology proposed by Keupp et 209
al. (2012) and Denyer and Neely (2004) to reduce subjective bias, encourage 210
transparency and enhance validity. To achieve this, the authors organized themselves 211
into two groups that undertook the review independently of each other. The use of a 212
two-phase review process is identical in purpose to the expert panel used by Tranfield 213
(2003) and Leseure et al. (2005). The review began with a general agreement on the 214
inclusion/exclusion criteria for the purpose of excluding non-relevant papers 215
according to the authors’ views of supply chain sustainability and decision-making 216
performance metrics. This resulted in 132 articles remaining. 217
220
Figure 1: The Methodology Overview 221
222 223
These 132 articles were read in full by the authors to grade as “limited relevance”, 224
“somewhat relevant” and “very relevant” as such to identify their direct relevance to 225
the research questions. This resulted in 74 articles been classified as “very relevant” 226
to the authors’ research. 227
228
By applying these systematic principles, this review has sought to gather all relevant 229
research in the field, so as to make sense of it, encourage openness and enable validity 230
in research repetition (Tranfield et al., 2003). Collection of all relevant research at a 231
point in time also provides the foundations for new research questions to be posed. 232
However, this method is not without its limitations. Challenges encountered in this 233
study were similar to the limitations highlighted by Pittaway et al (2004) and Leseure 234
(2005). The key word search of “sustainability” is ambiguous, resulting in 235
publications from journals from multiple disciplines as well as topics outside the 236
scope of this study. Synthesizing a broad range of topics, industry and outcomes was 237
inclusion and exclusion criteria, contributed to the authors’ efforts in finalizing the list 239
of papers relevant to this study. In addition, there were risks associated with filtering 240
papers based on their abstracts. As highlighted by Pittaway et al (2004), much 241
depends on the quality of the written abstract, and consequently some relevant papers 242
may have been mislabelled and excluded for the final list. To mitigate part of this risk, 243
papers whose abstracts indicated that it may fall into category either “somewhat 244
relevant” or “very relevant” were read in detail to determine whether or not they 245
belong to the later. 246
247 248
3.
Findings and Discussion from the Systematic Literature
249Review
250251
The authors’ analysis found 74 papers clearly focused on supply chain 252
practices/mechanism to facilitate the decision-making process in the context of 253
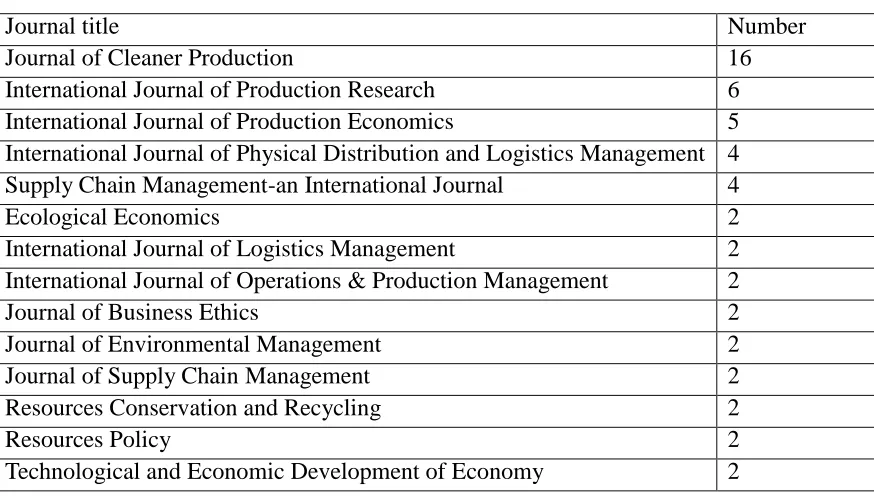
sustainability. The distribution by journal is shown in Table 2. The Journal of Cleaner
254
Production is clearly the leading journal in this context as evidenced in our results. 255
This finding is noteworthy due to the fact that this journal is not listed in the 256
Academic Journal Guide 2015, which is widely used as a reference for UK business 257
school researchers, whilst its impact factor is respectfully high in its own right. One 258
can argue that the interdisciplinary nature of sustainability triadic complexity, has led 259
to journal(s) that appreciate this lens. 260
261
Figure 2 presents the distribution of publications in this domain over time, indicating 262
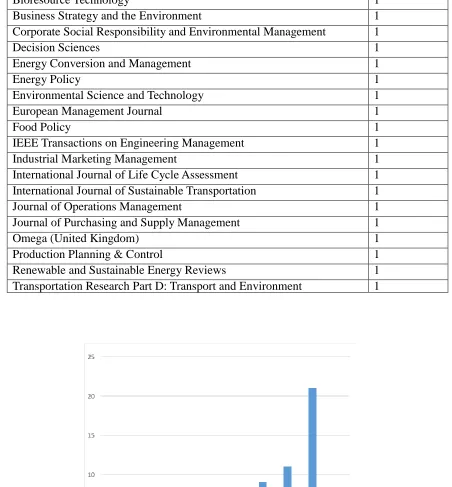
a research field that has grown rapidly in the last decade. 263
[image:8.595.88.525.518.766.2]264
Table 2 Ranking of journals by number of publications 265
Journal title Number
Journal of Cleaner Production 16
International Journal of Production Research 6 International Journal of Production Economics 5 International Journal of Physical Distribution and Logistics Management 4 Supply Chain Management-an International Journal 4
Ecological Economics 2
International Journal of Logistics Management 2 International Journal of Operations & Production Management 2
Journal of Business Ethics 2
Journal of Environmental Management 2
Journal of Supply Chain Management 2
Resources Conservation and Recycling 2
Resources Policy 2
Transportation Research Part E-Logistics and Transportation Review 2
Bioresource Technology 1
Business Strategy and the Environment 1 Corporate Social Responsibility and Environmental Management 1
Decision Sciences 1
Energy Conversion and Management 1
Energy Policy 1
Environmental Science and Technology 1
European Management Journal 1
Food Policy 1
IEEE Transactions on Engineering Management 1
Industrial Marketing Management 1
International Journal of Life Cycle Assessment 1 International Journal of Sustainable Transportation 1
Journal of Operations Management 1
Journal of Purchasing and Supply Management 1
Omega (United Kingdom) 1
Production Planning & Control 1
Renewable and Sustainable Energy Reviews 1 Transportation Research Part D: Transport and Environment 1 266
267 268
[image:9.595.78.530.95.582.2]269
Figure 2: Time distribution of sample publications 270
271 272
fundamental nexus of the debate on the interrelationship between sustainable 274
performance metrics in business decision-making models. These are discussed below: 275
276
3.1 Triple-bottom line perspective: 277
The number of papers regarding sustainability within the supply chain management 278
discipline has grown significantly during the last decade. The economic perspective, 279
within the subject, is the most documented performance metric, which almost all of 280
the sample papers mention. However, most consider traditional accounting 281
measurements of focal companies such as cost, revenue, and profitability to guide the 282
economic business decision (Taticchi et al., 2015). Only a few consider profit-sharing 283
indicators for the supply chain partners. As suggested by Taticchi et al., (2015) a 284
future economic sustainability performance indicator should emphasize the 285
importance of a cooperative relationship, instead of a competitive relationship with 286
separate units measuring using traditional accounting methods, between the value 287
chain partners to facilitate information share in their efforts to improve their overall 288
sustainability performance. Due to the comparative nature of the study and the limited 289
information disclosure of the sample companies, the triple-bottom line perspective the 290
authors focused on is at the operational level (company level) performance metrics 291
instead of the country-level macroeconomic sustainable performance metrics, though 292
the authors have seen a sound progress towards this path (Vahabzadeh 2015; Vachon 293
and Mao 2008). 294
295
It is worthwhile to note that most papers in the authors’ sample have made a 296
concerted effort to advance environmental measurements. Measurements include, but 297
not limited to carbon emission (Koh et al., 2013; Lake et al., 2015; Gadema and 298
Oglethorpe, 2011; Fichtinger), natural and material resources usage (Liu st al., 2012; 299
Pimentel et al., 2016; Wu and Pagell, 2011) and waste generated from products and 300
materials (Nagurney et al., 2015; Verghese, 2010; Bai and Sarkis, 2014). Hassini et al., 301
(2012) suggested that although there is no obvious shortage of environmental metrics, 302
it is still challenging to know when to use which one and how to decide between these. 303
A more fine-grained industry-oriented performance metrics should be studied and 304
developed to answer this call. Over the sample period, the authors saw a diversified 305
sample of industries across different institutional background including: the 306
construction minerals industry in China (Chen et al., (2015); US hospital industry 307
(Kumar et al., 2008), U.S. Diaper production case (Adhitya et al., 2011); Brazilian 308
energy sector (Matos and Silvestre, 2013); automotive suppliers (Subramoniam, 309
2009); Food industry (Gadema and Oglethorpe, 2011) and fashion industry (Li, 310
2014). 311
312
A comprehensive list of indicators to measure social performance is proposed by the 313
UN in “Indicators of Sustainable Development: Guidelines and Methodologies (2007)” 314
However, there exist a gap between theory and implementation to operationalize the 316
social performance metrics in decision-making related to supply chains. A more 317
detailed comparison with social measurements currently employed by UK top 318
companies is presented in the next section. Among the sample literature, the authors 319
observe an increasing application using a more holistic concept of corporate social 320
responsibility (CSR) to acknowledge the importance of social aspect to guide business 321
decisions, see Hutchins and Sutherland (2008); Morali and Searcy (2013); Li et al. 322
(2014). Hutchins and Sutherland (2008) made a significant advance by including 323
measures of social sustainability into business decision-making practice by proposing 324
several measures such as labour equity, healthcare, safety, and philanthropy, which are 325
discussed in their social Life Cycle Assessment (LCA) model that not only provide 326
insight into the mapping of corporate inputs and outputs into measures of social 327
performance but also demonstrate corporate actions can be used to effect positive 328
social change. Vachon and Mao (2008) attempt to link supply chain strength to 329
sustainable social welfare in a country-level analysis and conclude that the number 330
and quality of the suppliers and customers in a country (supply chain strength) is 331
positively linked to a country’s sustainable development. 332
333
Table 3 outlines the performance measures of the three perspectives of the triple 334
Table 3: Sustainable measurements discussed in the literature 336
337
Sustainability perspective
Code Measurements
Economic E1 Costs (Metta and Badurdeen, 2013, Chaabane et al., 2012, Wang and Hsu, 2010, Adhitya et al., 2011)
E2 Revenues (Metta and Badurdeen, 2013, Chaabane et al., 2012, Choudhary et al., 2015, Adhitya et al., 2011, Awudu and Zhang, 2012)
E3 Profit sharing (Chaabane et al., 2012, Wang and Hsu, 2010, Adhitya et al., 2011)
E4 Creating sustainability value (relates environmental and social) (Pimentel et al., 2016, Zhang and Awasthi, 2014, Huq et al., 2014, Awudu and Zhang, 2012)
Environmental EN1 Emission reduction/ climate change (Tseng and Hung, 2014; Koh, et al., 2013; Lake et al., 2015; Gadema and Oglethorpe, 2011; Elghali, et al., 2007)
EN2 Natural sources' usage (energy efficiency) (Elghali, et al., 2007; Cucchiella and D'Adamo, 2013, van Hoek and Johnson, 2010)
EN3 Waste reduction (Nagurney et al., 2015; Harms et al., 2013, Erol et al., 2011)
EN4 Used product or material 's disposal (Erol et al., 2011, Subramoniam et al., 2009)
EN5 Use of recycle materials (Harms et al., 2013, Erol et al., 2011, Rostamzadeh et al., 2015)
EN6 Choice of suppliers by considering the environmental criteria(Shen et al., 2013, Rostamzadeh et al., 2015, Sarkis and Dhavale, 2015)
Social S1 Degree of job localisation (Koh et al., 2013; Harms et al., 2013)
S2 Human rights (Harms et al., 2013, Muduli et al., 2013) S3 Employee CSR training (Koh et al., 2013; Muduli et al.,
2013)
S4 Health care and safety (Hutchins and Sutherland, 2008; Muduli et al., 2013)
S5 Degree of purchasing localisation (Koh et al., 2013; Subramoniam et al., 2009)
S6 Labour equity (Hutchins and Sutherland, 2008)
Conceptually sustainability considers the interrelationships between environmental, 338
social, and economic objectives. Increasingly, research tries to integrate all the three 339
perspectives. It must be emphasised that interrelationship and integration of the triple 340
perspectives are two very different concepts. The former, which is the focus of the 341
study, emphasises on the complex interactions amongst the perspectives, whilst the 342
later focuses on the combinatorial effects. The combinatorial effects of the integration 343
of the triple perspectives have already been theorised and demonstrated (e.g. See Koh 344
et al, 2016). 345
346
Little is understood about the interrelationship of the triple perspectives. Among the 347
selected papers examining the issue, they tend to follow a win-win paradigm, which 348
means economic, environmental and social perspectives can be achieved 349
simultaneously. This key assumption often serves as a foundation to build the 350
proposed business model. More specifically, they tend to assume that there is causal 351
relationship in that improved environmental and social performance lead to sound 352
economic performance. Only a few recognise there might be a short term negative 353
relationship among the trade-off of the three perspectives. Such a win-win paradigm 354
also assumes a long term positive relationship could be achieved. 355
356
Interestingly, the results from a boarder range of sustainability literature reviewed in 357
the study seem to be less supportive of such win-win assumption. Therefore, the 358
authors call for further research to examine this key assumption underpinning the 359
sustainable business model building. 360
361
Generally, there are two strands of research supporting this win-win paradigm. One 362
suggests that the managerial skills of a company with improved social and 363
environmental performance is transferable to the company’s economic activities 364
(Waddock and Graves, 1997, Frooman, 1997, Schuler and Cording, 2006). As a result, 365
the stakeholders reward companies with such ‘good management skills’ through 366
activities such as investment, consumption and higher productivity from employees. 367
Hence, the economic performance is realised. Similarly, another set of research based 368
on the stakeholder theory suggests that the mutual trust and cooperation with 369
stakeholders reduces the negotiation and contracting costs, both implicit and explicit, 370
and serve as control mechanisms that significantly reduces the likelihood of managers’ 371
opportunistic behaviour and pushing them to adopt a long-term orientation (Jones, 372
1995; Choi and Wang, 2009; Eccles, Ioannou and Serafeim, 2014). The stakeholder 373
theory thus implies that a company with improved environmental and social practices 374
should realize lower costs of managing stakeholder relationships and therefore, should 375
earn better economic performance than firms with bad social and environmental 376
practices, vis-à-vis poorly managed stakeholder relationship (Jones, 1995). 377
Furthermore, by addressing the claims of stakeholders, managers can increase the 378
economic performance. 380
381
On the contrary, two strands of theories and empirical studies suggest a negative 382
relationship between environmental and social performance and economic 383
performance. One theory suggests that managers who practice environmental and 384
social activities neglect to take opportunity cost of such actions into account and 385
consequently, sacrifice more profitable activities for the company (Schuler and 386
Cording, 2006). Over time, such activities result in poor economic performance. The 387
other theory is based on agency cost theory state that managers engage in 388
environmental and social practices for their own personal interests because it is 389
difficult for owners to monitor the behaviour of managers (Schuler and Cording, 390
2006). As such, this theory implies that managers, who direct resources toward social 391
and environmental projects, fail to put resources to their highest productive use and, 392
over time, fail to maximize the company’s economic performance. 393
394
Unlike the previous findings of either a positive or a negative causal relationship from 395
environmental and social practice to economic performance, affordability theory, 396
suggests a totally reverse causality. This theory claims that only firms with adequate 397
economic performance can afford to pursue the costly social and economic activities. 398
As a result, the causality of affordability model is that improved economic 399
performance leads to environmental and social practice. Carroll (1979) argue that by 400
managing wisely for economic, then legal, then ethical domains, managers can then 401
disperse resources to philanthropic activities to be a good corporate citizen. Schuler 402
and Cording (2006) suggest that companies such as Anheuser-Busch, Coca-Cola, Eli 403
Lilly, Philip Morris, and Target etc., devoting a portion of their pre-tax income to fund 404
various philanthropic projects, is a group of companies fitting this category. 405
406
Therefore, the debateable win-win or trade-off assumption underpinning the business 407
model building must be examined before a robust model could be proposed. To be 408
more specific, whether environmental and social activities for a particular company or 409
industry really lead to improved economic performance need to be carefully 410
interpreted. More interestingly, it is not simply a question of whether considering 411
social and environmental perspectives in business decision making lead to improved 412
economic performance; the literature has already shown that this can be achieved and 413
have already been demonstrated by (Koh, et al, 2016), it is a matter of how, why and 414
what types of interrelationships exist to support such business decision making 415
leading to a win-win paradigm, vis a vis to avoid failure. In another word, what makes 416
those assumption work and those leading organisations successful in achieving 417
improved performance considering all triple perspective. 418
419
One opposition for such radical thinking may go as follows: if the authors succeed in 420
environmental performance, does this to justify sacrificing environmental and social 422
welfare to economic benefits and therefore is it futile to concentrate on the social and 423
environmental aspects. This objection rests on a common tendency to confuse an 424
explanation of causes with a justification or acceptance of results (Diamond, 1998). 425
Understanding is more often used to try to alter an outcome than to repeat or 426
perpetuate it. “This is why psychologies try to understand the minds of murders and 427
rapists, why physicians try to understand the cause of human disease. Investigators do 428
not seek to justify murder, rape and illness. Instead, they seek to use their 429
understanding of a chain of cause to interrupt the chain” (Diamond, 1998, pp. 28). 430
With this critical lens in mind, the authors attempt to advance prior research by 431
extending not only the conditions in which the win-win assumptions can be 432
understood which test repeatability, but also the behavioural discourse in terms of 433
potential pitfalls and sacrifices in the trade-off in order to achieve a balanced and just
434
outcome for sustainable business decision making. 435
436
The authors interpret this equivocal results of these theories and empirical studies by 437
recognising that not all groups of stakeholders have similar reaction to company 438
environmental and social activities: one groups positive reaction may cause a negative 439
response from another group, confounding these activities and impact on economic 440
performance. For instance, a firm's practice to donate local communities in which its 441
stores operate may be praised by their local employee but criticized by distant 442
shareholders. Thus, a more fine-grained analysis of a particular group is required so as 443
to fully understand this relationship. More generally, a contingency perspective of 444
business model building that states that the economic performance required conforms 445
to levels of environmental and social activities for certain firms at points in time 446
should be called for. That is to say, more research into any causal relationship with 447
moderator effect (under what circumstance) and mediating effect (in what ways) is 448
necessary to understand this relationship and integrate into business decision-making 449
models. 450
451
Such moderating and mediating effects in business decision-making processes are 452
related to a board literature of corporate governance mechanisms. Though there are 453
various definition for this concept, it generally includes a set of arrangements that 454
“coordinate all stakeholder interests to ensure that the decision-making is more 455
scientific and safeguards all corporate interests” (Li et al., 2014), (see also Gillan, 456
2006; Jensen, 2002; Zingales, 1998). These sets of arrangements can be at formal 457
institutional level such as legal and political system (Campbell, 2007) or informal 458
institutional level such as cultural beliefs and norms (Joyner and Payne, 2002), at firm 459
level, such as ownership structure (Johnson and Greening, 1999), at group level such 460
as board structure (Sanders and Carpenter, 1998), board demography (Daily et al., 461
2003), board social capital (Hillman and Dalziel, 2003), and at individual level, such 462
and Ibrahim, 2002), experience (Bear et al., 2010) and political ideology (Chin et al., 464
2013). As such, the authors recommend that greater scholarly attention needs to be 465
accorded to incorporating the multi-level corporate governance mechanism into 466
model building and how multiple configurations of the corporate governance 467
mechanism interact and combine to impact firm decision-making processes regarding 468
sustainable supply chain management from the perspective of moderating and 469
mediating effects. More generally, the authors suggest that business decision-making 470
and corporate governance mechanism in the context of sustainable supply chain 471
management research should employ multi-theoretical lens as reviewed above and 472
apply sophisticated qualitative and quantitative methods such as instrumental 473
variables and the Heckman (1979) two-stage estimation approach to enable a deeper 474
and finer-grained analysis of the casual relationship. 475
476
3.2 The difference between academic theory and industrial practice 477
478
To answer the question, whether industry uses the performance metrics suggested by 479
academia, the top 50 manufactures from FTSE 250 were selected for analysis. The 480
UK has a mature policy environment towards sustainability and extensive reporting 481
requirements that do not exist in less mature economies. Firms listed on the London 482
Stock Exchange represent a broad spectrum of industries that function in multiple 483
markets. By comparing the difference between the theory and practice of such a 484
market, the authors seek to identify where gaps exist and where efforts need to be 485
focussed from both a theoretical and practitioner perspective. The results of this study 486
can serve as an indicator for other emerging or less developed markets of the impact 487
of these differences on sustainability, decision-making and supply chain management 488
across different sectors. Such differences can also provide the foundation for further 489
academic research and the groundwork for managerial practice for both developed 490
and developing economies. 491
492
To collect this data, multiple data sources are used, including Annual Reports (AR), 493
Corporate Responsibility Report (CRR), and Sustainability Report (SR). This study 494
focuses on the financial year 2015 because this provided the most up to date 495
information for each company. The reports were download directly from the 496
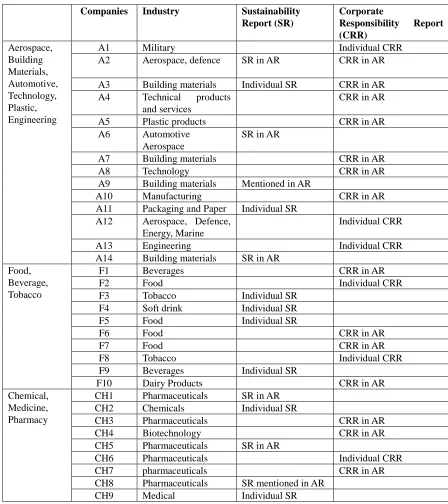
companies’ website and the sample companies are presented in Table 4. The 497
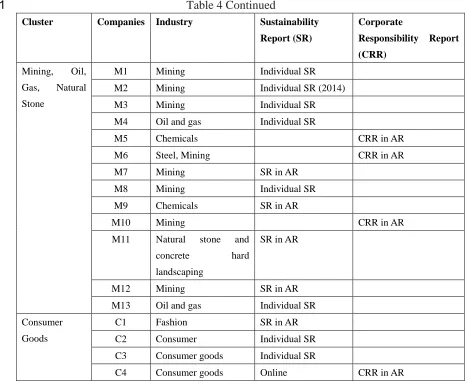
Table 4: Sustainability Report Disclosure for Sample Companies 499
500
Companies Industry Sustainability Report (SR)
Corporate
Responsibility Report (CRR)
Aerospace, Building Materials, Automotive, Technology, Plastic, Engineering
A1 Military Individual CRR
A2 Aerospace, defence SR in AR CRR in AR
A3 Building materials Individual SR CRR in AR
A4 Technical products
and services
CRR in AR
A5 Plastic products CRR in AR
A6 Automotive
Aerospace
SR in AR
A7 Building materials CRR in AR
A8 Technology CRR in AR
A9 Building materials Mentioned in AR
A10 Manufacturing CRR in AR
A11 Packaging and Paper Individual SR
A12 Aerospace, Defence,
Energy, Marine
Individual CRR
A13 Engineering Individual CRR
A14 Building materials SR in AR
Food, Beverage, Tobacco
F1 Beverages CRR in AR
F2 Food Individual CRR
F3 Tobacco Individual SR
F4 Soft drink Individual SR
F5 Food Individual SR
F6 Food CRR in AR
F7 Food CRR in AR
F8 Tobacco Individual CRR
F9 Beverages Individual SR
F10 Dairy Products CRR in AR
Chemical, Medicine, Pharmacy
CH1 Pharmaceuticals SR in AR
CH2 Chemicals Individual SR
CH3 Pharmaceuticals CRR in AR
CH4 Biotechnology CRR in AR
CH5 Pharmaceuticals SR in AR
CH6 Pharmaceuticals Individual CRR
CH7 pharmaceuticals CRR in AR
CH8 Pharmaceuticals SR mentioned in AR
Table 4 Continued
501
Cluster Companies Industry Sustainability
Report (SR)
Corporate
Responsibility Report
(CRR)
Mining, Oil,
Gas, Natural
Stone
M1 Mining Individual SR
M2 Mining Individual SR (2014)
M3 Mining Individual SR
M4 Oil and gas Individual SR
M5 Chemicals CRR in AR
M6 Steel, Mining CRR in AR
M7 Mining SR in AR
M8 Mining Individual SR
M9 Chemicals SR in AR
M10 Mining CRR in AR
M11 Natural stone and
concrete hard
landscaping
SR in AR
M12 Mining SR in AR
M13 Oil and gas Individual SR
Consumer
Goods
C1 Fashion SR in AR
C2 Consumer Individual SR
C3 Consumer goods Individual SR
C4 Consumer goods Online CRR in AR
502
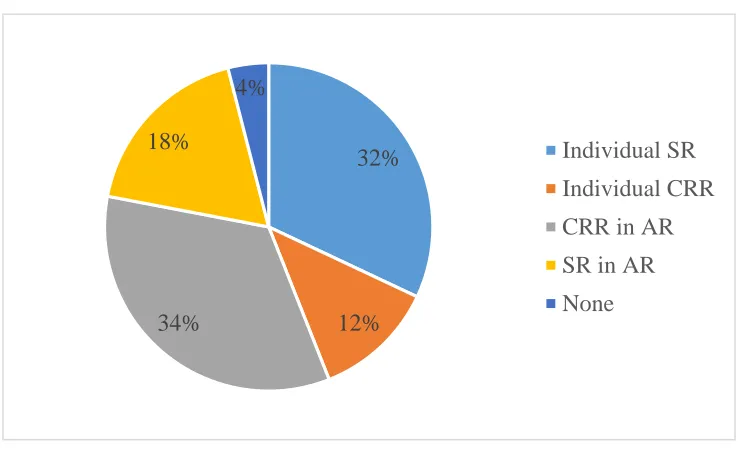
In the authors’ sample, almost all of companies disclose the sustainability issues with
503
around 32% of companies having separate sustainability reports and 12% having 504
separate corporate responsibility reports. The remaining companies disclose 505
sustainability issues in annual reports. Comparing companies disclosing sustainability 506
issue in the annual reports, companies with individual CRR or SR reports tend to be 507
more concerned with sustainability practice since they can reveal the sustainability 508
issue in more details within separate reports while the companies reporting 509
sustainability in annual reports merely put sustainability issues in strategic section 510
with limited actionable practices. It is noteworthy that the industry with greater 511
proportions of sustainability disclosed practices is Consumer Goods Industry with 4 512
out of 4 has separate sustainability reports, following by Mining, Oil and Gas, Nature 513
Stone Industry with 7 out of 10, which is justified by heavy marketing schemes 514
regarding sustainability from Consumer Goods industry and the resource consumption 515
nature of Mining and Oil and Gas industries. 516
519
Figure 3: Distribution of companies’ SR and CRR disclosure 520
521
The authors categorized the measures identified from the systematic review, Table 3,
522
to examine, which performance metrics have been used in the company’s report
523
sustainability performance. All the companies receive a score of 0 or 1 on each of
524
corresponding economic, environmental and social measures, 1 means the company
525
did disclose the information otherwise it is 0.
526 527
The results presented in Table 5 show that all the metrics identified in the literature
528
are used by at least company. Only three metrics are reported by all the firms
529
researched, EN1, emissions reduction/climate change; S4 Health and Safety; S7,
530
community. This prevalence is almost certainly due to statutory reporting
531
requirements. The majority of all the metrics identified in the literature were reported
532
on by the majority of the selected companies. It is interesting to note that three of the
533
metrics were reported by less than half the companies. S1, Degree of job localisation
534
was reported by only 10 firms, this perhaps reflects the multinational nature of these
535
companies. S6, labour equity was reported by only 16 companies and E4, creating
536
sustainability value was reported by only 20 companies. These represent the largest
537
gaps between theory and practice within the companies researched.
538 539
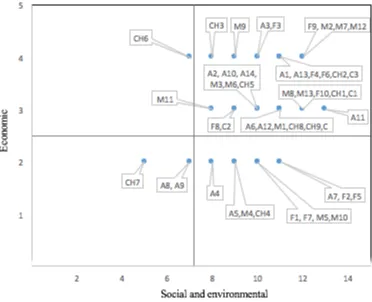
In order to visualise the level of reporting against each of the perspectives of
540
sustainability the results from Table 5 were graphed as presented in Figure 4. The
541
x-axis and y-axis are the aggregated scores against the disclosed perspectives. The
542
environmental and social metrics have been combined into a single scale to allow for
543
clear comparison with the more traditional economic metrics. Each quartile of these
544
figures represents a different profile of reporting against the three perspectives. The
545
High-High quartile represents companies that report the majority of all three
546
32%
12% 34%
18%
4%
Individual SR
Individual CRR
CRR in AR
SR in AR
perspectives’ performance metrics. The Low – Low quartile identifies companies that
547
report a minority of both economic, social and environmental metrics potentially
548
identifying companies that report only to comply with statutory requirements. The
549
High – Low quartile represents companies that reported against more than half of the
550
environmental and social metrics but a half or less of the economic metrics,
551
suggesting firms that are interested in demonstrating a wider commitment to
552
sustainability. The Low – High quartile represents firms that used the majority of
553
economic metrics but a minority of social and environmental metrics.
554 555
All four firms in the Consumer Goods industry are in the High – High quartile,
556
reporting against the majority of both economic and social and environmental metrics,
557
this perhaps reflects consumer pressure to demonstrate strong sustainability
558
credentials in this sector. In the Mining, Oil and Gas and Natural Stone sector all
559
companies report a high number of social and environmental metrics, however three
560
slip into the High – Low quartile by reporting on only two economic metrics. In the
561
Food, Beverage, and Tobacco industry sector companies paid attention on the social
562
and environmental aspects, probably due to the nature of business, but nearly half of
563
the companies disclose fewer economic measurements from the perspective of the
564
academic literature. The picture is more mixed in both the Chemical, Medical and
565
Pharmaceutical sector and the Aerospace, Building Materials, Automotive,
566
Technology, Plastics and Engineering sector. This probably reflects the highly diverse
567
nature of the companies within these two sectors.
568 569
It is heartening to note that majority of metrics identified in the academic literature
570
are used by at least some companies within the authors’ sample. In all sectors the
571
majority of companies report against a wide range of social and environmental
572
metrics suggesting that companies see the benefit of reporting on these or are obliged
573
to do so for regulatory reasons. The Consumer Goods sector with all companies in the
574
High – High quartile could be said to be most closely following the triple bottom line
575
approach reporting extensively on all three perspectives.
576 577
The classification into the quartiles outlined above presents to both practitioners and
578
academics a simple method for identifying the balance struck by firms in reconciling
579
the trade offs between economic and social and environmental aspects of their
580
decision-making.
581
582
583
584
586
587
Table 5: A Comparison of Measurements Employed Industry Reports and in
589
Academic Literature
590
591 592
Industry Code of companies
Economic Environmental Social
E1 E2 E3 E4 E
N 1
E N 2
E N 3
E N 4
E N 5
E N 6
S1 S2 S3 S4 S5 S6 S7
Aerospace, Building materials, Automotive, Technology,
Plastic, Engineering
A1 1 1 1 1 1 1 1 1 1 1 0 1 1 1 1 0 1
A2 1 1 0 1 1 1 1 1 1 1 0 1 1 1 0 0 1
A3 1 1 1 1 1 0 1 1 1 1 0 1 1 1 0 1 1
A4 1 1 0 0 1 1 0 0 1 0 0 1 1 1 1 0 1
A5 1 1 0 0 1 1 1 1 1 1 0 1 1 1 0 0 1
A6 1 1 1 0 1 1 1 1 1 1 0 1 1 1 1 0 1
A7 1 1 0 0 1 1 1 1 1 1 0 1 1 1 1 0 1
A8 1 1 0 0 1 0 1 0 0 0 0 1 1 1 1 0 1
A9 1 1 0 0 1 1 1 1 0 0 0 1 0 1 0 0 1
A10 1 1 1 0 1 1 1 1 1 0 0 1 1 1 1 0 1
A11 1 1 1 0 1 1 1 1 1 1 1 1 1 1 1 1 1
A12 1 1 1 0 1 1 1 1 1 1 0 1 1 1 1 0 1
A13 1 1 1 1 1 1 1 1 1 1 0 1 1 1 1 0 1
A14 1 1 1 0 1 1 1 1 1 0 0 1 1 1 1 0 1
Food, Beverage,
Tobacco
F1 1 1 0 0 1 1 1 0 1 0 1 1 1 1 1 0 1
F2 1 1 0 0 1 1 1 1 1 0 0 1 1 1 1 1 1
F3 1 1 1 1 1 1 1 1 1 0 0 1 1 1 1 0 1
F4 1 1 1 1 1 1 1 1 1 1 0 1 1 1 1 0 1
F5 1 1 0 0 1 1 1 1 1 1 0 1 1 1 1 0 1
F6 1 1 1 1 1 1 1 1 0 1 0 1 1 1 1 1 1
F7 1 1 0 0 1 1 1 1 1 0 0 1 1 1 1 0 1
F8 1 1 0 1 1 1 1 0 0 1 0 1 1 1 1 0 1
F9 1 1 1 1 1 1 1 1 1 1 0 1 1 1 1 1 1
F10 1 1 1 0 1 1 1 1 1 1 0 1 1 1 1 1 1
Chemical, Medicine, Pharmacy
CH1 1 1 1 0 1 1 1 1 1 1 1 1 1 1 1 0 1
CH2 1 1 1 1 1 1 1 1 1 1 0 1 1 1 0 1 1
CH3 1 1 1 1 1 0 1 0 1 0 0 1 1 1 1 0 1
CH4 1 1 0 0 1 0 1 0 0 1 1 1 1 1 0 1 1
CH5 1 1 1 0 1 1 1 0 1 1 0 1 1 1 1 0 1
CH6 1 1 1 1 1 1 0 0 0 0 0 1 1 1 1 0 1
CH7 1 1 0 0 1 1 0 0 0 0 0 1 0 1 1 0 0
CH8 1 1 0 1 1 1 1 1 1 1 0 1 1 1 1 0 1
CH9 1 1 1 0 1 1 1 1 1 1 0 1 1 1 1 0 1
Mining, Oil, Gas, Nature
Stone
M1 1 1 0 1 1 1 1 0 1 0 1 1 1 1 1 1 1
M2 1 1 1 1 1 1 1 1 1 0 1 1 1 1 1 1 1
M3 1 1 1 0 1 1 1 1 1 0 0 1 1 1 1 0 1
M4 1 1 0 0 1 1 1 1 1 0 0 1 1 1 0 0 1
M5 1 1 0 0 1 1 1 1 1 0 0 1 1 1 1 0 1
M6 1 1 0 1 1 1 1 1 1 0 0 1 1 1 1 0 1
M7 1 1 1 1 1 1 1 1 1 0 1 1 1 1 1 1 1
M8 1 1 1 0 1 1 1 1 1 0 1 1 1 1 1 1 1
M9 1 1 1 1 1 1 1 1 0 0 0 1 1 1 1 0 1
M10 1 1 0 0 1 1 1 1 1 0 0 1 1 1 1 0 1
M11 1 1 0 1 1 1 1 0 0 0 0 1 1 1 1 0 1
M12 1 1 1 1 1 1 1 1 1 0 1 1 1 1 1 1 1
M13 1 1 0 1 1 1 1 1 1 1 0 1 1 1 1 1 1
Consumer Goods
C1 1 1 1 1 1 1 0 1 1 1 1 1 1 1 1 1
C2 1 1 1 0 1 1 1 0 1 1 0 1 1 1 0 0 1
C3 1 1 1 1 1 1 1 1 1 1 0 1 1 1 1 0 1
593
Figure 4 Distribution of performance metrics employed by industries 594
595 596
4.
Conclusion and Future Research
597598
To conclude, this study has provided a critical review of the status of performance 599
metrics employed in business decision-making for sustainable supply chain 600
management. 601
Adopting a rigorous systematic review methodology (Pittaway et al., 2004), this study 602
started with 17416 articles as the baseline and they were filtered down to 1074 articles 603
within the supply chain literature. The 1074 articles were reviewed and further filtered 604
down to 74 articles that were analysed in depth. The review of these scientific papers 605
were triangulated with the annual reports of the Top 50 companies in the FTSE250. 606
This combined approach of theoretical and practical lens forms the basis of this 607
in-depth review. 608
609
The authors found, that notwithstanding the fact that many researchers have examined 610
social and environmental perspectives in supply chains, a gap still exist between the 611
desirability of sustainability results and its implementation in reality for improved 612
business decision making. This often occurs when the sustainable performance 613
metrics in theory and practice are unclear and lack applicable governance mechanism 614
providing a review of the existing knowledge to highlight the need for further 616
research in these areas. 617
618
In addition, the win-win paradigm assuming positive outcome as a result of adopting 619
sustainability practices was questioned. Consistent with the views of many 620
researchers, work has been done to understand the integration of the triple 621
perspectives, but little research can be found examining the interrelationship between 622
the triple perspectives. The authors propose future research to develop innovative 623
metrics that encourage cooperative relationships, instead of competitive relationships, 624
and to rethink traditional accounting methods and thus improve the sustainability over 625
the whole value chain. 626
627
Future research should not only consider the three perspectives in isolation, but 628
consider the interrelationship between the perspectives to provide a better 629
understanding of a balanced decision-making process in order to achieve a win-win 630
outcome or optimised trade-off choice between Triple Bottom Line (TBL) 631
sustainability factors, particularly under different corporate governance mechanism. 632
Given varied formal institutional level governance mechanisms such as legal and 633
political system and ownership structures, and informal institutional level governance 634
mechanisms, such as cultural beliefs and norms, board structure, board demography, 635
board social capital, and individual factors, such as CEO age, gender, qualification, 636
experience, and political ideology the modelling of these will be complex but if 637
References
639 640
Abdul, Z. and Ibrahim, S., 2002. Executive and management attitudes towards 641
corporate social responsibility in Malaysia. Corporate Governance: The 642
International Journal of Business in Society, 2(4), pp.10-16. 643
http://dx.doi.org/10.1108/14720700210447641. 644
Adhitya, A., Halim, I. and Srinivasan, R. 2011. Decision support for green supply 645
chain operations by integrating dynamic simulation and LCA indicators: 646
Diaper case study". Environmental Science and Technology, 45 (23), 647
pp.10178-10185. http://dx.doi.org/10.1021/es201763q. 648
Awudu, I. and Zhang, J.2012. Uncertainties and sustainability concepts in biofuel 649
supply chain management: A review. Renewable and Sustainable Energy 650
Reviews, 16 (2), pp.1359-1368. http://dx.doi.org/10.1016/j.rser.2011.10.016. 651
Bai, C. G. and Sarkis, J. 2014. Determining and applying sustainable supplier key 652
performance indicators. Supply Chain Management-an International Journal, 653
19 (3), pp.275-291. http://dx.doi.org/10.1108/Scm-12-2013-0441. 654
Bai, C., Sarkis, J., Wei, X. and Koh, L. 2012. Evaluating ecological sustainable 655
performance measures for supply chain management. Supply Chain 656
Management: An International Journal, 17 (1), pp.78-92. 657
http://dx.doi.org/10.1108/13598541211212221. 658
Bear, S., Rahman, N. and Post, C., 2010. The impact of board diversity and gender 659
composition on corporate social responsibility and firm reputation. Journal of 660
Business Ethics, 97(2), pp.207-221.
661
http://dx.doi.org/10.1007/s10551-010-0505-2. 662
Campbell, J.L., 2007. Why would corporations behave in socially responsible ways? 663
An institutional theory of corporate social responsibility. Academy of 664
Management Review, 32(3), pp.946-967.
665
http://dx.doi.org/10.5465/AMR.2007.25275684. 666
Carroll, A. B. 1979. A three-dimensional conceptual model of corporate performance. 667
Academy of Management Review, 4(4), pp. 497-505. http://dx.doi.org/ 668
10.5465/AMR.1979.4498296. 669
Chaabane, A., Ramudhin, A. and Paquet, M. 2012. Design of sustainable supply 670
chains under the emission trading scheme. International Journal of Production 671
Economics, 135(1), pp.37-49. http://dx.doi.org/10.1016/j.ijpe.2010.10.025. 672
Chen, R. H., Lin, Y. H. and Tseng, M. L. 2015. Multicriteria analysis of sustainable 673
development indicators in the construction minerals industry in China. 674
Resources Policy, 46, pp.123-133.
675
http://dx.doi.org/10.1016/j.resourpol.2014.10.012. 676
Chin, M.K., Hambrick, D.C. and Treviño, L.K., 2013. Political ideologies of CEOs 677
the influence of executives’ values on corporate social responsibility. 678
Administrative Science Quarterly, 58(2), pp.197-232. 679
Choi, J., and Wang, H. 2009. Stakeholder relations and the persistence of corporate 681
financial performance. Strategic Management Journal, 30(8), pp. 895-907. 682
http://dx.doi.org/10.1002/smj.759. 683
Choudhary, A., Sarkar, S., Settur, S. and Tiwari, M. K. 2015. A carbon market 684
sensitive optimization model for integrated forward-reverse logistics. 685
International Journal of Production Economics, 164, pp.433-444. 686
http://dx.doi.org/10.1016/j.ijpe.2014.08.015. 687
Cucchiella, F. and D'Adamo, I. 2013. Issue on supply chain of renewable energy". 688
Energy Conversion and Management, 76, pp.774-780. 689
http://dx.doi.org/10.1016/j.enconman.2013.07.081. 690
Daily, C.M., Dalton, D.R. and Cannella, A.A., 2003. Corporate governance: Decades 691
of dialogue and data. Academy of management review, 28(3), pp.371-382. 692
http://dx.doi.org/10.5465/AMR.2003.10196703. 693
David, R.J. and Han, S.K., 2004. A systematic assessment of the empirical support for 694
transaction cost economics. Strategic management journal, 25(1), pp.39-58. 695
http://dx.doi.org/10.1002/smj.359. 696
Dekkers, R., Chang, C.M., and Kreutzfeldt, J., 2013. The interface between product 697
design and engineering and manufacturing: A review of the literature and 698
empirical evidence. International Journal of Production Economics, 144, pp. 699
316-333. http://dx.doi.org/10.1016/j.ijpe.2013.02.020. 700
Denyer, D. and Neely, A. 2004. Introduction to special issue: Innovation and 701
productivity performance in the UK. International Journal of Management 702
Reviews, 5, pp.131-135. http://dx.doi.org/10.1111/j.1460-8545.2004.00100.x. 703
Diamond, J.M., 1998. Guns, germs, and steel: A short history of everybody for the last 704
13,000 years. Random House. 705
Eccles, R. G., Ioannou, I., and Serafeim, G. 2014. The impact of corporate 706
sustainability on organizational processes and performance. Management 707
Science, 60(11), pp. 2835-2857. http://dx.doi.org/10.1287/mnsc.2014.1984. 708
Elghali, L., Clift, R., Sinclair, P., Panoutsou, C. and Bauen, A. 2007. Developing a 709
sustainability framework for the assessment of bioenergy systems. Energy 710
Policy, 35(12), pp.6075-6083. http://dx.doi.org/10.1016/j.enpol.2007.08.036. 711
Elkington, J., 1997. Cannibals with forks. The triple bottom line of 21st century. 712
Erol, I., Sencer, S. and Sari, R. 2011. A new fuzzy multi-criteria framework for 713
measuring sustainability performance of a supply chain". Ecological 714
Economics, 70(6), pp.1088-1100.
715
http://dx.doi.org/10.1016/j.ecolecon.2011.01.001. 716
Faruk, A. C., Lamming, R. C., Cousins, P. D. and Bowen, F. E. 2001. Analyzing, 717
Mapping, and Managing Environmental Impacts along Supply Chains. Journal 718
of Industrial Ecology, 5(2), pp.13-36,
719
http://dx.doi.org/10.1162/10881980152830114 720
Fichtinger, J., Ries, J. M., Grosse, E. H. and Baker, P. 2015. Assessing the 721
International Journal of Production Economics, 170, pp.717-729. 723
http://dx.doi.org/10.1016/j.ijpe.2015.06.025. 724
Fogliatto, F.S., Da Silveira, G.J.C.,and Borenstein, D., 2012. The mass customization 725
decade: an updated review of the literature. International Journal of Production 726
Economics 138, pp. 14-25. http://dx.doi.org/10.1016/j.ijpe.2012.03.002. 727
Frooman, J. (1997). Socially irresponsible and illegal behavior and shareholder wealth 728
a meta-analysis of event studies. Business & Society, 36(3), pp. 221-249. 729
http://dx.doi.org/10.1177/000765039703600302. 730
Gadema, Z. and Oglethorpe, D. 2011. The use and usefulness of carbon labelling food: 731
A policy perspective from a survey of UK supermarket shoppers. Food Policy, 732
36, pp.815-822. http://dx.doi.org/10.1016/j.foodpol.2011.08.001. 733
Gillan, S. L. 2006. Recent Developments in Corporate Governance: An Overview. 734
Journal of Corporate Finance, 12, pp.381-402. 735
http://dx.doi.org/10.1016/j.jcorpfin.2005.11.002 736
Gimenez, C. and Tachizawa, E. M. 2012. Extending sustainability to suppliers: A 737
systematic literature review. Supply Chain Management-An International 738
Journal, 17, pp.531-543. http://dx.doi.org/10.1108/13598541211258591. 739
Godos-Díez, J.L., Fernández-Gago, R. and Martínez-Campillo, A., 2011. How 740
important are CEOs to CSR practices? An analysis of the mediating effect of 741
the perceived role of ethics and social responsibility. Journal of Business 742
Ethics, 98(4), pp.531-548. http://dx.doi.org/10.1007/s10551-010-0609-8. 743
Gosling, J. and Naim, M.M., (2009). “Engineer-to-order supply chain management: A 744
literature review and research agenda”. International Journal of Production 745
Economics, No. 122(2), pp.741-754.
746
http://dx.doi.org/10.1016/j.ijpe.2009.07.002 747
Hacklin, F. and Wallnöfer, M. 2012. The business model in the practice of strategic 748
decision making: insights from a case study. Management Decision, 50,
749
pp.166-188. http://dx.doi.org/10.1108/00251741211203515. 750
Harms, D., Hansen, E. G. and Schaltegger, S. 2013. Strategies in sustainable supply 751
chain management: An empirical investigation of large german companies. 752
Corporate Social Responsibility and Environmental Management, 20, 753
pp.205-218. http://dx.doi.org/10.1002/csr.1293. 754
Hassini, E., Surti, C. and Searcy, C. 2012. A literature review and a case study of 755
sustainable supply chains with a focus on metrics. International Journal of 756
Production Economics, 140, pp.69-82.
757
http://dx.doi.org/10.1016/j.ijpe.2012.01.042 758
Heckman, J.J., 1979. Sample selection bias as a specification error. Econometrica, 759
47(1), pp. http://dx.doi.org/10.3386/w0172. 760
Hervani, A., A., Helms, M., M. and Sarkis, J. 2005. Performance measurement for 761
green supply chain management. Benchmarking: An International Journal, 12, 762
pp.330-353. http://dx.doi.org/10.1108/14635770510609015 763