-51-05-EN-C
S
K
Price (excluding VAT) in Luxembourg: EUR 10
2
0
0
6
E
D
IT
IO
N
P
O
C
K
E
T
B
O
O
K
S
THEME Science and technology
E U R O P E A N
COMMISSION
Science
and
technology
in Europe
ISBN 92-894-8798-4
ISSN 1725-5821
EN
KS-EA-06-001-EN-C
Science and technology in Europe
— Data 1990-2004
t
at
s
or
u
e
C
M
Y
CM
MY
CY
CMY
K
Data 1990-2004
Data 1990-2004
9 789289 487986
Science
and
Eurostat publications cover nine themes:
General and regional statistics Economy and finance Population and social conditions Industry, trade and services Agriculture and fisheries
External trade Transport
Environment and energy Science and technology
Press releases: key figures on the EU, the Member States and their partners.
They are provided free of charge. They are also available on the Internet as soon as they are published.
Statistics in focus: up-to-date summaries of the main results of statistical
sur-veys, studies and analyses.
Pocketbooks:the main indicators on a theme or sub-theme in an easy-to-carry
booklet.
Panorama of the European Union: highlights the features and trends of
a multisectoral theme or a sectoral sub-theme.
Methods and nomenclatures: intended for specialists who want to
con-sult the methodologies and nomenclatures used for a theme, a sub-theme or a sector.
Detailed tables: statistical data for specialists compiled on a theme,
sub-theme or sector.
Catalogues: rapid access to concise information on Eurostat´s products and
ser-vices.
throughout the world.
You can find the list of sales agents on the Publications Office website (http://publications.eu.int) or you can apply for it by fax (352) 29 29-42758.
D a t a 1 9 9 0 - 2 0 0 4
E U R O P E A N COMMISSION
agricultural 1995 2004 WEB.indd 1 17-01-2006 10:41:18
2
0
0
6
E
D
THEME Science and technology
Science
and
Our website is updated daily. Visit it today and get:
•
direct and free access to all Eurostat PDF publications;
•
direct and free access to our databases;
•
alert me — customisable e-mail alerts;
•
specialised access to short-term economic data;
•
complete information on all Eurostat products and services.
European Statistical Data Support
Eurostat has set up with the members of the ‘European statistical system’
a network of support centres which will exist in nearly all Member States
as well as in some EFTA countries. Their mission is to provide help and
guidance to Internet users of European statistical data.
Contact details for this support network can be found on our Internet
site.
Media Support Eurostat
Journalists can contact the media support service:
Tel. (352) 4301-33408
Fax (352) 4301-35349
E-mail: [email protected]
Health_WEB.indd 2 16-12-2005 18:33:55
A great deal of additional information on the European Union is available on the Internet.
It can be accessed through the Europa server (http://europa.eu.int).
Cataloguing data can be found at the end of this publication.
ISBN 92-894-8798-4 ISSN 1725-5821
Printed in Belgium
PRINTED ON WHITE CHLORINE-FREE PAPER
Europe Direct is a service to help you find answers to your questions about the European Union
Freephone number (*):
00 800 6 7 8 9 10 11
(*) Certain mobile telephone operators do not allow access to 00 800 numbers or these calls may be billed.
Luxembourg: Office for Official Publications of the European Communities, 2006
Eurostat is the Statistical Office of the European Communities. Its
task is to gather and analyse figures from the different European
statistical offices in order to provide comparable and harmonised
data for the European Union to use in the definition,
implementation and analysis of Community policies. Its statistical
products and services are also of great value to Europe’s business
community, professional organisations, academics, librarians, NGOs,
the media and citizens.
To ensure that the vast quantity of accessible data is made widely
available and to help each user make proper use of the information,
Eurostat has set up a publications and services programme.
This programme makes a clear distinction between general and
specialist users and particular collections have been developed for
these different groups. The collections
Press releases
,
Statistics in
focus
,
Panorama of the European Union
,
Pocketbooks
and
Catalogues
are aimed at general users. They give immediate key
information through analyses, tables, graphs and maps.
The collections
Detailed tables
and
Methods and nomenclatures
suit
the needs of the specialist who is prepared to spend more time
analysing and using very detailed information and tables.
As part of the new dissemination policy, Eurostat has developed its
website. All Eurostat publications are downloadable free of charge
in PDF format from the website. Furthermore, Eurostat’s databases
are freely available there, as are tables with the most frequently
used and demanded short- and long-term indicators.
Eurostat has set up with the members of the ‘European statistical
system’ a network of support centres which will exist in nearly all
Member States as well as in some EFTA countries. Their mission is to
provide help and guidance to Internet users of European statistical
data. Contact details for this support network can be found on our
Internet site.
TABLE
OF
TABLE
OF
R&D_PB2005.qxp
20/12/2005
15:45
Page
TABLE
OF
CONTENTS
TABLE
OF
CONTENTS
II
Introduction . . . .V
Acknowledgments . . . .VI
1. R&D Expenditure . . . .2
2. R&D Personnel . . . .22
3. Science and Technology in Regions . . . .36
4. GBAORD . . . .46
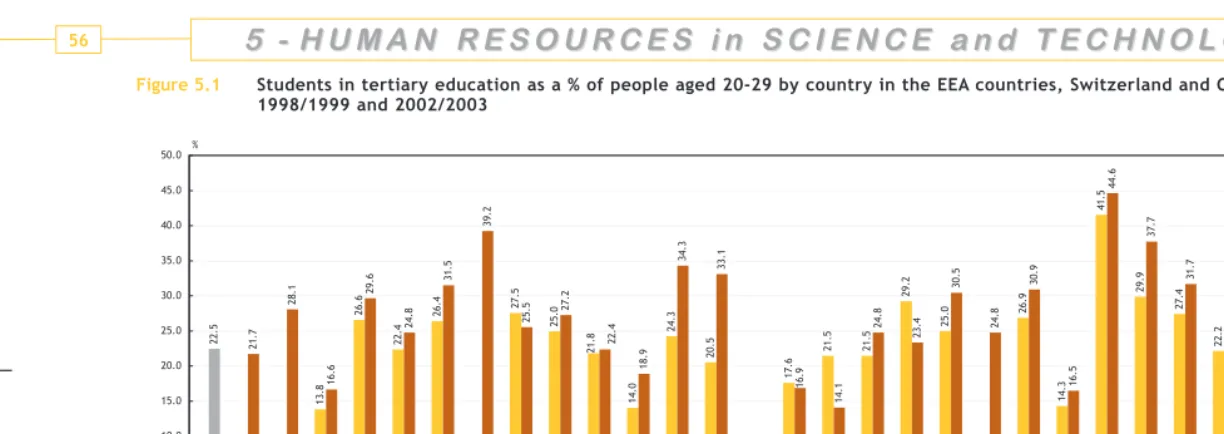
5. Human Ressources in Science and Technology . . . .54
6. Innovation . . . .74
7. Patents . . . .80
8. High-Technology . . . .92
9. Background Data . . . .105
Methodological information . . . .109
Abbreviations and symbols . . . .120
R&D_PB2005.qxp
20/12/2005
15:45
Page
III
TABLE
DES
MATIÈRES
TABLE
DES
MATIÈRES
Introduction . . . .V
Remerciements . . . .VI
1. Dépenses de R&D . . . .2
2. Personnel de R&D . . . .22
3. Science et Technologie dans les Régions . . . .36
4. CBPRD . . . .46
5. Ressources humaines en Science et Technologie . . .54
6. Innovation . . . .74
7. Brevets . . . .80
8. Haute Technologie . . . .92
9. Données de référence . . . .105
Informations méthodologiques . . . .109
Abréviations et symboles . . . .120
R&D_PB2005.qxp
20/12/2005
15:45
Page
INHALT
INHALT
IV
Einführung . . . .V
Beiträge . . . .VI
1. FuE-Ausgaben . . . .2
2. FuE-Personal . . . .22
3. Wissenschaft und Technik in den Regionen . . . .36
4. Staatliche Mittelzuweisungen für FuE - GBAORD . . .46
5. Humanressourcen in Wissenschaft und Technik . . . .54
6. Innovation . . . .74
7. Patente . . . .80
8. Hochtechnologie . . . .92
9. Hintergrunddaten . . . .105
Angaben zur Methodik . . . .109
Abkürzungen und Symbole . . . .120
R&D_PB2005.qxp
20/12/2005
15:45
Page
V
INTRODUCTION
INTRODUCTION
science, technology, innovation and regions). It provides the reader with statistical information to appreciate the evolution and composition of science and technology (S&T) in Europe and its position with regard to its partners.
Responding to developments in the policy and scientific communities, Eurostat has now been long collecting S&T data. This publication may be viewed as a compendium of data available within Eurostat. However, it is by no means an exhaustive collection, rather it can be seen as a showcase for the main data sets that currently exist. Although most data in this publication originate from Eurostat, other databases relevant in the S&T field have also been exploited. This is the case of the OECD's Main Science and Technology Indicators (MSTI). The particular source of each indicator is specified for each table or graph.
The data focus is on the 25 European Union Member States and the Candidate Countries. However, so as to allow for international comparisons, data for Iceland, Liechtenstein, Norway, Switzerland, China, Japan and the United States are also considered when available.
This pocketbook is divided into nine chapters. The first four chapters present key R&D input and output indicators. R&D inputs are measured in terms of R&D expenditure (chapter 1), R&D personnel (chapter 2) and Government budget appropriations or outlays on R&D (or GBAORD, in chapter 4), whereas outputs are analyzed by means of statistics on patents (chapter 7) and high technology (chapter 8). Chapter three presents a brief regional overview of S&T, looking at the top European regions and at the best performing region of each country. Chapter 5 looks at the composition and evolution of human resources in S&T fields (HRST). Chapter 6 presents the main results of the Community Innovation Statistics 2002/2003. Finally, chapter 9 gives some general statistics concerning population, gross domestic product (GDP) and employment.
The last part of the pocketbook contains methodological notes (including definitions and abbreviations) for each of the statistical data sources used.
NOTICE TO THE READER:
Tables and figures in this publication refer to the data on the Eurostat's database NewCronos at the time of writing (December 2005) except for the chapter on the background data (used to calculate derived indicators) for which the release date is August 2005. However, because NewCronos is regularly updated as and when new data are received, the data extractions made could subsequently differ from those available at the time of publishing.
R&D_PB2005.qxp
20/12/2005
15:45
Page
ACKNOWLEDGMENTS
ACKNOWLEDGMENTS
VI
SCIENCE AND TECHNOLOGY IN EUROPE
STATISTICAL POCKETBOOK
This publication has been managed and prepared by Eurostat, Unit F4 — Education, Science and Culture Statistics — headed by Jean-Louis Mercy.
Co-ordinators
August Götzfried — [email protected], Bernard Félix — [email protected], Simona Frank — [email protected], Håkan Wilén — [email protected]
Eurostat, Unit F4— Education, Science and Culture Statistics Statistical Office of the European Communities,
Joseph Bech Building, Alphonse Weicker, 5 L-2721, Luxembourg.
Production
Data processing, analysis, design and desktop publishing: Sogeti
Gesina Dierickx, Detlef Herrmann, Céline Lagrost, Sammy Sioen, Christophe Zerr.
Published by
Office for Official Publications of the European Communities, Luxembourg, 2006
© European Communities, 2006
R&D_PB2005.qxp
20/12/2005
15:45
Page
1 - R & D
3
1 - R & D E X P E N D I T U R E
1 - R & D E X P E N D I T U R E
The EU goals in Research and Development, as set by the Lisbon summit strategy, are to achieve by 2010 a R&D intensity of at least 3% for the EU, and to have two thirds of R&D expenditure financed by the business enterprise sector (BES).
In 2004 (preliminary data), R&D intensity (i.e. R&D expenditure as a percentage of GDP) in the EU-25 stood at 1.90 compared to 1.92 in 2003. R&D intensity remained significantly lower in the EU-25 than in other major economies. In 2003, R&D expenditure was 2.59% of GDP in the United States, 3.15% in Japan, while it was 1.31% in China. Only Japan and China increased their R&D expenditure in proportion of GDP between 1999 and 2003 whereas it remained quite stable in the EU-25 and decreased in the United States.
The EU-25 average hides discrepancies between Member States. Indeed, in 2004 three countries already exceeded the EU's 2010 goal set by the Lisbon summit to achieve a R&D intensity of 3% of GDP. These countries were Sweden (3.74%), Finland (3.51%) and Iceland (3.01%).
In 2004, 195 billion EUR were devoted to R&D in the EU-25. As a world wide comparison, the Japan's R&D expenditure was about 120 billion in 2003 whereas it reached 252 billion in the United States and 16 billion in China.
The trends for the EU-25, the United States and Japan R&D expenditure, expressed in purchase power standards (PPS), was positive for all three of them. In 2003, 54.3% of the EU-25 R&D expenditure was financed by the business enterprise sector, almost 35% by the government sector (GOV) and less than 10% by abroad. These proportions remain stable compared to the previous year. At the national level, only two EU-25 Member States fulfilled the second EU's 2010 Lisbon goal for R&D to get financed two third of the R&D expenditure by the BES: these countries were Luxembourg and Finland with R&D financing shares by the BES of 80.4% and 70.0% respectively.
In the majority of the EU-15 countries, large enterprises of more than 250 employees accounted for more than 60% of R&D expenditure in the business enterprise sec-tor. In a few smaller countries such as Cyprus, Latvia and Malta small enterprises of less than 50 employees accounted for more than 30% of business enterprise expenditure.
1 - R & D E X P E N D I T U R E
1 - R & D E X P E N D I T U R E
Table 1.1 R&D intensity (R&D expenditure as a % of GDP) and percentage of R&D expenditure financed by the Business Enterprise Sector (%) in the EEA countries, Candidate Countries, Switzerland, China, Japan, the Russian Federation and the United States — 1999 to 2004
4 0 0 2 3 0 0 2 2 0 0 2 1 0 0 2 0 0 0 2 9 9 9 1 4 0 0 2 3 0 0 2 2 0 0 2 1 0 0 2 0 0 0 2 9 9 9 1 : s 3 . 4 5 s 0 . 5 5 s 3 . 5 5 s 2 . 5 5 : p s 0 9 . 1 s 2 9 . 1 s 3 9 . 1 s 3 9 . 1 s 9 8 . 1 s 7 8 . 1 5 2 -U E : s 6 . 4 5 s 3 . 5 5 s 6 . 5 5 s 5 . 5 5 : p s 5 9 . 1 s 7 9 . 1 s 8 9 . 1 s 8 9 . 1 s 4 9 . 1 s 2 9 . 1 5 1 -U E : 3 . 0 6 4 . 9 5 3 . 4 6 0 . 3 6 2 . 6 6 f 3 9 . 1 2 9 . 1 9 9 . 1 7 1 . 2 4 0 . 2 6 9 . 1 E B : 4 . 1 5 7 . 3 5 5 . 2 5 2 . 1 5 6 . 2 5 8 2 . 1 6 2 . 1 2 2 . 1 2 2 . 1 3 2 . 1 6 1 . 1 Z C : 3 . 1 6 : 4 . 1 6 : 0 . 9 5 p 3 6 . 2 r 9 5 . 2 r 5 5 . 2 0 4 . 2 7 2 . 2 0 1 . 2 K D e 1 . 7 6 3 . 6 6 5 . 5 6 7 . 5 6 0 . 6 6 4 . 5 6 e 9 4 . 2 2 5 . 2 9 4 . 2 6 4 . 2 5 4 . 2 0 4 . 2 E D : 0 . 3 3 2 . 9 2 9 . 2 3 2 . 4 2 2 . 4 2 p 1 9 . 0 2 8 . 0 5 7 . 0 3 7 . 0 2 6 . 0 0 7 . 0 E E
EL 0.67 : 0.64 : 0.62p 0.58p 24.2 : 33.0 : 30.7 :
: 4 . 8 4 9 . 8 4 : : : 7 0 . 1 5 0 . 1 9 9 . 0 2 9 . 0 1 9 . 0 8 8 . 0 S E
FR 2.16 2.15b 2.20 2.23 2.18 2.16p 54.1 52.5b 54.2 52.1 50.8 : : 1 . 9 5 4 . 3 6 : 0 . 6 6 4 . 4 6 r 0 2 . 1 r 6 1 . 1 r 0 1 . 1 2 1 . 1 3 1 . 1 8 1 . 1 E I
IT 1.04 1.07 1.11 1.16 1.14 : : : : : : :
: 8 . 9 1 4 . 7 1 3 . 5 1 5 . 7 1 4 . 7 1 p 7 3 . 0 5 3 . 0 1 3 . 0 6 2 . 0 5 2 . 0 4 2 . 0 Y C : 2 . 3 3 7 . 1 2 3 . 8 1 4 . 9 2 2 . 2 2 2 4 . 0 8 3 . 0 2 4 . 0 1 4 . 0 5 4 . 0 7 3 . 0 V L
LT 0.51 0.59 0.68 0.67 0.68 0.76 : 31.6 37.1 27.9 16.7 :
: p 4 . 0 8 : : 7 . 0 9 : : 8 7 . 1 : : 1 7 . 1 : U L : 7 . 0 3 7 . 9 2 8 . 4 3 8 . 7 3 5 . 8 3 9 8 . 0 5 9 . 0 2 0 . 1 5 9 . 0 0 8 . 0 9 6 . 0 U H
MT : : : 0. 82 0.27 0. 92u : : : 18.6 : :
L
N 2. 20 1 0.9 1 8.1 1.72 1 6.7 1.77p 49.7 51.3 5 91. 50.0 50.9 :
AT 1.88 1 91. 2.04 2 1. 2 2 1. 9 e 2. 62e 41.1 41.8 4 81. 4 64. 43.9e 43.4e S E B e h t y b d e c n a n i f e r u t i d n e p x e D & R f o % P D G f o % s a e r u t i d n e p x e D & R
Sources: Eurostat-R&D statistics, OECD - MSTI 2005-1
5 4 0 0 2 3 0 0 2 2 0 0 2 1 0 0 2 0 0 0 2 9 9 9 1 4 0 0 2 3 0 0 2 2 0 0 2 1 0 0 2 0 0 0 2 9 9 9 1 : 3 . 0 3 1 . 0 3 8 . 0 3 6 . 2 3 1 . 8 3 8 5 . 0 6 5 . 0 8 5 . 0 4 6 . 0 6 6 . 0 0 7 . 0 L P
PT 0.72 : 0.85 0.80e 0.78 : 21.3 27.0 31.5 31.6 e 31.7 :
: e 3 . 9 5 0 . 0 6 7 . 4 5 3 . 3 5 9 . 6 5 e 1 6 . 1 e 4 5 . 1 3 5 . 1 6 5 . 1 4 4 . 1 2 4 . 1 I S
SK 0.66 0.65 0.64 0.58 0.58 0.53 49.9 54.4 56.1 53.6 45.1 :
: 0 . 0 7 5 . 9 6 : : : 1 5 . 3 8 4 . 3 3 4 . 3 8 3 . 3 8 3 . 3 1 2 . 3 I F : 0 . 5 6 : 9 . 1 7 : 8 . 7 6 4 7 . 3 8 9 . 3 : 7 2 . 4 : 5 6 . 3 E S : 9 . 3 4 1 . 6 4 : : : : 8 8 . 1 9 8 . 1 9 8 . 1 4 8 . 1 4 8 . 1 K U : 9 . 3 4 : 2 . 6 4 : 4 . 3 4 1 0 . 3 7 9 . 2 f 4 1 . 3 8 0 . 3 e 6 7 . 2 9 3 . 2 S I : 2 . 9 4 : 6 . 1 5 : 5 . 9 4 : 5 7 . 1 7 6 . 1 0 6 . 1 : 5 6 . 1 O N E
E A 1.87s 1.88s 1.92s 1.92s 1.92s 1.90sp : 55.2 s 55.2s 54.9 s 54.2s :
1 . 9 6 : : : : : 7 5 . 2 : H
C : : : :
: 8 . 6 2 8 . 4 2 1 . 7 2 4 . 4 2 b 8 . 2 2 1 5 . 0 0 5 . 0 9 4 . 0 7 4 . 0 2 5 . 0 7 5 . 0 G B
HR : : : 1.12 1.14 : : : : 45.7 42.1 :
: 4 . 5 4 6 . 1 4 6 . 7 4 0 . 9 4 2 . 0 5 0 4 . 0 0 4 . 0 8 3 . 0 9 3 . 0 7 3 . 0 0 4 . 0 O R
TR 0.63 0.64 0.72 0.66 : : 43.3 42.9 44.9 41.3 : :
: 1 . 0 6 : : b 6 . 7 5 : : 1 3 . 1 2 2 . 1 7 0 . 1 b 0 0 . 1 3 8 . 0 N C : 5 . 4 7 9 . 3 7 0 . 3 7 4 . 2 7 2 . 2 7 : 5 1 . 3 2 1 . 3 7 0 . 3 9 9 . 2 6 9 . 2 P J : 8 . 0 3 1 . 3 3 6 . 3 3 9 . 2 3 6 . 1 3 7 1 . 1 r 9 2 . 1 5 2 . 1 8 1 . 1 5 0 . 1 0 0 . 1 U R : p 1 . 3 6 p 4 . 4 6 3 . 7 6 3 . 9 6 9 . 6 6 : p 9 5 . 2 p 5 6 . 2 1 7 . 2 0 7 . 2 3 6 . 2 S U S E B e h t y b d e c n a n i f e r u t i d n e p x e D & R f o % P D G f o % s a e r u t i d n e p x e D & R
Sources: Eurostat-R&D statistics, OECD - MSTI 2005-1
1 - R & D E X P E N D I T U R E
1 - R & D E X P E N D I T U R E
1 - R & D E X P E N D I T U R E
Figure 1.1 R&D intensity (R&D expenditure as % percentage of GDP) in the EEA countries, Candidate Countries, Switzerland, China, Japan, the Russian Federation and the United States — 2004
3 0 0 2
0 9 . 1 1.95 1.93
8 2 . 1
3 6 . 2
9 4 . 2
1 9 . 0
8 5 . 0
7 0 . 1
6 1 . 2
0 2 . 1 1.14
7 3 . 0 0.42
6 7 . 0
8 7 . 1
9 8 . 0
9 2 . 0
7 7 . 1
6 2 . 2
8 5 . 0
8 7 . 0
1 6 . 1
3 5 . 0
1 5 . 3
4 7 . 3
8 8 . 1
1 0 . 3
5 7 . 1
0 9 . 1
7 5 . 2
1 5 . 0
4 1 . 1
0 4 . 0
6 6 . 0
1 3 . 1
5 1 . 3
7 1 . 1
9 5 . 2
0 . 0 5 . 0 0 . 1 5 . 1 0 . 2 5 . 2 0 . 3 5 . 3 0 . 4
S U U R P J N C R T O R R H G B H C A E E O N S I K U E S I F K S I S T P L P T A L N T M U H U L T L V L Y C T I E I R F S E L E E E E D K D Z C E B 5 1 -U E 5 2 -U E
%
Exceptions to the reference year: IT, LU, PT, UK, NO, HR, CN, JP and US 2003 ; CH 2000 and TR 2002.
Provisional data: EU-15, EU-25, EEA, DK, EE, EL, FR, CY, NL and US.
Forecast: BE.
Eurostat estimations: EU-15, EU-25 and EEA. National estimations: DE, AT, SI.
Revised data: IE.
Unreliable data: MT. Sources: Eurostat-R&D statistics, OECD - MSTI 2005-1
7
Figure 1.2 Percentage of R&D expenditure financed by the Business Enterprise Sector in the EEA countries, Candidate Countries, Switzerland, China, Japan, the Russian Federation and the United States — 2003
3 . 4 5 54.6
3 . 0 6
4 . 1 5
3 . 1 6
3 . 6 6
0 . 3 3
7 . 0 3
4 . 8 4 50.8
1 . 9 5
8 . 9 1
2 . 3 3
7 . 6 1
4 . 0 8
7 . 0 3
6 . 8 1
9 . 0 5
9 . 3 4
3 . 0 3 31.7
3 . 9 5
1 . 5 4
0 . 0 7
0 . 5 6
9 . 3 4 9 . 3 4
2 . 9 4
2 . 4 5
1 . 9 6
8 . 6 2
1 . 2 4
4 . 5 4
3 . 1 4
1 . 0 6
5 . 4 7
8 . 0 3
1 . 3 6
0 0 1
0 2
0 3
0 4
0 5
0 6
0 7
0 8
0 9
S U U R P J N C R T O R R H G B H C A E E O N S I K U E S I F K S I S T P L P T A L N T M U H U L T L V L Y C E I R F S E L E E E E D K D Z C E B 5 1 -U E 5 2 -U E %
Exceptions to the referrence year: MT and TR 2002 ; CH 2000. Provisional data: LU, US.
Eurostat estimations: EU-15, EU-25 and EEA. National estimations: AT, SI.
Sources: Eurostat-R&D statistics, OECD - MSTI 2005-1
1 - R & D E X P E N D I T U R E
1 - R & D E X P E N D I T U R E
1 - R & D E X P E N D I T U R E
Table 1.2 R&D expenditure in million current EUR and million PPS in the EEA countries, Candidate Countries, Switzerland, China, Japan, the Russian Federation and the United States — 1999 to 2004
4 0 0 2 3 0 0 2 2 0 0 2 1 0 0 2 0 0 0 2 9 9 9 1 4 0 0 2 3 0 0 2 2 0 0 2 1 0 0 2 0 0 0 2 9 9 9 1 p s 2 4 4 5 8 1 s 6 7 6 8 7 1 s 0 8 0 7 7 1 s 5 0 7 0 7 1 s 2 1 1 0 6 1 s 2 1 7 7 4 1 p s 0 5 6 4 9 1 s 2 2 2 8 8 1 s 9 4 3 6 8 1 s 9 2 6 9 7 1 s 8 1 4 9 6 1 s 9 0 9 6 5 1 5 2 -U E p s 4 0 4 8 7 1 s 7 6 1 2 7 1 s 7 7 6 0 7 1 s 3 6 4 4 6 1 s 7 5 2 4 5 1 s 0 2 3 2 4 1 p s 8 0 8 0 9 1 s 2 0 7 4 8 1 s 6 0 8 2 8 1 s 4 6 2 6 7 1 s 1 7 4 6 6 1 s 2 3 3 4 5 1 5 1 -U E f 9 2 3 5 4 1 0 5 6 8 0 5 4 5 3 5 4 1 8 4 6 9 2 4 f 5 6 4 5 7 7 1 5 1 0 2 5 5 1 5 5 6 4 0 5 8 1 6 4 E B 5 4 0 2 5 9 8 1 8 8 7 1 3 9 6 1 1 2 6 1 0 5 4 1 0 0 1 1 3 1 0 1 9 5 9 2 3 8 4 4 7 1 4 6 Z C p 7 7 8 3 r 5 4 6 3 r 8 2 5 3 1 2 3 3 3 3 0 3 2 3 6 2 p 2 1 1 5 r 1 5 8 4 r 4 3 6 4 5 6 2 4 2 9 8 3 6 0 4 3 K D e 3 3 3 0 5 2 5 8 8 4 6 6 0 8 4 7 9 4 6 4 3 5 3 5 4 8 7 9 1 4 e 0 0 1 5 5 8 3 5 4 5 3 6 3 3 5 2 0 0 2 5 9 1 6 0 5 1 9 1 8 4 E D p 1 4 1 7 1 1 0 0 1 2 9 4 7 4 7 p 3 8 7 6 6 5 9 4 7 3 7 3 E E
EL 795 : 841 : 951p 967p 977 : 1058 : 1183p 1184p
1 6 0 0 1 5 0 4 9 2 6 3 8 4 4 2 7 4 7 7 6 7 5 9 5 8 6 9 8 3 1 2 8 4 9 1 7 7 2 2 6 9 1 7 5 5 9 9 4 S E
FR 29529 30954b 32887 34527 34569 35648p 27820 29740b 31889 33119 32398 33294p r 5 3 5 1 r 9 4 3 1 r 7 3 2 1 5 6 1 1 1 9 0 1 4 1 0 1 r 0 8 7 1 r 0 1 6 1 r 5 3 4 1 5 1 3 1 3 8 1 1 8 6 0 1 E I
IT 11524 12460 13572 14600 14769 : 12450 13560 14462 15282 14936 : p 0 5 5 4 8 3 3 3 9 2 6 2 p 6 4 1 4 4 3 7 2 5 2 1 2 Y C 5 9 8 7 2 8 4 7 4 7 6 5 7 4 8 3 2 4 8 3 8 3 5 2 V L
LT 52 73 91 100 111 137 125 158 196 208 230 282
: 7 6 3 : : 4 2 3 : : 6 2 4 : : 4 6 3 : U L 4 3 2 1 0 4 2 1 0 9 2 1 4 1 1 1 3 6 8 4 8 6 1 2 7 3 9 6 6 0 7 8 4 5 5 0 4 9 0 3 U H
MT : : : 12 11 12u : : : 17 17 19u
p 7 8 0 8 1 3 7 7 7 1 5 7 1 8 6 7 9 7 2 7 4 4 1 7 p 7 5 6 8 6 7 3 8 8 1 0 8 0 9 0 8 5 5 6 7 3 6 5 7 L N e 1 5 0 5 e 3 5 6 4 6 3 4 4 7 6 1 4 5 7 8 3 4 3 5 3 e 6 4 3 5 e 5 7 9 4 4 8 6 4 3 9 3 4 9 2 0 4 2 6 7 3 T A R U E t n e r r u c o i M n i e r u t i d n e p x e D &
R R&DexpenditureinMioPPS
Sources: Eurostat-R&D statistics, OECD - MSTI 2005-1
9 4 0 0 2 3 0 0 2 2 0 0 2 1 0 0 2 0 0 0 2 9 9 9 1 4 0 0 2 3 0 0 2 2 0 0 2 1 0 0 2 0 0 0 2 9 9 9 1 8 3 3 2 9 9 0 2 9 3 1 2 3 9 2 2 7 1 3 2 9 9 2 2 9 3 1 1 6 3 0 1 2 7 1 1 3 2 3 1 7 9 1 1 6 8 0 1 L P
PT 815 : 1038 1029e 1020 : 1097 : 1377 1350e 1302 :
e 4 6 5 e 3 0 5 7 8 4 6 7 4 6 1 4 7 8 3 e 8 1 4 e 7 7 3 0 6 3 1 4 3 7 9 2 4 8 2 I S
SK 126 143 149 148 169 174 310 333 346 337 351 331
0 1 7 4 1 2 4 4 4 1 3 4 9 2 1 4 2 7 9 3 3 5 4 3 3 5 2 5 5 0 0 5 0 3 8 4 9 1 6 4 3 2 4 4 9 7 8 3 I F 2 5 7 8 3 8 7 8 : 1 4 0 9 : 5 9 0 7 6 2 4 0 1 2 4 6 0 1 : 9 5 4 0 1 : 8 0 6 8 E S : 2 3 6 8 2 5 4 0 8 2 8 1 3 6 2 9 8 3 4 2 6 2 6 2 2 : 2 9 0 0 3 5 1 5 1 3 4 5 2 0 3 7 8 7 8 2 1 0 3 5 2 K U 9 2 2 5 1 2 f 6 2 2 4 2 2 e 3 9 1 7 5 1 7 9 2 4 7 2 f 0 8 2 1 6 2 e 1 5 2 8 8 1 S I : 5 1 5 2 3 0 4 2 9 3 3 2 : 9 2 9 1 : 1 1 4 3 8 8 3 3 7 3 0 3 : 5 4 4 2 O N E
E A 159544s 172417s 182927s 190017s 191907s 198622sp 149800s 162480s 173268s 179708s 181406s 188546sp : : : : 7 4 9 4 : : : : : 2 5 8 6 : H C 6 6 2 9 4 2 5 3 2 6 1 2 6 2 2 7 2 2 9 9 9 8 1 8 1 7 1 7 9 6 G B
HR : : : 271 292 : : : : 462 494 :
4 1 6 3 5 5 1 0 5 2 8 4 4 1 4 0 3 4 5 3 2 3 0 2 4 8 1 7 7 1 9 4 1 4 3 1 O R
TR 1094 1389 1172 1280 : : 2230 2591 2658 2603 : :
: : : : : : : 4 4 4 6 1 2 5 4 6 1 3 6 0 4 1 b 4 1 7 1 1 5 9 6 7 N C : 7 0 1 8 9 7 1 7 4 9 4 6 3 1 9 8 8 8 6 8 9 0 1 1 8 : 8 4 7 9 1 1 6 2 7 1 3 1 5 1 0 3 4 1 0 6 8 3 5 1 9 0 9 3 2 1 P J : : : : : : 3 7 4 5 r 9 9 8 4 5 4 5 4 5 2 0 4 8 4 9 2 2 1 8 1 U R
US 228958 2 7 1318 3067 68 293041p 2 15577p : 21 33 45 2 4 83 40 2 14 4 06 2 54 308p 2 74745p : R U E t n e r r u c o i M n i e r u t i d n e p x e D &
R R&DexpenditureinMioPPS
Sources: Eurostat-R&D statistics, OECD - MSTI 2005-1
1 - R & D E X P E N D I T U R E
1 - R & D E X P E N D I T U R E
1 - R & D E X P E N D I T U R E
Figure 1.3 R&D intensity (R&D expenditure as a % of GDP) by sector of performance in the EU-25, China, Japan and the United states — 2003
2 8 . 0
2 4 .
0 0.43 0.43
6 3 . 2
9 7 . 1
3 2 . 1
3 2 . 0 9
2 . 0 5
2 . 0
6 3 . 0
0 . 0
5 . 0
0 . 1
5 . 1
0 . 2
5 . 2
S U n
a p a J a
n i h C 5
2 -U E %
S E
B GOV HES
Eurostat estimation: EU-25. Provisional data: US.
Sources: Eurostat-R&D statistics, OECD - MSTI 2005-1
10
#
11
Figure 1.4 Breakdown of R&D expenditure by sector of performance as a percentage of total in the EEA countries, Candidate Countries, Switzerland, China, Japan, the Russian Federation and the United states — 2004
% 0
% 0 1
% 0 2
% 0 3
% 0 4
% 0 5
% 0 6
% 0 7
% 0 8
% 0 9
% 0 0 1
S U U R P J N C R T O R R H G B H C A E E O N S I K U E S I F K S I S T P L P T A L N T M U H U L T L V L Y C T I E I R F S E L E E E E D K D Z C E B 5 1 -U E 5 2 -U E
S E
B GOV HES PNP
Exceptions to the reference year: IT, LU, PT, UK, NO, HR, CN, JP and US 2003 ; CH 2000 ; TR 2002
Provisional data: EU-15, EU-25, EEA, DK, EE, EL, FR, CY, NL and US.
Forecast: BE.
Eurostat estimations: EU-15, EU-25 and EEA. National estimations: DE, AT, SI.
Revised data: IE. Unreliable data: MT.
Sources: Eurostat-R&D statistics, OECD - MSTI 2005-1
1 - R & D E X P E N D I T U R E
1 - R & D E X P E N D I T U R E
1 - R & D E X P E N D I T U R E
Table 1.3 R&D expenditure in million current EUR, by sector of performance, in the EEA countries, Candidate Countries, Switzerland, China, Japan, the Russian Federation and the United States — 2001 to 2004
4 0 0 2 3 0 0 2 2 0 0 2 1 0 0 2 4 0 0 2 3 0 0 2 2 0 0 2 1 0 0 2 4 0 0 2 3 0 0 2 2 0 0 2 1 0 0 2 p s 7 7 5 2 4 s 1 5 1 1 4 s 6 6 3 0 4 s 5 9 5 7 3 p s 0 5 8 4 2 s 0 8 4 4 2 s 8 3 1 4 2 s 3 2 7 3 2 p s 2 7 1 5 2 1 s 1 8 5 0 2 1 s 1 5 9 9 1 1 s 6 6 0 7 1 1 5 2 -U E p s 1 2 6 1 4 s 4 7 2 0 4 s 2 6 4 9 3 s 9 3 7 6 3 p s 5 4 7 3 2 s 1 0 4 3 2 s 4 6 9 2 2 s 6 8 7 2 2 p s 8 1 4 3 2 1 s 9 3 0 9 1 1 s 5 0 5 8 1 1 s 0 1 5 5 1 1 5 1 -U E f 2 3 2 1 0 5 1 1 0 0 1 1 9 5 0 1 f 7 1 4 4 5 3 3 7 3 1 3 3 f 7 4 7 3 8 0 6 3 2 6 6 3 2 6 0 4 E B 2 6 1 5 5 1 0 5 1 0 3 1 3 3 2 6 3 2 0 2 2 7 9 1 1 0 7 8 1 6 6 8 5 1 0 5 Z C p 3 3 2 1 6 2 1 1 8 6 0 1 6 9 7 p 5 3 3 7 3 3 r 1 4 3 3 0 5 p 6 1 5 3 r 5 5 3 3 8 9 1 3 4 3 9 2 K D p 0 0 0 9 2 0 2 9 0 8 0 9 4 2 5 8 p 0 0 3 7 7 0 3 7 3 3 3 7 6 4 1 7 p 0 0 8 8 3 9 2 0 8 3 0 5 9 6 3 2 3 3 6 3 E D 8 3 2 3 7 2 5 2 1 1 1 1 9 7 p 2 3 3 2 7 1 6 1 E E
EL 278 : 286p 285p 188 : 198 203p 382 : 457 470p
2 4 6 2 2 9 4 2 2 4 1 2 5 2 9 1 6 2 4 1 2 6 2 1 8 0 1 1 9 8 9 8 8 8 4 3 4 4 4 6 2 9 3 1 6 2 3 S E
FR 20782 21839 21646 22409p 5432 5709 5767 5956p 6217 6512 6693 6823p 2 9 4 r 7 0 4 2 2 3 4 9 2 e 8 3 1 7 2 1 5 2 1 4 0 1 e 0 5 1 1 6 7 0 1 r 8 8 9 7 1 9 E I
IT 6870 7057 6979 7501p 2657 2565 2582 2337p 4418 4792 5000 : p 6 1 3 1 0 1 7 p 7 1 6 1 4 1 2 1 p 9 9 7 5 Y C 7 1 6 1 7 1 6 1 9 9 8 8 1 2 3 1 7 1 4 1 V L
LT 27 17 23 29 36 33 29 34 29 50 58 74
: u 2 : 2 : 5 4 8 3 3 3 : 9 7 3 : : U L 7 7 1 5 8 1 8 7 1 1 4 1 3 1 2 7 1 2 2 3 2 2 4 1 7 9 2 5 5 2 0 5 2 0 2 2 U H
MT : 3 4p 4u : 2 1 1 : 7 7 8
p 0 3 4 2 6 5 3 2 2 1 3 2 4 8 1 2 p 3 4 2 1 3 1 2 1 6 0 1 1 4 9 1 1 p 2 8 9 4 4 0 8 4 3 4 5 4 2 1 7 4 L N : : 6 6 2 1 : : : 6 6 2 : : : 1 3 1 3 : T A S E H n i e r u t i d n e p x e D & R V O G n i e r u t i d n e p x e D & R S E B n i e r u t i d n e p x e D & R
Sources: Eurostat-R&D statistics, OECD - MSTI 2005-1
13 4 0 0 2 3 0 0 2 2 0 0 2 1 0 0 2 4 0 0 2 3 0 0 2 2 0 0 2 1 0 0 2 4 0 0 2 3 0 0 2 2 0 0 2 1 0 0 2 4 6 3 9 2 3 8 9 3 3 3 4 4 4 4 1 2 4 3 3 5 4 1 4 7 2 3 4 8 2 8 3 2 4 7 4 L P
PT 330 334e 338 : 216 194e 172 : 381 386e 392 :
e 6 6 e 0 6 6 5 5 5 e 1 9 e 6 8 3 8 3 8 e 9 4 2 e 2 2 2 5 1 2 7 9 1 I S
SK 101 95 93 86 35 39 53 53 13 13 22 35
0 4 0 1 2 6 9 6 2 9 4 3 8 7 9 4 5 8 4 1 0 5 1 0 5 4 8 6 3 8 2 5 3 5 7 3 3 4 8 2 3 I F 3 9 3 2 4 4 3 2 : 3 3 0 2 5 2 3 1 7 3 : 7 9 2 7 6 6 7 6 8 8 7 : 8 1 1 8 E S e 0 0 7 6 2 4 4 6 3 2 0 7 8 8 4 6 3 4 0 3 r 6 0 9 2 6 8 7 2 1 4 9 2 : 8 7 7 9 1 9 4 8 0 2 2 9 3 0 2 K U 0 6 8 5 f 5 4 9 4 3 6 8 6 f 9 6 2 5 7 6 1 2 4 1 f 0 6 1 3 5 1 S I 3 8 9 7 3 9 7 0 9 0 8 7 4 1 5 5 1 5 5 3 5 4 4 4 : 0 6 9 1 6 4 9 1 4 1 8 1 O N E
E A 119034s 122057s 122683s 127519sp 24219s 24742s 25063s 25427sp 38424s 41318s 42146s 43620sp
: : 1 8 8 1 : : : 5 9 : : : : : H C 9 9 8 9 6 6 2 6 8 5 8 4 3 2 8 1 5 1 5 1 G B
HR : 115 114 : : 60 64 : : 95 114 :
4 2 9 1 9 2 0 2 0 8 5 6 4 4 8 4 0 3 1 8 1 1 1 1 1 9 0 1 O R
TR 395 367 : : 86 89 : : 690 823 : :
: 4 3 7 1 7 6 6 1 1 8 3 1 : 5 5 4 4 9 1 7 4 3 8 1 4 : 6 5 2 0 1 6 6 0 0 1 9 9 4 8 N C : 8 5 3 6 1 6 8 2 8 1 7 8 6 0 2 : 9 4 1 1 1 3 6 5 2 1 7 3 6 3 1 : 3 8 7 9 8 9 5 0 8 9 4 6 3 5 0 1 P J 9 9 2 7 9 2 7 4 2 0 1 2 3 8 3 1 9 3 2 1 2 1 1 1 8 7 9 0 8 7 3 3 5 3 3 6 7 1 3 9 2 8 2 U R : p 3 5 1 2 4 p 8 0 5 6 4 7 7 3 4 4 : p 1 6 7 2 2 p 1 6 8 5 2 2 1 1 4 2 : p 6 6 3 3 7 1 p 0 1 8 5 0 2 0 0 9 3 2 2 S U S E B n i e r u t i d n e p x e D &
R R&DexpenditureinGOV R&DexpenditureinHES
Sources: Eurostat-R&D statistics, OECD - MSTI 2005-1
1 - R & D E X P E N D I T U R E
1 - R & D E X P E N D I T U R E
1 - R & D E X P E N D I T U R E
Table 1.4 R&D intensity (R&D expenditure as a % of GDP) by sector of performance, in the EEA countries, Candidate Countries, Switzerland, China, Japan, the Russian Federation and the United States — 2001 to 2004
4 0 0 2 3 0 0 2 2 0 0 2 1 0 0 2 4 0 0 2 3 0 0 2 2 0 0 2 1 0 0 2 4 0 0 2 3 0 0 2 2 0 0 2 1 0 0 2 p s 1 4 . 0 s 2 4 . 0 s 2 4 . 0 s 0 4 . 0 p s 4 2 . 0 s 5 2 . 0 s 5 2 . 0 s 5 2 . 0 p s 2 2 . 1 s 3 2 . 1 s 4 2 . 1 s 6 2 . 1 5 2 -U E p s 3 4 . 0 s 3 4 . 0 s 3 4 . 0 s 1 4 . 0 p s 4 2 . 0 s 5 2 . 0 s 5 2 . 0 s 6 2 . 0 p s 6 2 . 1 s 7 2 . 1 s 8 2 . 1 s 0 3 . 1 5 1 -U E f 3 4 . 0 3 4 . 0 2 4 . 0 2 4 . 0 f 5 1 . 0 3 1 . 0 4 1 . 0 3 1 . 0 f 2 3 . 1 4 3 . 1 0 4 . 1 0 6 . 1 E B 9 1 . 0 9 1 . 0 9 1 . 0 9 1 . 0 7 2 . 0 9 2 . 0 8 2 . 0 9 2 . 0 1 8 . 0 7 7 . 0 5 7 . 0 4 7 . 0 Z C p 3 6 . 0 0 6 . 0 9 5 . 0 5 4 . 0 p 7 1 . 0 8 1 . 0 r 9 1 . 0 8 2 . 0 p 1 8 . 1 r 9 7 . 1 6 7 . 1 5 6 . 1 K D p 1 4 . 0 3 4 . 0 2 4 . 0 0 4 . 0 p 3 3 . 0 4 3 . 0 4 3 . 0 4 3 . 0 p 5 7 . 1 6 7 . 1 2 7 . 1 2 7 . 1 E D 2 4 . 0 9 3 . 0 6 3 . 0 7 3 . 0 2 1 . 0 3 1 . 0 3 1 . 0 0 1 . 0 p 6 3 . 0 8 2 . 0 3 2 . 0 5 2 . 0 E E
EL 0.21 : 0.19p 0.17p 0.14 : 0.13 0.12p 0.29 : 0.30 0.28p
2 3 . 0 2 3 . 0 9 2 . 0 8 2 . 0 7 1 . 0 6 1 . 0 5 1 . 0 5 1 . 0 8 5 . 0 7 5 . 0 4 5 . 0 8 4 . 0 S E
FR 1.39 1.41 1.37 1.36p 0.36 0.37 0.36 0.36p 0.42 0.42 0.42 0.41p 3 3 . 0 r 9 2 . 0 5 2 . 0 5 2 . 0 e 9 0 . 0 9 0 . 0 0 1 . 0 9 0 . 0 e 7 7 . 0 7 7 . 0 r 6 7 . 0 8 7 . 0 E I
IT 0.56 0.56 0.54 0.56p 0.22 0.20 0.20 0.17p 0.36 0.38 0.38 : p 3 1 . 0 2 1 . 0 9 0 . 0 7 0 . 0 p 4 1 . 0 3 1 . 0 2 1 . 0 2 1 . 0 p 8 0 . 0 8 0 . 0 6 0 . 0 5 0 . 0 Y C 5 1 . 0 6 1 . 0 7 1 . 0 7 1 . 0 8 0 . 0 9 0 . 0 8 0 . 0 9 0 . 0 9 1 . 0 3 1 . 0 7 1 . 0 5 1 . 0 V L
LT 0.20 0.11 0.14 0.16 0.27 0.22 0.18 0.19 0.21 0.33 0.36 0.41 : u 1 0 . 0 : 1 0 . 0 : 9 1 . 0 7 1 . 0 5 1 . 0 : 8 5 . 1 : : U L 2 2 . 0 6 2 . 0 6 2 . 0 4 2 . 0 6 2 . 0 0 3 . 0 4 3 . 0 5 2 . 0 7 3 . 0 5 3 . 0 6 3 . 0 8 3 . 0 U H
MT : 0.07 0.08p 0.10u : 0.05 0.02 0.02 : 0.16 0.17 0.18
p 0 5 . 0 9 4 . 0 0 5 . 0 9 4 . 0 p 5 2 . 0 5 2 . 0 4 2 . 0 7 2 . 0 p 2 0 . 1 1 0 . 1 8 9 . 0 5 0 . 1 L N : : 7 5 . 0 : : : 2 1 . 0 : : : 2 4 . 1 : T A S E H -P D G f o % a s a e r u t i d n e p x e D & R V O G -P D G f o % a s a e r u t i d n e p x e D & R S E B -P D G f o % a s a e r u t i d n e p x e D & R
Sources: Eurostat-R&D statistics, OECD - MSTI 2005-1
15 4 0 0 2 3 0 0 2 2 0 0 2 1 0 0 2 4 0 0 2 3 0 0 2 2 0 0 2 1 0 0 2 4 0 0 2 3 0 0 2 2 0 0 2 1 0 0 2 9 1 . 0 8 1 . 0 0 2 . 0 1 2 . 0 3 2 . 0 3 2 . 0 6 2 . 0 0 2 . 0 7 1 . 0 5 1 . 0 2 1 . 0 3 2 . 0 L P
PT 0.27 0.26e 0.26 : 0.18 0.15e 0.13 : 0.31 0.30e 0.30 :
e 5 2 . 0 e 5 2 . 0 4 2 . 0 5 2 . 0 e 5 3 . 0 e 5 3 . 0 5 3 . 0 8 3 . 0 e 6 9 . 0 e 0 9 . 0 1 9 . 0 0 9 . 0 I S
SK 0.43 0.37 0.32 0.26 0.15 0.15 0.18 0.16 0.06 0.05 0.08 0.11 9 6 . 0 7 6 . 0 6 6 . 0 1 6 . 0 3 3 . 0 4 3 . 0 6 3 . 0 7 3 . 0 6 4 . 2 5 4 . 2 0 4 . 2 1 4 . 2 I F 6 8 . 0 8 8 . 0 : 3 8 . 0 2 1 . 0 4 1 . 0 : 2 1 . 0 5 7 . 2 5 9 . 2 : 1 3 . 3 E S e 9 3 . 0 0 4 . 0 2 4 . 0 0 4 . 0 8 1 . 0 r 8 1 . 0 7 1 . 0 8 1 . 0 : 4 2 . 1 5 2 . 1 7 2 . 1 K U 1 6 . 0 3 6 . 0 f 1 5 . 0 8 5 . 0 3 6 . 0 4 7 . 0 f 7 7 . 0 2 6 . 0 0 7 . 1 4 5 . 1 f 0 8 . 1 1 8 . 1 S I 9 4 . 0 8 4 . 0 5 4 . 0 1 4 . 0 6 2 . 0 6 2 . 0 6 2 . 0 3 2 . 0 : 0 0 . 1 6 9 . 0 6 9 . 0 O N E
E A 1.25s 1.24s 1.22s 1.22sp 0.25s 0.25s 0.25s 0.24sp 0.40s 0.42s 0.42s 0.42sp
: : : : : H
C 0.03 : : : 0.64 : :
5 0 . 0 5 0 . 0 5 0 . 0 6 0 . 0 4 3 . 0 5 3 . 0 5 3 . 0 1 3 . 0 2 1 . 0 0 1 . 0 9 0 . 0 0 1 . 0 G B
HR : 0.48 0.45 : : 0.25 0.25 : 0.39 0.45 :
4 0 . 0 4 0 . 0 6 0 . 0 4 0 . 0 4 1 . 0 3 1 . 0 9 0 . 0 1 1 . 0 2 2 . 0 3 2 . 0 3 2 . 0 4 2 . 0 O R
TR 0.24 0.19 : : 0.05 0.05 : : 0.43 0.43 : :
: 4 1 . 0 2 1 . 0 1 1 . 0 : 6 3 . 0 5 3 . 0 2 3 . 0 : 2 8 . 0 5 7 . 0 5 6 . 0 N C : 3 4 . 0 3 4 . 0 4 4 . 0 : 9 2 . 0 0 3 . 0 9 2 . 0 : 6 3 . 2 2 3 . 2 6 2 . 2 P J 6 0 . 0 8 0 . 0 7 0 . 0 6 0 . 0 0 3 . 0 3 3 . 0 1 3 . 0 9 2 . 0 1 8 . 0 8 8 . 0 7 8 . 0 3 8 . 0 U R : p 3 4 . 0 p 2 4 . 0 9 3 . 0 : p 3 2 . 0 p 3 2 . 0 1 2 . 0 : p 9 7 . 1 p 6 8 . 1 8 9 . 1 S U S E B -P D G f o % a s a e r u t i d n e p x e D &
R R&Dexpenditureasa%ofGDP-GOV R&Dexpenditureasa%ofGDP-HES
Sources: Eurostat-R&D statistics, OECD - MSTI 2005-1
1 - R & D E X P E N D I T U R E
1 - R & D E X P E N D I T U R E
1 - R & D E X P E N D I T U R E
Table 1.5 R&D expenditure in the Business Enterprises Sector by selected NACE sector, in million current EUR, in the EEA countries, Candidate Countries and the Russian Federation — 2003
E
B 3608 6 2918 2834 26 638 31 135 21 429
Z
C 618 1 401 393 0 214 18 4 1 177
K
D 3355r : 2055 2044 : 1388 68 284 349 686
E
D 38029 25 34692 34581 81 3239 85 470 99 2578
E
E 23 : 10 10 : 12 0 2 4 5
EL 286p 2 189 188 0 94 3 11 1 78
S
E 4443 14 2501 2375 56 1898 105 176 142 1416
FR 21839 160 18701 18227 383 2420 : 1267 : 1150
E
I 1076 0 667 667 0 406 2 10 0 393
IT 6979 26 5198 5150 34 1755 212 153 187 1185
Y
C 9 : 4 4 0 5 0 0 0 4
V
L 13 : 4 4 : 9 0 : : 9
LT 23 1 15 14 2 7 0 0 : 5
U
L 379 : 179 179 0 200 10 11 47 133
U
H 255 0 198 196 2 51 27 2 1 17
MT 3 0 2 2 0 0 0 0 0 1
L
N 4804 95 3803 3750 24 840 212 27 45 550
T
A 3131 3 2298 2273 14 828 98 50 8 668
l a t o T
g n i r e e n i g n e ; D & R ; s e i t i v i t c a r e t u p m o C
l a c i n h c e t ; y c n a t l u s n o c d n a s e i t i v i t c a
) K ( s i s y l a n a d n a g n i t s e t )
Q o t G ( s e c i v r e S
d n a e l a s e l o h W
e d a r t n o i s s i m m o c
) G (
d n a t r o p s n a r T
) I ( n o i t a c i n u m m o c
l a i c n a n i F
) J ( n o i t a i d e m r e t n i )
1 ( y r t s u d n I d n a g n i n i M
) C ( g n i y r r a u
q Manufacturing(D)
d n a s a g , y t i c i r t c e l E
) E ( y l p p u s r e t a w
Exceptions to the reference year: FR, MT and AT 2002.
Industry = NACE D+ NACE E+ NACE F (with at least NACE D available).
Sources: Eurostat-R&D statistics
17 L
P 284 12 215 194 2 48 0 23 : 9
PT 338 1 157 151 3 179 18 11 41 104
I
S 222 e 6 e 192 e 192 e 0 25 e 0 e 0 0 23
SK 93 0 37 37 : 54 : : 0 53
I
F 3528 6 2849 2800 8 672 62 85 : 514
E
S 7886 7 6390 6336 54 1466 153 8 83 1195
K
U 19778 81 15366 15224 99 4156 155 967 416 2583
S
I 142 0 140 138 1 96 4 1 90
O
N 1960 111 929 890 7 878 54 83 54 687
G
B 18 0 9 9 0 9 : : 1 4
HR 114 : 14 10 0 97 : 0 97 :
O
R 118 9 77 73 3 15 0 1 : 13
TR 367 1 320 318 3 43 0 9 16 17
U
R 3176 11 216 216 : 2945 0 1 0 2941
l a t o T
g n i r e e n i g n e ; D & R ; s e i t i v i t c a r e t u p m o C
l a c i n h c e t ; y c n a t l u s n o c d n a s e i t i v i t c a
) K ( s i s y l a n a d n a g n i t s e t )
Q o t G ( s e c i v r e S
d n a e l a s e l o h W
e d a r t n o i s s i m m o c
) G (
d n a t r o p s n a r T
) I ( n o i t a c i n u m m o c
l a i c n a n i F
) J ( n o i t a i d e m r e t n i y
r t s u d n I (1) d
n a g n i n i M
) C ( g n i y r r a u
q Manufacturing(D)
d n a s a g , y t i c i r t c e l E
) E ( y l p p u s r e t a w
Exceptions to the reference year: TR and RU 2002.
Industry = NACE D+ NACE E+ NACE F (with at least NACE D available).
Sources: Eurostat-R&D statistics
1 - R & D E X P E N D I T U R E
1 - R & D E X P E N D I T U R E
1 - R & D E X P E N D I T U R E
Table 1.6 R&D expenditure in the Business Enterprises Sector by size class, in million current EUR, in the EEA countries, Candidate Countries and the Russian Federation — 2003
E
B 3608 9 128 441 380 794 1857
Z
C 618 2 9 48 49 168 342
K
D 3355r : 133 323 391 486 2116
E
D 38029 : 70 668 1705 2448 33139
E
E 23 : 3 3 2 9 7
EL 286p : 4 49 20 98 116
S
E 4443 0 65 776 654 1052 1897
FR 21646 : 269 1166 1789 2066 16356
E
I 1076 0 34 215 162 280 385
IT 6979 : 70 285 715 832 5077
Y
C 9 : 2 1 0 2 4
V
L 13 0 2 5 0 3 3
LT 23 : 1 1 2 13 6
U
L 379 : : 32 17 52 278
U
H 255 : 13 13 30 25 169
MT 3 : : 1 0 1 0
L
N 4804 : : 387 446 898 3073
T
A 3325s : : : : : :
l a t o
T 250to499
d e y o l p m e s n o s r e p
e r o m d n a 0 0 5
d e y o l p m e s n o s r e p 9
o t 1
d e y o l p m e s n o s r e p 0
d e y o l p m e n o s r e p
9 4 o t 0 1
d e y o l p m e s n o s r e p
9 4 2 o t 0 5
d e y o l p m e s n o s r e p
Exception to the reference year: MT 2002.
DK: the sum of the breakdowns does not add the total.
Sources: Eurostat-R&D statistics
19
L
P 284 1 2 15 57 101 108
PT 338 : 14 52 69 69 134
I
S 222e : : : : : :
SK 93 1 2 11 23 29 28
I
F 3528 : 68 241 302 433 2485
E
S 7886 : : 455 964 6466
K
U 19778 9 314 826 1933 2729 13967
S
I 142 : : : : : :
O
N 1960 : : 459 140 645 715
G
B 18 0 1 2 2 3 10
HR 114 : : : : : :
O
R 118 9 3 6 24 22 54
TR 3 76 : : : : : :
U
R 3176 298 207 783 1229 509 150
l a t o
T persone0mployed person1steom9ployed perso1n0steom4p9loyed pers5on0steom2p4l9oyed pers2o5n0steom4p9l9oyed pe5r0so0nasnedmmplooryeed
Exceptions to the reference year: TR and RU 2002.
Sources: Eurostat-R&D statistics
1 - R & D E X P E N D I T U R E
1 - R & D E X P E N D I T U R E
1 - R & D E X P E N D I T U R E
Table 1.7 Total R&D expenditure and the Business R&D expenditure by source of funds, in the EEA countries, Candidate Countries, China, Japan, the Russian Federation and the United States — 2003
D A O R B A V O G S E B D A O R B A V O G S E B 0 3 . 4 5 5 2 -U
E s 34.90s 2.30s 8.50s 81.27s 8.10s 0.12s 10.50s
0 6 . 4 5 5 1 -U
E s 34.70s 2.20s 8.50s 81.28s 8.06s 0.12s 10.54s
1 9 . 2 1 4 0 . 0 6 3 . 5 9 6 . 1 8 1 9 . 2 1 1 1 . 5 7 6 . 1 2 1 3 . 0 6 E B 6 4 . 5 7 5 . 1 9 9 . 1 1 8 9 . 0 8 7 5 . 4 6 1 . 2 3 8 . 1 4 5 4 . 1 5 Z C 5 8 . 0 1 3 0 . 0 6 2 . 2 6 8 . 6 8 1 5 . 9 6 6 . 2 1 5 . 6 2 1 3 . 1 6 K D 0 3 . 2 6 0 . 0 1 1 . 6 2 5 . 1 9 5 2 . 2 2 3 . 0 7 1 . 1 3 6 2 . 6 6 E D 9 3 . 7 6 0 . 0 9 5 . 5 7 9 . 6 8 0 2 . 5 1 6 2 . 3 9 5 . 8 4 6 9 . 2 3 E E 6 6 . 7 1 1 . 0 8 6 . 3 5 5 . 8 8 1 1 . 8 1 0 8 . 3 1 4 . 7 4 8 6 . 0 3 L E 4 2 . 5 6 1 . 0 4 1 . 1 1 6 4 . 3 8 3 7 . 5 2 8 . 5 7 0 . 0 4 5 3 . 8 4 S E 3 4 . 0 1 5 0 . 0 2 1 . 1 1 0 4 . 8 7 6 3 . 8 0 3 . 6 7 5 . 4 3 8 7 . 0 5 R F 8 1 . 9 8 4 . 0 2 0 . 3 3 3 . 7 8 9 7 . 8 9 7 . 2 1 3 . 9 2 3 1 . 9 5 E I : : : : T
I 76.13 14.11 0.14 9.61
1 3 . 0 1 0 0 . 0 5 7 . 1 4 9 . 7 8 8 8 . 3 1 3 1 . 6 4 9 . 9 5 4 8 . 9 1 Y C 6 7 . 9 1 0 0 . 0 2 0 . 6 1 2 2 . 4 6 6 3 . 0 2 0 0 . 0 2 4 . 6 4 2 2 . 3 3 V L 6 1 . 6 3 0 0 . 0 0 6 . 9 4 2 . 4 5 3 8 . 3 1 7 8 . 4 6 5 . 4 6 4 7 . 6 1 T L 9 3 . 0 8 U
L p 11.16p 0.16p 8.29p 89.19p 2.53p 0.00p 8.28p
6 3 . 2 2 6 3 . 0 6 3 . 6 2 9 . 0 7 2 7 . 0 1 0 4 . 0 3 0 . 8 5 8 6 . 0 3 U H : : : : : : : : T M 5 9 . 4 1 0 0 . 0 7 7 . 3 9 2 . 1 8 7 2 . 1 1 5 0 . 1 0 8 . 6 3 8 8 . 0 5 L N 2 9 . 3 4 T
A e 34.74e 0.36 20.99e 64.46 5.61 0.03 29.90
3 0 0 2 n i % n i s d n u f f o e c r u o s y b e r u t i d n e p x e D & R r e h t O s e c r u o s l a n o i t a n r e h t O s e c r u o s l a n o i t a n 3 0 0 2 n i % n i s d n u f f o e c r u o s y b S E B n i e r u t i d n e p x e D &
R (1)
(1) Exception to the reference year : AT 2002.
Sources: Eurostat-R&D statistics, OECD - MSTI 2005-1
21 D A O R B A V O G S E B D A O R B A V O G S E B 9 4 . 1 6 2 . 0 0 2 . 5 1 4 0 . 3 8 3 6 . 4 8 3 . 2 2 7 . 2 6 7 2 . 0 3 L P 8 4 . 5 0 0 . 0 8 2 . 5 4 2 . 9 8 0 0 . 5 7 1 . 3 1 1 . 0 6 3 7 . 1 3 T P 8 2 . 9 5 I
S e 35.28e 1.44e 3.99e 93.20e 4.91e 0.10e 1.79e
9 0 . 2 2 5 . 0 5 0 . 2 2 4 3 . 5 7 4 3 . 3 3 7 . 0 4 8 . 0 5 0 1 . 5 4 K S 3 8 . 0 6 0 . 0 9 2 . 3 2 8 . 5 9 5 1 . 3 3 1 . 1 2 7 . 5 2 0 0 . 0 7 I F 6 0 . 8 8 1 . 0 7 8 . 5 9 8 . 5 8 9 2 . 7 9 2 . 4 5 4 . 3 2 7 9 . 4 6 E S 7 9 . 5 2 2 0 . 0 7 8 . 0 1 4 1 . 3 6 8 3 . 9 1 3 4 . 5 1 3 . 1 3 9 8 . 3 4 K U 3 5 . 9 1 1 0 . 0 8 8 . 3 8 5 . 6 7 9 4 . 4 1 1 5 . 1 2 1 . 0 4 8 8 . 3 4 S I 0 4 . 7 6 4 . 1 1 9 . 1 4 3 2 . 9 4 O
N 80.67 10.44 0.02 8.87
0 2 . 4 5 A E
E s 35.10s 2.20s 8.50s 81.25s 8.13s 0.12s 10.49s
6 3 . 1 0 0 . 0 7 1 . 0 7 4 . 8 9 7 7 . 5 2 5 . 0 4 9 . 6 6 7 7 . 6 2 G B 6 6 . 2 0 0 . 0 2 6 . 1 2 7 . 5 9 7 1 . 2 -6 8 . 5 5 6 0 . 2 4 R H 0 4 . 4 2 3 . 0 3 2 . 8 2 6 0 . 7 6 6 4 . 5 3 5 . 1 3 6 . 7 4 9 3 . 5 4 O R 5 6 . 1 1 1 . 1 0 9 . 2 4 3 . 4 9 0 3 . 1 6 8 . 6 7 5 . 0 5 8 2 . 1 4 R T 1 6 . 2 9 9 . 4 3 9 . 4 7 4 . 7 8 5 9 . 1 : 1 9 . 9 2 0 1 . 0 6 N C 9 6 . 7 1 2 5 . 4 7 P
J e 7.50e 0.30 98.10 0.81 0.72 0.37
4 0 . 0 1 4 2 . 0 3 5 . 1 5 0 2 . 8 3 9 9 . 8 4 6 . 0 1 6 . 9 5 6 7 . 0 3 U R 1 1 . 3 6 S
U p 31.20p 5.69p : 89.96p 10.04p 0.00 :
3 0 0 2 n i % n i s d n u f f o e c r u o s y b e r u t i d n e p x e D &
R (1)
r e h t O s e c r u o s l a n o i t a n 3 0 0 2 n i % n i s d n u f f o e c r u o s y b e r u t i d n e p x e D & R e s i r p e r t n e s s e n i s u
B (1)
r e h t O s e c r u o s l a n o i t a n
(1) Exception to the reference year: TR 2002.
Sources: Eurostat-R&D statistics, OECD - MSTI 2005-1
1 - R & D E X P E N D I T U R E
2 - R & D P E R S O N N E L
23
2 - R & D
2 - R & D
P E R S O N N E L
P E R S O N N E L
In 2003, 1.44% of the total personnel (in head count - HC) employed in the EU-25 worked in R&D. This proportion remained stable compared to
2002. Within the EU-25, the biggest concentrations of R&D personnel (HC) in proportion of total employment were observed in Finland (3.11%),
Sweden (2.49%) and Denmark (2.29%).
In 2004, more than 2 million people (in full time equivalent - FTE) including 1.2 million of researchers were active in R&D in the EU-25. Both
number of R&D personnel and researchers increased over the last year by 1.3% and 3.5% respectively.
Researcher is the major occupation among the R&D personnel (in FTE) and its proportion has slightly risen to 59% of the total R&D personnel in
2004. The highest proportion was observed in the higher education sector (HES) where it reached 64% against 55% in both the government and
business enterprise sectors.
The breakdown of researchers by sectors of employment shows a mixed picture across the EU. While on average 49 % of researchers FTE are
concentrated in the business enterprise sector, in eight new Member States this share is less than 30 %.
Research is still a predominantly male business: in 2003, women working in R&D were in minority in most of the EU countries. They represented
more than 45% in only 3 Member States out of 19 (for which the data is available).
The R&D personnel in head count (HC) increased as well by 1.5% and in 2004 about 2.8 million people worked in R&D in the EU-25.
Industry and manufacturing welcomed most of the R&D personnel in the EU in 2003, whereas France, the United-Kingdom and Germany rank at
the top in terms of R&D employment in computer activities; R&D; engineering activities and consultancy, etc. In most EU Member States, large
enterprises of more than 250 persons employed account for more than 40 % of all researchers in the business enterprise sector. In Estonia, Greece
and Latvia small enterprises of less than 49 persons employed amounted for more than 40 % of business enterprise researchers.
Figure 2.1 R&D personnel as a percentage of persons employed (in HC) in the EEA countries, Switzerland, the Candidate Countries, Japan and the Russian Federation — 2003
8 3 . 0 0.43
1 6 . 0 0.64
0 8 .
0 0.86 0.92 7 9 .
0 0.99 1.12 3 1 .
1 1.18 1.24 9 2 .
1 1.30 1.34 1.40 1.43 1.44 1.45 4 5 . 1 1.66
3 7 .
1 1.79 1.82 1.85 0 2 .
2 2.26 2.29 9 4 . 2
1 1 . 3
8 4 . 3
0 . 0 5 . 0 0 . 1 5 . 1 0 . 2 5 . 2 0 . 3 5 . 3 0 . 4
S I I F E S K D O N U L E D E B T A R F P J 5 1 -U E S E 5 2 -U E E I I S R G U R E E U H Z C T I R H T L K S L P T P V L Y C G B O R R T %
Exceptions to the reference year: AT and TR 2002. Provisional data: IE.
National estimation: SI.
Eurostat estimations: EU-15 and EU-25. Sources: Eurostat-R&D statistics, OECD - MSTI 2005-1
25
Figure 2.2 Researchers by institutional sector (in FTE) in the EEA countries, the Candidate Countries, Japan and the Russian Federation — 2004
% 0
% 0 2
% 0 4
% 0 6
% 0 8
% 0 0 1
U R P J R T O R R H G B O N S I K U E S I F K S I S T P L P T A L N T M U H U L T L V L Y C T I E I R F S E L E E E E D K D Z C E B 5 1 -U E 5 2 -U E
S E
B GOV HES PNP
Exceptions to the reference year: FR, IT, LU, PT, UK, NO, HR and JP 2003 ; AT and TR 2002.
Provisional data: DK, BES in EE, EL, CY.
National estimations: GOV and HES in DE, NL, SI. Eurostat estimations: EU-15 and EU-25. Unreliable data: HES in LU, HES in TR, BES in MT.
Sources: Eurostat-R&D statistics, OECD - MSTI 2005-1
2 - R & D
2 - R & D
2 - R & D
P E R S O N N E L
P E R S O N N E L
Table 2.1 Researchers as a percentage of total personnel (in FTE) in 2004 and percentage of women among researchers (in HC) in 2003, in the EEA countries, the Candidate Countries, Japan and the Russian Federation
S E H V O G S E B L A T O T S E H V O G S E B L A T O T p s 4 . 8 6 p s 6 . 4 5 p s 6 . 4 5 p s 0 . 9 5 5 2 -U
E : : : :
p s 2 . 6 6 p s 0 . 3 5 p s 6 . 4 5 p s 9 . 7 5 5 1 -U
E : : : :
6 . 5 3 8 . 9 2 6 . 9 1 3 . 8 2 f 4 . 4 7 f 8 . 2 5 f 9 . 1 5 f 1 . 9 5 E B 9 . 2 3 6 . 2 3 5 . 9 1 3 . 8 2 0 . 0 7 8 . 2 6 4 . 8 4 7 . 6 5 Z C 3 . 1 3 9 . 4 3 1 . 5 2 4 . 8 2 p 1 . 0 7 p 6 . 1 7 p 9 . 6 5 p 3 . 1 6 K D 0 . 5 2 1 . 7 2 6 . 1 1 2 . 9 1 e 2 . 8 6 e 6 . 5 5 3 . 4 5 e 5 . 7 5 E D 1 . 5 4 5 . 9 5 7 . 3 2 1 . 3 4 6 . 8 7 0 . 0 6 p 0 . 1 6 p 2 . 1 7 E E
EL 49.2p 37.5p 41.9p 59.8p 36.8 34.7 38.9 36.9
7 . 7 3 5 . 4 4 6 . 6 2 3 . 6 3 e 5 . 1 8 e 1 . 3 6 e 3 . 5 4 e 9 . 2 6 S E
FR 55.7 52.1 47.8 67.6 27.8 20.3 32.0 34.1
p 8 . 8 3 6 . 0 3 3 . 0 2 p 0 . 1 3 7 . 5 8 7 . 5 4 e 2 . 4 6 e 4 . 9 6 E I
IT 43.5 39.5 44.4 46.8 29.3 19.3 38.7 30.8
0 . 1 3 1 . 0 4 3 . 2 2 9 . 0 3 p 9 . 4 9 p 6 . 8 2 p 0 . 0 5 p 3 . 5 5 Y C 5 . 2 5 5 . 5 5 0 . 4 5 1 . 3 5 3 . 4 7 4 . 8 4 9 . 0 5 1 . 5 6 V L
LT 69.7 49.3 55.1 79.5 48.3 36.5 50.3 48.7
u 9 . 2 4 5 . 8 2 e 2 . 4 1 4 . 7 1 u 3 . 8 8 3 . 8 6 5 . 5 4 6 . 8 4 U L 8 . 6 3 9 . 9 3 5 . 4 2 1 . 5 3 2 . 9 6 8 . 1 6 3 . 4 6 3 . 5 6 U H
MT 68.9u 54.3u 23.1 76.6 : : 22.2 24.3
: 0 . 0 2 7 . 8 : e 7 . 1 4 e 1 . 7 5 e 5 . 3 4 e 0 . 5 4 L N 0 . 0 3 6 . 4 3 4 . 0 1 7 . 0 2 6 . 0 7 5 . 8 4 9 . 9 5 0 . 2 6 T A E T F -4 0 0 2 n i l e n n o s r e p D & R l a t o t f o % a s a s r e h c r a e s e
R (1) %ofwomenontotalresearchersin2003-HC(2)
(2) Exception to the reference year: AT 2002.
Sources: Eurostat-R&D statistics, OECD - MSTI 2005-1
26
#
27 S E H V O G S E B L A T O T S E H V O G S E B L A T O T 5 . 0 4 1 . 1 4 2 . 5 2 3 . 9 3 2 . 7 8 0 . 5 6 2 . 4 6 8 . 7 7 L P
PT 79.3 62.0 70.0 90.3 44.3 29.7 57.9 45.9
e 0 . 3 3 e 3 . 3 4 e 3 . 8 2 e 4 . 4 3 e 8 . 7 8 e 1 . 3 7 e 4 . 8 3 e 7 . 6 5 I S
SK 74.8 52.3 67.1 89.3 40.6 30.9 45.2 41.4
7 . 2 5 7 . 0 4 4 . 8 1 9 . 9 2 1 . 3 7 2 . 7 5 7 . 1 7 4 . 0 7 I F 7 . 3 4 4 . 6 3 2 . 5 2 7 . 4 7 2 . 1 8 7 . 6 7 0 . 0 6 3 . 7 6 E S : 2 . 2 3 : : : e 0 . 4 4 0 . 3 6 : K U 1 . 3 4 1 . 2 4 0 . 3 3 4 . 9 3 3 . 7 7 3 . 0 6 8 . 1 6 2 . 5 6 S I 6 . 7 3 6 . 5 3 9 . 8 1 4 . 9 2 0 . 0 8 2 . 6 6 2 . 1 7 : O N E
E A 59.2sp 54.9sp 54.8sp 68.5sp : : : :
8 . 7 3 7 . 0 5 5 . 7 4 6 . 6 4 8 . 7 7 4 . 9 5 4 . 7 5 8 . 2 6 G B
HR 64.1 42.2 65.9 75.2 42.2 40.1 45.9 40.4
3 . 0 4 2 . 9 4 8 . 1 4 0 . 3 4 7 . 1 8 2 . 4 6 5 . 5 5 7 . 3 6 O R
TR 82.8 62.5 50.1 100.0u 35.6 25.0 27.5 37.0
4 . 0 2 7 . 1 1 6 . 6 6 . 1 1 9 . 6 7 5 . 4 5 0 . 9 7 5 . 6 7 P J 5 U
R 0.2 4 35. 52.4 71.3 43.3 42.6 4 95. 3 .28
E T F -4 0 0 2 n i l e n n o s r e p D & R l a t o t f o % a s a s r e h c r a e s e
R (1) %ofwomenontotalresearchersin2003-HC(2)
(1) Exceptions to the reference year: BES in UK, NO, HR and JP 2003 ; TR 2002.
Sources: Eurostat-R&D statistics, OECD - MSTI 2005-1
2 - R & D
2 - R & D
P E R S O N N E L
P E R S O N N E L
#
(2) Exceptions to the reference year: FI and TR2002.
CH 2000 in BES.
2 - R & D
[image:41.842.78.583.82.283.2]2 - R & D
P E R S O N N E L
P E R S O N N E L
Table 2.2 R&D personnel by sector of performance, in head count (HC) and as a percentage of person employed, in the EEA countries, the Candidate Countries, Japan and the Russian Federation — 2003
s n o s r e p f o % a s a C H n i l a t o T d e y o l p m e s n o s r e p f o % a s a C H n i l a t o T d e y o l p m e s n o s r e p f o % a s a C H n i l a t o T d e y o l p m e s n o s r e p f o % a s a C H n i l a t o T d e y o l p m e s 8 5 . 0 s 5 5 3 4 1 1 1 s 9 1 . 0 s 1 5 4 4 7 3 s 6 6 . 0 s 4 8 4 2 6 2 1 s 4 4 . 1 s 1 9 4 1 8 7 2 5 2 -U E s 0 6 . 0 s 6 0 3 4 7 9 s 9 1 . 0 s 2 6 6 3 1 3 s 4 7 . 0 s 2 8 8 1 1 2 1 s 4 5 . 1 s 0 3 0 9 2 5 2 5 1 -U E 8 7 . 0 1 3 4 1 3 0 1 . 0 3 0 9 3 3 9 . 0 2 1 8 7 3 2 8 . 1 3 6 7 3 7 E B 8 3 . 0 7 7 8 7 1 8 2 . 0 7 5 3 3 1 1 5 . 0 2 2 1 4 2 8 1 . 1 9 9 6 5 5 Z C 2 7 . 0 5 5 4 9 1 9 1 . 0 8 1 0 5 7 3 . 1 3 5 9 6 3 9 2 . 2 9 0 8 1 6 K D p 9 6 . 0 p 1 5 7 6 4 2 4 2 . 0 5 9 6 4 8 3 9 . 0 5 8 2 3 3 3 5 8 . 1 1 3 7 4 6 6 E D 2 8 . 0 3 1 8 4 9 1 . 0 5 4 1 1 6 2 . 0 9 2 5 1 9 2 . 1 0 0 6 7 E E
EL 57257 1.34 12808 0.30 9148 0.21 35088 0.82
6 7 . 0 5 2 7 1 3 1 0 2 . 0 6 0 3 5 3 8 4 . 0 7 2 3 2 8 5 4 . 1 9 6 9 9 4 2 S E
FR 415061 1.73 203264 0.85 50690 0.21 153131 0.64
p 7 6 . 0 p 0 1 0 2 1 9 0 . 0 7 5 6 1 7 6 . 0 7 3 0 2 1 p 3 4 . 1 p 4 0 7 5 2 E I
IT 249782 1.13 81189 0.37 42610 0.19 120629 0.55
8 1 . 0 1 0 6 2 2 . 0 4 2 7 7 1 . 0 7 6 5 4 6 . 0 2 0 1 2 Y C 3 5 . 0 2 0 3 5 5 1 . 0 2 7 4 1 2 1 . 0 8 2 2 1 0 8 . 0 2 0 0 8 V L
LT 14534 0.99 781 0.05 3301 0.22 10452 0.71
u 3 0 . 0 u 4 5 9 2 . 0 8 4 5 8 8 . 1 3 3 5 3 0 2 . 2 5 3 1 4 U L 1 7 . 0 9 6 7 7 2 9 2 . 0 4 7 4 1 1 4 2 . 0 8 3 4 9 4 2 . 1 1 8 6 8 4 U H
MT 975 0.65 97 0.07 37 0.02 841 0.56
e b 0 6 . 0 e b 1 5 8 8 4 0 2 . 0 6 6 8 5 1 1 7 . 0 2 4 4 7 5 e 0 5 . 1 e 0 5 2 2 2 1 L N 8 6 . 0 2 7 0 5 2 6 1 . 0 0 1 0 6 3 9 . 0 0 2 0 4 3 9 7 . 1 5 2 7 5 6 T A S E H V O G S E B L A T O T
Exception to the reference year: AT 2002.
Sources: Eurostat-R&D statistics, OECD - MSTI 2005-1
29
2 - R & D
2 - R & D
P E R S O N N E L
P E R S O N N E L
#
s n o s r e p f o % a s a C H n i l a t o T d e y o l p m e s n o s r e p f o % a s a C H n i l a t o T d e y o l p m e s n o s r e p f o % a s a C H n i l a t o T d e y o l p m e s n o s r e p f o % a s a C H n i l a t o T d e y o l p m e 3 6 . 0 5 4 7 5 8 9 1 . 0 0 9 3 5 2 1 1 . 0 5 3 0 5 1 2 9 . 0 1 4 2 6 2 1 L PPT 44036 0.86 9882 0.19 7273 0.14 21488 0.42
e 3 4 . 0 e 8 6 8 3 e 0 3 . 0 e 3 9 6 2 e 3 6 . 0 e 6 7 6 5 e 0 4 . 1 e 1 0 5 2 1 I S
SK 20928 0.97 4545 0.21 4458 0.21 11917 0.55
0 0 . 1 9 4 0 4 2 1 4 . 0 3 0 9 9 7 6 . 1 9 8 0 0 4 1 1 . 3 3 7 7 4 7 I F 5 1 . 1 9 0 9 9 4 3 1 . 0 1 2 5 5 0 2 . 1 6 4 3 2 5 9 4 . 2 6 4 1 8 0 1 E S 3 9 7 2 2 : : : : K
U 0.08 : :
4 8 . 0 3 2 3 1 1 1 . 1 0 4 7 1 0 4 . 1 3 9 1 2 8 4 . 3 6 6 4 5 S I 7 9 . 0 1 6 9 1 2 9 2 . 0 2 4 6 6 0 0 . 1 2 7 5 2 2 6 2 . 2 5 7 1 1 5 O N E
E A 2824794sp 1.45sp 1282929sp 0.66sp 381677sp 0.20sp 1129877sp 0.58sp
4 1 . 0 0 2 9 3 8 3 . 0 7 7 9 0 1 8 0 . 0 8 9 3 2 1 6 . 0 0 0 4 7 1 G B
HR 17216 1.12 2237 0.15 5487 0.36 9492 0.62
4 1 . 0 9 5 8 2 1 0 1 . 0 1 4 6 9 8 1 . 0 2 3 2 7 1 3 4 . 0 5 8 9 9 3 O R
TR 79958 0.38 9107 0.04 8644 0.04 62207 0.30
2 5 . 0 3 8 9 5 3 3 1 1 . 0 7 6 3 2 7 0 0 . 1 0 8 3 3 5 6 6 6 . 1 9 9 0 1 8 0 1 P J 7 0 . 0 0 2 1 3 4 9 3 . 0 8 9 0 6 5 2 5 8 . 0 8 6 6 8 5 5 0 3 . 1 0 7 4 8 5 8 U R S E H V O G S E B L A T O T
Exception to the reference year: TR 2002.
2 - R & D
2 - R & D
P E R S O N N E L
P E R S O N N E L
Table 2.3 Total R&D personnel and researchers in FTE by sector of performance in the EEA countries, the Candidate Countries, Japan and the Russian Federation — 2004
s r e h c r a e s e R l e n n o s r e p l a t o T s r e h c r a e s e R l e n n o s r e p l a t o T s r e h c r a e s e R l e n n o s r e p l a t o T s r e h c r a e s e R l e n n o s r e p l a t o T p s 0 2 4 5 3 4 p s 9 4 8 6 3 6 p s 0 6 6 9 5 1 p s 4 1 4 2 9 2 p s 4 2 4 7 9 5 p s 7 7 9 3 9 0 1 p s 9 0 4 7 0 2 1 p s 0 3 5 7 4 0 2 5 2 -U E p s 6 8 3 7 6 3 p s 0 0 7 4 5 5 p s 0 1 9 0 3 1 p s 8 4 9 6 4 2 p s 9 0 0 2 7 5 p s 4 4 5 7 4 0 1 p s 9 8 6 4 8 0 1 p s 0 7 6 2 7 8 1 5 1 -U E f 5 7 8 2 1 f 2 0 3 7 1 f 3 3 1 2 f 9 3 0 4 f 2 1 6 6 1 f 4 0 0 2 3 f 0 8 8 1 3 f 8 3 9 3 5 E B 4 7 2 4 4 0 1 6 1 6 6 4 2 2 4 7 7 9 2 7 4 6 0 5 1 0 0 3 6 1 5 6 7 8 2 Z C p 0 3 0 8 p 2 5 4 1 1 p 7 4 0 2 p 9 5 8 2 p 2 2 9 6 1 p 7 4 7 9 2 p 9 5 1 7 2 p 1 2 3 4 4 K D e 0 0 5 7 6 e 0 0 0 9 9 e 0 0 0 0 4 e 0 0 0 2 7 0 0 0 2 6 1 p 0 0 1 8 9 2 e 0 0 5 9 6 2 e 0 0 1 9 6 4 E D 2 6 1 2 2 5 7 2 6 8 4 0 1 8 p 1 6 6 p 3 8 0 1 p 9 6 3 3 p 5 3 7 4 E E
EL 31843p 15680p 10984p 4116p 5137p 2150p 15519p 9277p e 6 1 6 1 5 e 1 3 3 3 6 e 1 3 1 7 1 e 7 3 1 7 2 e 2 6 5 0 3 e 6 7 4 7 6 e 2 8 4 9 9 e 7 5 2 8 5 1 S E
FR 346078 192790 193256 100646 51372 24541 95234 64403 1 5 1 4 1 4 8 4 9 5 5 2 2 2 1 e 0 0 2 6 e 0 5 6 9 e 0 1 9 0 1 e 3 1 7 5 1 E I
IT 161828 70332 67958 26866 31463 13976 59406 27774 p 0 8 2 p 5 9 2 p 0 0 1 p 0 5 3 p 5 1 1 p 0 3 2 p 0 2 5 p 0 4 9 Y C 5 8 3 2 8 0 2 3 0 9 4 3 1 0 1 8 4 4 1 8 8 4 2 3 3 3 0 1 5 V L
LT 10557 7356 981 484 3041 1676 6535 5196
u 0 3 u 4 3 5 2 3 6 7 4 4 9 5 1 0 0 5 3 9 4 9 1 0 1 0 4 U L 2 0 9 5 7 2 5 8 3 9 6 4 5 9 5 7 9 0 3 4 4 0 7 6 4 0 9 4 1 6 2 8 2 2 U H
MT 395u 272u 94u 51u 17 4 284 217
e 0 5 2 1 1 p 0 0 0 7 2 p 0 9 6 7 p 9 7 4 3 1 e 6 0 3 1 2 p 4 1 0 9 4 e 9 6 2 0 4 p 2 2 5 9 8 L N 7 7 9 6 9 7 8 9 9 9 9 0 6 0 2 1 0 0 6 1 8 2 7 6 2 4 2 1 4 2 3 9 8 8 3 T A S E H V O G S E B L A T O T
Exceptions to the reference year: FR, IT, LU 2003 ; AT 2002.
Sources: Eurostat-R&D statistics, OECD - MSTI 2005-1
31
s r e h c r a e s e R l e n n o s r e p l a t o T s r e h c r a e s e R l e n n o s r e p l a t o T s r e h c r a e s e R l e n n o s r e p l a t o T s r e h c r a e s e R l e n n o s r e p l a t o T
L
P 78362 60944 12978 8334 19685 12804 45572 39716
PT 25529 20242 6124 3794 4917 3440 11147 10062
I
S 8830e 5003e 4945e 1901e 2040e 1491e 1586e 1392e
SK 14329 10718 3473 1815 3493 2345 7286 6509
I
F 58281 41004 32612 23397 7337 4200 17822 13037
E
S 72459 48784 47123 28295 3056 2345 21910 17794
K
U : : 162863 102684 20763e 9126e : :
S
I 3050 1987 1422 879 794 479 746 576
O
N : : 16126 11480 4985 3300 8500 6800
E
E A 2080407sp 1231706sp 1111731sp 610505sp 298194sp 163438sp 646095sp 442796 ps
G
B 15647 9827 2158 1239 10384 6168 3036 2362
HR 9148 5861 2165 913 3275 2158 3708 2790
O
R 33361 21257 16368 9092 9853 6326 6917 5654
TR 28964 23995 5918 3697 5502 2754 17544 17544u
P
J 882414 675330 580628 458845 61893 33711 224049 172396
U
R 951569 477647 568173 257621 282422 147896 99402 70844
S E H V
O G S
E B L
A T O T
Exceptions to the reference year: PT, HR, JP, BES in UK and BES in NO 2003 ; TR 2002.
Sources: Eurostat-R&D statistics, OECD - MSTI 2005-1