White Rose Research Online URL for this paper:
http://eprints.whiterose.ac.uk/131033/
Version: Accepted Version
Article:
Davies, HS, Debarre, D, El Amri, N et al. (3 more authors) (2018) Elastohydrodynamic Lift
at a Soft Wall. Physical Review Letters, 120 (19). 198001. ISSN 0031-9007
https://doi.org/10.1103/PhysRevLett.120.198001
[email protected] https://eprints.whiterose.ac.uk/ Reuse
Items deposited in White Rose Research Online are protected by copyright, with all rights reserved unless indicated otherwise. They may be downloaded and/or printed for private study, or other acts as permitted by national copyright laws. The publisher or other rights holders may allow further reproduction and re-use of the full text version. This is indicated by the licence information on the White Rose Research Online record for the item.
Takedown
If you consider content in White Rose Research Online to be in breach of UK law, please notify us by
Elastohydrodynamic lift at a soft wall
Heather S. Davies,1Delphine D´ebarre,1Nouha El Amri,1Claude Verdier,1Ralf P. Richter,2, 3,∗and Lionel Bureau1,†
1Univ. Grenoble Alpes, CNRS, LIPhy, 38000 Grenoble, France
2
School of Biomedical Sciences, Faculty of Biological Sciences,
School of Physics and Astronomy, Faculty of Mathematics and Physical Sciences, Astbury Centre for Structural Molecular Biology, University of Leeds, Leeds LS2 9JT, UK
3
CIC biomaGUNE, Paseo Miramon 182, 20014 San Sebastian, Spain
(Dated: April 5, 2018)
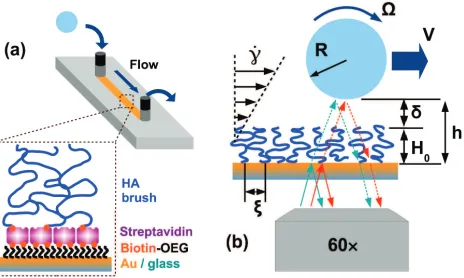
We study experimentally the motion of non-deformable microbeads in a linear shear flow close to a wall bearing a thin and soft polymer layer. Combining microfluidics and 3D optical tracking, we demonstrate that the steady-state bead/surface distance increases with the flow strength. Moreover, such lift is shown to result from flow-induced deformations of the layer, in quantitative agreement with theoretical predictions from elastohydrodynamics. This study thus provides the first experi-mental evidence of “soft lubrication” at play at small scale, in a system relevante.g. to the physics of blood microcirculation.
Elastohydrodynamics (EHD) is a key concept in soft matter physics [1–3]. The coupling between flow-induced pressure fields and elasticity of immersed objects is at the heart of topics ranging from the rheology of soft colloids [4] to microfluidic particle sorting [5] and contact-free me-chanical probe techniques [6]. EHD is also central to bio-physical problems, such as swimming of micro-organisms [7], lubrication in synovial joints and blood microcircu-lation [8]. In the latter context, EHD governs the radial migration of circulating blood cells, which underlies vas-cular processes, such as margination [5, 9, 10]: leukocytes and platelets flow preferentially close to the vessel walls, while softer red blood cells (RBCs) migrate away from them. This gives rise to a cell-free layer, a µm-thick region forming near the vascular walls and depleted of RBCs [11]. This has been characterizedin vitro, through flow experiments studying how RBCs [12] or model vesi-cles [13] are repelled by a surface. The classical inter-pretation for the formation of the cell-free layer is that RBCs flowing near a surface deform under the fluid shear stress and experience a non-inertial lift force that pushes them away from the wall [14]. Reflecting this, most in vitro studies, as well as numerical [15] and theoretical [16] works, consider interactions between a rigid surface and deformable cells, which adopt an asymmetric shape under flow. Such an asymmetry of the flowing objects is pinpointed as the origin of the lift force arising at the low Reynolds numbers typically encountered in microcircula-tion. In vivo, however, blood flow takes place in compli-ant vessels. In particular, the endothelium (the luminal side of blood vessels) is lined by a glycocalyx, a thin (100-1000 nm) and soft (elastic modulus of 10-100 Pa) layer of polysaccharides bound to the walls and directly exposed to blood flow [17]. While the importance of the glycocalyx on blood microrheology is recognized [17–19], its quantitative influence on EHD interactions largely re-mains to be established. More generally, the question of how a thin deformable layer can contribute to “soft lubrication” and induce lift forces has been addressed
FIG. 1. (a) Flow chamber with bottom surface functionalized with a HA brush via biotin/streptavidin binding. (b) A bead traveling in a shear flow of velocity gradient ˙γ. Dual color RICM is used to monitor its distance h from the substrate and its translation velocityV.
theoretically [20–23], but has received limited attention from the experimental standpoint, with a single study investigating at the macroscopic scale how EHD affects the sliding dynamics of cylinders near a soft wall [24]. In this Letter, we report the investigation of the lift experi-enced by rigid spherical particles flowing in the vicinity of a surface bearing a polymer brush that mimics the gly-cocalyx. Using microfluidics and three-dimensional (3D) tracking, we provide the first direct evidence that, under conditions of flow strengths and object sizes relevant to blood circulation, a thin deformable polymer brush gives rise to a sizeable lift on circulating beads, which can be quantitatively described by soft lubrication theory.
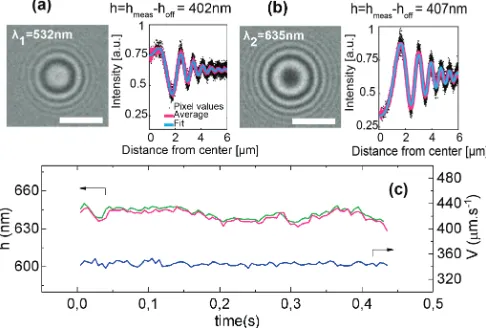
[image:2.612.324.556.257.396.2]FIG. 2. (a) Left: interference patterns atλ1= 532 nm (scale
bar 5µm). Right: radial intensity profile (black dots) ex-tracted from image, azimuthally averaged (magenta line), and fitted with an optical model (cyan line) to determinehmeas,
from which we computeh=hmeas−hoff, withhoff the offset
due to the contribution of the gold and streptavidin layers (measured independently, see Supplemental Material). (b) Same as (a) atλ2= 635 nm. (c) Time series forh(green:λ1,
magenta: λ2) and V (blue), for a bead flowing close to the
HA brush.
brush of hyaluronan (HA, the major component of the glycocalyx, see Fig. 1a and details below). The in-let reservoir contained spherical polystyrene beads of ra-diusR= 12.5µm (Kisker Biotech, Germany) suspended in aqueous buffer (10 mM HEPES, pH 7.4, 150 mM NaCl, 2mM CaCl2, viscosity η ≃ 10−3 Pa.s and den-sity ρ ≃ 1000 kg.m−3), while the outlet was connected to a syringe pump (KDS Legato 110) imposing flow rates in the rangeQ= 1−200µL.min−1. Beads were pumped into the channel and left to sediment under quiescent conditions onto the bottom surface of the chamber, after which their motion under imposed flow rate was moni-tored optically. 3D tracking was performed by reflection interference contrast microscopy (RICM) using a setup allowing for simultaneous imaging at two wavelengths (λ1 = 532 nm, λ2 = 635 nm, see Supplemental Mate-rial and references [25, 26] for details). Under flow, the fringe patterns due to interference between the light re-flected from the substrate and the surface of the beads were recorded (Fig. 2a and b) on a camera (ORCA-Flash4.0 Hamamatsu) at rates of up to 200 frames per second. Bead trajectories were analyzed offline, using home-written Labview routines, in order to compute for eachQ: (i) the steady-state vertical distancehbetween the substrate and the beads, and (ii) the beads’ transla-tion velocityV (Fig. 1b and 2c). The absolute value ofh was determined unambiguously up to∼1.2µm owing to the two-color RICM scheme used [26], with an accuracy of ∼ 10 nm. The in-plane displacements of the beads, from whichV was computed, were determined by image
correlation with an accuracy of∼50 nm.
The surface of the coverslip exposed to the flow was functionalized with a layer of HA, as described in [27, 28]. A Ti/Au layer (respectively 0.5 and 5 nm in thickness) was evaporated onto the glass surface. A monolayer of end-biotinylated oligo(ethyleneglycol) thiols (bOEG-SH) was grafted onto the gold film. A dense layer of strepta-vidin was bound to the exposed biotin moieties, and fur-ther functionalized by incubation with end-biotinylated HA (Fig. 1a). Such a procedure yields HA films stably bound to the substrate in a polymer brush conformation [27]. To investigate the role of brush thickness and soft-ness, we have studied three different HA surfaces made of chains of well-defined molecular weight (Hyalose, USA): two substrates obtained by incubating chains of 840±60 kDa for two different times, yielding high (HA840-h) and low (HA840-l) grafting density samples, and a third one (HA58) bearing a brush made of chains of 58±3 kDa. Without flow, we measure equilibrium bead heights of respectivelyh= 405, 285 and 110±5 nm on the HA840-h, HA840-l and HA58 layers. The gravitational force exerted by a bead sedimented on a brush reads:
Fg= 4πR3
3 g∆ρ (1)
Withg= 9.81 m.s−2and a density difference of ∆ρ= 40 kg.m−3 between the beads and the fluid [29], we com-pute Fg = 3.2 pN. This corresponds to an interaction energy per unit areaFg/R≃2.5×10−7N.m−1at which we anticipate the brushes to be essentially uncompressed [27]. Compared toFg, van der Waals forces between the beads and the glass substrate are negligible at distances h >10 nm [30], and repulsive forces of electrostatic ori-gin are screened at the ionic strength used (Debye length <1 nm) [31]. Therefore, as done previously with similar systems [30], we neglect surface forces and assume that quiescent beads sit at an equilibrium distance from the coverslip that reflects the unperturbed brush heightH0. From H0, we compute (see Supplemental Material) the average distance between the tethered ends of the HA chains (Fig. 1b),ξ= 74±17, 130±30 and 10±3 nm re-spectively for the HA840-h, HA840-l and HA58 brushes. As a control surface, a plain gold-coated coverslip was used, passivated by a layer of bovine serum albumin to minimize non-specific adhesive bead/surface interactions.
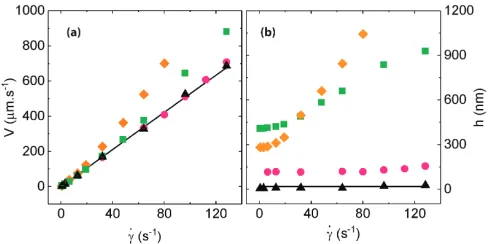
An example time series for h and V of a single bead traveling across the field of view is shown in Fig. 2c. Single bead data were time-averaged, and measurements over 20 to 50 beads were performed under identical flow conditions to obtain the ensemble-averaged values ofV andhshown respectively in Fig. 3a and 3b as a function of wall shear rate ˙γ= 6Q/(W H2).
[image:3.612.55.298.53.217.2]3
FIG. 3. (a) V( ˙γ) measured on control surface (N), HA840-h (), HA840-l (), and HA58 (
•
) brushes. The solid line is the GCB prediction for non-deformable surfaces separated by 20 nm. (b) Experimentally measuredh( ˙γ) (symbols as in (a)). Solid line indicates the constant value ofz= 20 nm used in GCB theory. Error bars accounting for standard error and uncertainty onhandV are about the size of the symbols.When beads are flowing past the HA840-h brush, their velocity increases linearly with ˙γ andhremains close to H0 at shear rates below∼20-30 s−1. However, for ˙γ >30 s−1,V grows more than linearly with ˙γwhile hsteadily increases and reaches up to 900 nm at the largest shear rate (Fig. 3, squares). Such a trend is further amplified with the HA840-l brush (Fig. 3, diamonds). With the HA58 brush, we observe thatV grows quasi-linearly with
˙
γ, whilehincreases by only 40 nm aboveH0at the largest ˙
γ (Fig. 3b, and magnified in Fig. 4a). Thus, there is a lift of the beads away from the brushes, with a magnitude depending on the shear rate and the type of brush. We now discuss the possible origins of such a phenomenon.
Given the low Reynolds number in our experiments (Re.10−2), we first compare the results from the con-trol experiment with the theory of Goldman, Cox and Brenner (GCB) for a rigid bead in a shear flow past a non-deformable surface [32]. For bead/surface distances z ≪ R, GCB computed the following bead translation (V) and angular (Ω) velocities (Fig. 1b) [33]:
V = ˙γR (1 +z/R)
0.7625−0.2562 ln(z/R) (2)
Ω = γ˙
1.6167−0.4474 ln(z/R) (3)
Using Eq. (2), we obtain excellent agreement between GCB theory and our data on the control surface when setting z = 20 nm (solid lines in Fig. 3), consistent with the measured h. The results of our control experi-ment therefore match very well the predictions for a rigid sphere flowing in quasi-contact with a rigid plane.
To address the lift from the HA surfaces, we first con-sider inertial forces. Even at lowRe, it has been shown that an inertial lift force can act on a bead moving close to a wall in a linear shear flow [34, 35]. Cherukat and
McLaughlin have computed an expression for this iner-tial lift force, valid in the limitz≪R[35]:
Fin=ρR2Vr2I(ΛG, κ) (4)
where Vr = V −γ˙(R+z) is the difference between the
bead velocity and the fluid velocity at the location of the bead center of mass, andI(ΛG, κ) is given by
I=[1.7669 + 0.2885κ−0.9025κ2+ 0.507625κ3] (5)
−[3.2415/κ+ 2.6729 + 0.8373κ−0.4683κ2]Λ
G
+ [1.8065 + 0.89934κ−1.961κ2+ 1.02161κ3]Λ2G
with ΛG = ˙γ(R+z)/Vr and κ = R/(R+z). Taking
V = 900µm.s−1, κ
≃1, and ˙γ = 128 s−1, we estimate the maximum inertial lift force Fin ≃ 1.9 pN, which is lower than Fg. Therefore, inertial effects alone cannot induce lift in the range of shear rates explored here, in agreement with our control experiment.
With electrokinetic effects [36] being negligible at the ionic strength used here (see Supplemental Material and references [37, 38]), the only other mechanism that can lead to lift is due to EHD: in the presence of a thin and soft surface layer, elastic deformations induced by the pressure field in the lubricating fluid are predicted to give rise to a lift force (FEHD) on a rigid sphere [20–22]. To test whether this accounts for our observations, we start from the expression derived by Urzay et al. [22] forFEHD:
FEHD= η2R2H
0Vs2
M δ3
48π 125 +
4π(19 + 14ω) 25(1 +ω)
δ R
(6)
withηthe fluid dynamic viscosity,H0the layer thickness, M its longitudinal elastic modulus [39],δthe bead/layer distance (see Fig. 1b),Vs=V −ΩR, andω=−ΩR/V.
At a given shear rate, the steady-state value ofδis set by the balance of vertical forces on a bead:
FEHD+Fin=Fg (7)
Eq. (6) was derived for an impermeable elastic layer with a no-slip boundary condition at its surface, but holds for a poroelastic layer, under conditions onM discussed below [21, 40]. Moreover, a polymer brush in a shear flow is expected to be penetrated by the flow over a distance of orderξ, the inter-chain spacing [41–43]. We account for this by assuming the no-slip plane to lie at a distanceξ below the top of the layer (Fig. 4a inset). In the spirit of previous works on hydrodynamic interactions with finite slip length [44–48], we then replaceδbyδ+ξandH0by H0−ξ(the thickness of the layer not penetrated by the flow [49]) in Eq. (6). Similarly, we setz=δ+ξin Eqs. 2−5, and use GCB results to computeVr( ˙γ, δ),Vs( ˙γ, δ),
[image:4.612.55.300.52.174.2]FIG. 4. (a)h( ˙γ)−H0data on HA brushes (symbols as in Fig. 3, vertical scale according to arrows), and theoretical predictions
forδ( ˙γ) withM = 5 Pa (dashed line), 57 Pa (solid line), and 15000 Pa (dotted line). The shaded area around the theoretical curves is defined by the predictions obtained whenξis varied from lower to upper bound for each brush. Inset: sketch showing the location of the no-slip plane atξbelow the brush surface. (b) Theoretical (Vth)vsexperimental (Vexp) velocities (symbols
as in (a)). The solid line corresponds toVth=Vexpand the dashed line toVth = 1.2Vexp. Variations ofVth due to changes in
ξand error bars onVexpare about the symbol size. Inset: measured (symbols) and predicted (lines) deviation from linearity,
∆V =V( ˙γ)−Sγ˙, with S the slope in the limit of small shear rates. (c) Best fit values (), measured reference (
•
) andpredictions (solid line) forM as a function ofξ. Error bars correspond to the uncertainty onξ.
The resulting predictions forδare compared with the data forh−H0 in Fig. 4a. Keeping only M as an ad-justable parameter, we obtain a very good agreement be-tween the measured and computed lift, withM = 15000, 57 and 5 Pa respectively for the HA58, HA840-h and HA840-l brushes, with a marginal effect due to the un-certainty on ξ. As observed experimentally, the model predicts forces that are too low to induce lift below
˙
γ ∼10−30 s−1[50], while for larger shear rates the lift gradually increases, an effect that is augmented with de-creasing brush modulus. Eliminating the inertial term in the force balance to account only for EHD demon-strates that inertial effects become significant for ˙γ≥50 s−1, and that EHD alone accounts for about 75% of the lift observed at the highest shear rate (see Supplemental Material). Besides, the velocities predicted at the cor-responding ˙γ and δ agree to within 20% or better with the experimental data (Fig. 4b), and the non-linearity of theV( ˙γ) curves is quantitatively captured by the model (Fig. 4b inset).
Furthermore, the values of M required to reproduce the data are in agreement with previous findings on the mechanical properties of HA brushes. As for polymer gels [51], the modulus of a brush scales asM ∼1/ξ3(see Supplemental Material). From previous measurements of the mechanical response of HA brushes [27, 52], we determineMref≃100 Pa for a brush ofξref= 57 nm (see Supplemental Material and references [53, 54]). We can thus compute the expected moduli of the brushes from M =Mref/(ξ/ξref)3, and compare them to the above best fit values. As shown in Fig. 4c, we obtain a good agree-ment between the moduli, strengthening the fact that
EHD does govern the observed behaviors. Now, Mref comes from quasi-static measurements and corresponds to the “drained” value of the modulus, determined un-der conditions where water is free to flow in the brush and does not contribute to the stiffness. Evaluating the poroelastic time of the brushes, τp ∼ ηH02/(M ξ2), and the experimental time scaleτexp∼
√
δR/V [21], we find that τexp ≫τp, irrespective of the brush or flow condi-tions. Following the argument given in [21], this confirms that the drained moduli should indeed be used in Eq. (6).
In summary, our work shows how a compliant biomimetic layer affects the near-wall motion of mi-croparticles. Our observations are quantitatively sup-ported by theoretical predictions based on EHD, thus providing direct evidence of soft lubrication at play at small scales. This is likely to have significant influence on the behavior of red blood cells in blood circulation. Indeed, a RBC (R ≃ 3µm) flowing in plasma (η ≃1.5 mPa.s) under a physiological shear rate ˙γ≃100 s−1 , at a distanceδ≃0.5µm from aµm-thick glycocalyx, would experience a force FEHD ≃ 0.15 pN due to glycocalyx softness (which dominates over that of adjacent tissues, see Supplemental Material and reference [55]). From a recent study of the drift velocityvzof RBCs under shear
[12], we compute vz = βγ/˙ (R+δ)2 ≃ 3µm.s−1 at the
same δ and ˙γ, with β ≃ 0.36µm3 determined experi-mentally [12]. This translates into a lift force due to cell deformation Fcell ∼6πηRvz ≃0.25 pN. It thus appears
[image:5.612.57.567.52.216.2]mechan-5
ical role that the soft endothelial glycocalyx is likely to play in regulating cell/wall interactions in blood flow.
We acknowledge the “Emergence” and “AGIR” pro-grams of Universit´e Grenoble Alpes, the Spanish Ministry for Economy and Competiveness (project MAT2014-54867-R, to R.P.R.), the European Research Council (Starting grant 306435, to R.P.R.), the French Agence Nationale de la Recherche (Grant ANR-13-JS08-0002-01, to L.B.), and the Centre National d’Etudes Spa-tiales (CNES) for funding. We acknowledge the “Pres-tige” European program and the CNES for fellowships (H.D.). We are grateful to Liliane Coche-Guerente (De-partment of Molecular Chemistry, Grenoble) for assis-tance with surface functionalization/characterization, to Luis Yate (CIC biomaGUNE) for gold coatings, and to Gwennou Coupier (LIPhy, Grenoble) for stimulating dis-cussions regarding the lift of RBCs.
[1] Y. Wang, G. A. Pilkington, C. Dhong, and J. Frechette, Curr. Opin. Colloid Interface Sci.27, 43 (2017). [2] D. Y. C. Chan, E. Klaseboer, and R. Manica, Soft
Mat-ter5, 2858 (2009).
[3] Y. Wang, C. Dhong, and J. Frechette, Phys. Rev. Lett. 115, 248302 (2015).
[4] D. Vlassopoulos and M. Cloitre, Curr. Opin. Colloid In-terface Sci. 19, 561 (2014).
[5] T. M. Geislinger and T. Franke, Adv. Colloid Interface Sci. 208, 161 (2014).
[6] S. Leroy, A. Steinberger, C. Cottin-Bizonne, F. Restagno, L. L´eger, and ´E. Charlaix, Phys. Rev. Lett.108, 264501 (2012).
[7] R. E. Goldstein, E. Lauga, A. I. Pesci, and M. R. E. Proctor, Phys. Rev. Fluids1, 073201 (2016).
[8] Z. M. Jin and D. Dowson, Proc. Inst. Mech. Eng. J J. Eng. Tribol.219, 367 (2005).
[9] A. Kumar and M. D. Graham, Phys. Rev. Lett. 109, H318 (2012).
[10] H. Zhao, E. S. G. Shaqfeh, and V. Narsimhan, Phys. Fluids24, 011902 (2012).
[11] S. Kim, P. K. Ong, O. Yalcin, M. Intaglietta, and P. C. Johnson, Biorheology 46, 181 (2009).
[12] X. Grandchamp, G. Coupier, A. Srivastav, C. Minetti, and T. Podgorski, Phys. Rev. Lett.110, 554 (2013). [13] M. Abkarian, C. Lartigue, and A. Viallat, Phys. Rev.
Lett.88, 876 (2002).
[14] P. M. Vlahovska, T. Podgorski, and C. Misbah, C. R. Physique10, 775 (2009).
[15] D. A. Fedosov, B. Caswell, A. S. Popel, and G. E. Kar-niadakis, Microcirculation17, 615 (2010).
[16] P. Olla, Phys. Rev. Lett.82, 453 (1999).
[17] T. W. Secomb, R. Hsu, and A. R. Pries, Am. J. Physiol. 274, H1016 (1998).
[18] E. R. Damiano, B. R. Duling, K. Ley, and T. C. Skalak, J. Fluid Mech.314, 163 (1996).
[19] E. R. Damiano, D. S. Long, F. H. El-Khatib, and T. M. Stace, J. Fluid Mech.500, 75 (2004).
[20] J. Beaucourt, T. Biben, and C. Misbah, EPL67, 676 (2004).
[21] J. M. Skotheim and L. Mahadevan, Phys. Fluids 17, 092101 (2005).
[22] J. Urzay, S. G. Llewellyn Smith, and B. J. Glover, Phys. Fluids19, 103106 (2007).
[23] B. Rallabandi, B. Saintyves, T. Jules, T. Salez, C. Sch¨onecker, L. Mahadevan, and H. A. Stone, Phys. Rev. Fluids2(2017).
[24] B. Saintyves, T. Jules, T. Salez, and L. Mahadevan, Proc. Natl. Acad. Sci. USA113, E8208 (2016).
[25] J. Raedler and E. Sackmann, Langmuir8, 848 (1992). [26] J. Schilling, K. Sengupta, S. Goennenwein, A. R. Bausch,
and E. Sackmann, Phys. Rev. E69, 199 (2004). [27] S. Attili, O. V. Borisov, and R. P. Richter,
Biomacro-molecules13, 1466 (2012).
[28] E. Migliorini, D. Thakar, R. Sadir, T. Pleiner, F. Baleux, H. Lortat-Jacob, L. Coche-Guerente, and R. P. Richter, Biomaterials35, 8903 (2014).
[29] M. Orlishausen, L. Butzhammer, D. Schlotbohm, D. Zapf, and W. K¨ohler, Soft Matter13, 7053 (2017). [30] A. Albersd¨orfer and E. Sackmann, Eur. Phys. J. B10,
663 (1999).
[31] J. N. Israelachvili,Intermolecular and surface forces, 3rd ed. (Academic Press, Amsterdam, 2011).
[32] A. J. Goldman, R. G. Cox, and H. Brenner, Chem. Eng. Sci.22, 653 (1967).
[33] Numerical coefficients slightly differ from the original for-mula by GCB. We have fitted the values tabulated in reference [32] and found that the present set of coeffi-cients yields a better agreement than those provided in the original publication.
[34] G. P. Krishnan and D. T. Leighton Jr., Phys. Fluids7, 2538 (1995).
[35] P. Cherukat and J. B. Mclaughlin, J. Fluid Mech.263, 1 (1994).
[36] S. G. Bike, L. Lazarro, and D. C. Prieve, J. Colloid Interface Sci.175, 411 (1995).
[37] S. M. Tabatabaei, T. G. M. van de Ven, and A. D. Rey, J. Colloid Interface Sci.301, 291 (2006).
[38] J. M. Nielsen, A. W. Adamson, and J. W. Cobble, J. Am. Chem. Soc.74, 446 (1952).
[39] M =E(1−ν)/[(1+ν)(1−2ν)], withEthe Young modulus
andνthe Poisson ratio.
[40] A. Gopinath and L. Mahadevan, Proc. R. Soc. B467, 1665 (2011).
[41] J. L. Harden, O. V. Borisov, and M. E. Cates, Macro-molecules30, 1179 (1997).
[42] T. Lee, S. C. Hendy, and C. Neto, Macromolecules45, 6241 (2012).
[43] M. Deng, X. Li, H. Liang, B. Caswell, and G. E. Karni-adakis, J. Fluid Mech.711, 192 (2012).
[44] A. A. Potanin and W. B. Russel, Phys. Rev. E52, 730 (1995).
[45] J. Lee and A. J. C. Ladd, Phys. Fluids14, 1631 (2002). [46] J. Baudry, E. Charlaix, A. Tonck, and D. Mazuyer,
Langmuir17, 5232 (2001).
[47] C. Cottin-Bizonne, S. Jurine, J. Baudry, J. Crassous, F. Restagno, and E. Charlaix, Eur. Phys. J. E 9, 47 (2002).
[48] E. Charrault, T. Lee, C. D. Easton, and C. Neto, Soft Matter12, 1906 (2016).
(1984).
[50] From the force balance and Eq. (6), the shear rate ˙
γc above which lift sets in is such that Vs( ˙γc, ξ) ∼
p
FgM ξ3/(η2R2(H0−ξ)).
[51] M. Rubinstein and R. H. Colby,Polymer physics(Oxford University Press, Oxford, 2003) p. 259.
[52] S. Attili and R. P. Richter, Soft Matter9, 10473 (2013). [53] E. Gacoin, C. Fretigny, A. Chateauminois, A. Perriot,
and E. Barthel, Tribol. Lett.21, 245 (2006).
[54] K. L. Johnson,Contact Mechanics (Cambridge Univer-sity Press, Cambridge, 1985) pp. 104–105.
Elastohydrodynamic lift at a soft wall
Supplemental Material
Heather S. Davies,1Delphine D´ebarre,1Nouha El Amri,1Claude Verdier,1Ralf P. Richter,2, 3,∗and Lionel Bureau1,†
1
Univ. Grenoble Alpes, CNRS, LIPhy, 38000 Grenoble, France
2
School of Biomedical Sciences, Faculty of Biological Sciences,
School of Physics and Astronomy, Faculty of Mathematics and Physical Sciences, Astbury Centre for Structural Molecular Biology, University of Leeds, Leeds LS2 9JT, UK
3
CIC biomaGUNE, Paseo Miramon 182, 20014 San Sebastian, Spain
I. RICM SETUP AND DATA ANALYSIS
RICM images were acquired on a modified inverted microscope (IX71 Olympus, Japan). Custom-built illumination incorporated an incoherent white-light source (HPLS345, Thorlabs), a green/red dual-band interference filter (FF01-534/635-25, Semrock, USA) and a calibrated aperture diaphragm (Thorlabs). Illumination light was reflected on a broadband polarizing beamsplitter cube (Thorlabs), passed through a precision broadband quarter-waveplate (Fichou, France) and was focused onto the sample using a super-apochromatic objective (UPLSApo 60XO, Olympus, Japan). Reflected light was collected through the same objective, passed a second time through the quarter-waveplate and was then transmitted through the polarizing cube, allowing separation from the incoming light. The RICM signal was then imaged on a sCMOS camera (ORCA-Flash 4.0 V2, Hamamatsu, Japan) using relay lenses (ITL200, Thorlabs) and dichroic beamsplitters and filters to separate the green and red images (FF560-FDi01-25x36, FF01-531/46-25 and FF01-629/56-25, Semrock, USA). In order to accommodate for fast displacement of the beads at high shear rates, both images were acquired simultaneously on different regions of the camera.
Analysis of the RICM pattern was performed as follows: the radially symmetrical pattern was azimuthally averaged to obtain an intensity curve as a function of the distance rto the bead lowest point. This curve can then be fitted with the following function:
I(r) =A1exp
−w2r2
1 +A2exp
−w2r2
2 cos(4πnbuffer
λ (hmeas+δh(r))) (S1)
where A1, w1, A2 and w2 account for the amplitude of the signal and the fringes, and their empirical decrease due to spatial and temporal decoherence and reflection on the top surface of the bead [1]. nbuffer is the refractive index of the liquid medium, andδh(r) accounts for the change in optical distance between the bead and the coverslip as a function of the radial coordinate, withδh(r= 0) = 0.
Finally, hmeas incorporates both the optical distance between the lowest point of the bead and the top of the gold layer, and the phase shifts of the effective reflection and transmission coefficients of the gold layer resulting from multiple reflections at its boundaries, affecting both the effective reflection of the gold layer and that of the bead (multiple reflections at the surface of the bead are negligible due to the small value of the reflection coefficient (<1%)). Being highly sensitive to the exact gold layer thickness, such shifts are difficult to evaluate precisely. However, because the different phase terms add linearly, the resulting phase offset can be determined experimentally from the difference betweenhmeasvalues measured in the presence and in the absence of the HA brush. To this aim, beads were added to a surface functionalized with the streptavidin monolayer prior to the addition of end-biotinylated HA, and RICM patterns were analyzed for∼20 beads to obtain a reference valuehoff. This reference was subsequently subtracted from hmeas obtained in the presence of the HA brush to compute the height of the bead with respect to the bottom of the HA brush. The optical contribution of the brush was neglected in this calculation due to its very low density, corresponding to refractive index changes of≈10−4 [2].
From equation (S1), it appears that the RICM pattern is identical for all heightshmeasseparated byλ/(2nbuffer)≈ 200 nm. In order to determine the correct height of the bead, two illumination wavelengthsλ1andλ2are used, thereby limiting the ambiguity to height values separated byλ1λ2/(2nbuffer(λ2−λ1)). Here λ1 = 532 nm andλ2 = 635 nm, and hence λ1λ2/(2nbuffer(λ2−λ1)) ≈ 1.2µm [3]. Below this height, dual-colour RICM patterns can be analyzed unambiguously.
Only beads separated by about 10 radii or more from their closest neighbors were analyzed in our study, in order to avoid hydrodynamic coupling between beads and collective effects.
II. ESTIMATION OF INTER-CHAIN AVERAGE DISTANCEξ
In a previous study [4], we have shown that force/distance curves measured by colloidal-probe AFM on HA brushes at sufficiently high ionic strength could be quantitatively described by self consistent field theory (SCFT) of neutral polymer brushes (by treating the screened electrostatic interactions as an enhanced effective excluded volume), from which the molecular parameters of the brushes could be retrieved. We use the same framework here in order to deduce
ξfrom the brush heightH0. According to SCFT, the relationship between these two quantities reads [4]:
H0=
8
π2
1/3pν
bξ2
1/3
lc (S2)
wherelc is the contour length of the chains,b= 1.0 nm is the size of the monomer,ν is the excluded volume, and p is a non-dimensional chain stiffness parameter.
The contour length of the chains are deduced from their molecular weightMw, withM0= 378 g.mol−1the monomer molar mass: lc =bMw/M0. This yieldslc ≃2220±160 nm for HA840, andlc ≃155±8 nm for the HA58 sample. Using the previous determination of (pν/b)1/3≃3.45±0.2 nm2/3 [4], we then computeξfromH
0with Eq. (S2) and obtain the values reported in the main text, with the uncertainty on ξ associated with the error bars on the above parameters.
III. MAGNITUDE OF ELECTROVISCOUS EFFECTS
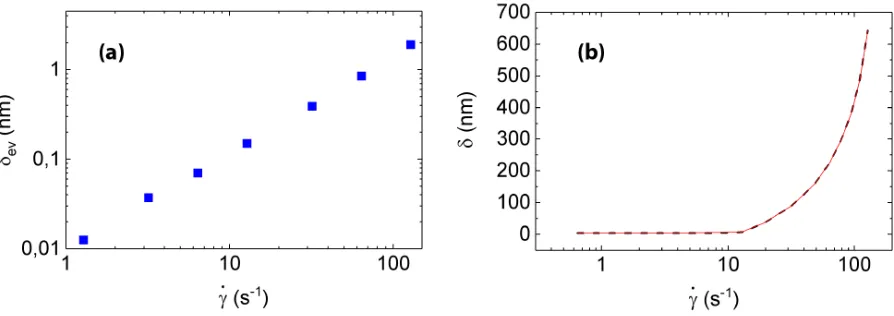
It is known that electrokinetic effects may give rise to repulsive interaction forces under flow when two electrically charged surfaces are moving past each other in an electrolyte solution [5]. In order to ensure that such a phenomenon is negligible in our study, we use a recently developed theory to compute the expected electroviscous lift forces under our experimental conditions. Tabatabaei et al. [6] have derived the following expression for the electroviscous lift force Fev acting between a charged planar surface and a charged bead translating and rotating at a small distance from the wall :
Fev= 48π
25 R 2c
∞kT ε4Pe2
δ R
−2
(Gp+SHp+Gw+SHw)2(1−ω)2−α[(Gp+SHp)2−(Gw+SHw)2](1−ω2)
(S3) withR the bead radius,δ the bead/surface distance,c∞ the bulk number density of ions, kT the thermal energy,ε
the ratio of the Debye length to the bead radius,S=D1/D2 the ratio of the diffusion coefficients of the counterions (D1, positive species for a negatively charged surface) and the co-ions (D2), and the coefficient α ≈ −1.667. The Peclet number is defined as Pe =RV /D1, withV the bead translational velocity. As in the main text, ω=−RΩ/V, with Ω the rotation speed. The quantitiesGi andHi are defined as:
Gi = ln
1 +e−ψ˜i/2
2 , Hi= ln
1 +eψ˜i/2
2 (S4)
wherei= (w, p) stands for wall and particle. The reduced surface potentials ˜ψi are such thatψi= ˜ψikT /(ze), with
ethe elementary charge,z the ion valence, andψi the surface potentials.
We takeD1= 1.33×10⁻⁹ m2.s−1 andD2= 2×10⁻⁹ m2.s−1 for the Na+ and Cl− ions, respectively [7].
From the effective surface charge density of HA brushes computed in reference [4], we can estimate the polymer layers studied here to carry a negative charge density in the range σ = 6×10⁻⁵−8×10⁻⁴ C.m−2. At a NaCl concentration of 150 mM, hence a Debye length of λD = 0.8 nm, this translates into a brush surface potential of
ψw≃σλD/(ǫrǫ0) between -0.07 and -1 mV. Besides, we assume a typical value ofψp=−50 mV for the polystyrene beads.
S3
FIG. S1. (a) Predicted lift due to electrokinetic effects only (δev), as a function of ˙γ. Results obtained forψw =−0.07 and
-1 mV cannot be distinguished. (b) Comparison of the lift predicted by accounting (dashed line) or not (red solid line) for electrokinetic effects in the total force balance.
IV. MODELING ASSUMPTIONS AND BRUSH DEFORMATION
As mentioned in the main text, the HA brushes placed in a shear flow are expected to be penetrated by the flow over a thickness of order ξ. A full EHD modeling of our experimental results would therefore require a theory describing the motion of a bead driven by a linear shear flow in the vicinity of a poroelastic layer. In the absence of such a theory, we rely on a set of simplifying assumptions in order to adapt the existing EHD framework to the situation of interest here:
(i) We consider that the expression derived by Urzay et al. [9] for the lift forceFEHD, reproduced below, holds for a poroelastic layer, as discussed qualitatively in references [10, 11].
FEHD=
η2R2H 0Vs2
M δ3
48π
125 +
4π(19 + 14ω) 25(1 +ω)
δ R
(S5)
(ii) We assume that the layer thickness isH0−ξ. This implies, as done in previous studies [12], that the hydrody-namic thickness of the polymer layer is the relevant one.
(iii) Consistently with (ii), we assume that the relevant bead/surface distance inFEHDisδ+ξ. We thus treat the penetration lengthξas an effective slip length, as done in a previous theoretical analysis of squeeze flow with polymer brushes [13], and make the simple hypothesis that the lubrication force between the surfaces in the presence of slip can be computed from the no-slip case by merely shifting the sphere/wall distance byξ. Such an approximation has been used in several earlier works [14–16], and has been found to hold even for small sphere/wall distances [16]. We note that the hydrodynamic brush thickness,H0−ξ, is always smaller than
p
2R(δ+ξ) for the three brushes studied (the ratio (H0−ξ)/
p
2R(δ+ξ) is found to lie in the range 0.04-0.25 for the various brushes/flow strengths). Such a condition corresponds to the thin film limit for which Eq. (S5) has been derived, which validates our use of Eq. (S5) to analyze our data.
(iv) We rely on Goldman-Cox-Brenner (GCB) theory in order to compute the bead translation (V) and rotation (Ω) velocities as a function of the imposed shear rate ˙γ. As in (iii), we further assume that the relevant bead/wall distance isδ+ξ. Using numerical results obtained by Damiano et al. [17], who computedV and Ω for a bead flowing past a porous layer of permeabilityξ2, we have checked that our assumption is indeed consistent with their results. Assumption (iv) accounts only for a finite slip length, but does not take into consideration any effect of the layer deformability on velocities. However, based on a recent theoretical work addressing the role of an elastic layer on the drag and rotation of a sliding cylinder [18], we expect corrections toV and Ω due to elasticity to be of order Λ2≃5% (with Λ≃ηγH˙ 0R3/2/(M δ5/2)),i.e. to remain small compared to the case of rigid bodies treated by GCB.
This set of assumptions allows us to capture quantitatively the observed variations ofδwith ˙γ. The model is robust and only weakly sensitive to the exact value ofξ, which can be varied between its upper and lower bounds without compromising the agreement between experimental data and predictions.
[image:10.612.88.535.53.211.2]FIG. S2. (A)δ vsγ˙ measured on HA840-h brush (), predicted withM = 57 Pa andξ= 74 nm (solid line),M = 57 Pa and
[image:11.612.87.536.53.200.2]ξ= 0 (dash-dotted line),M = 120 Pa and ξ= 0 (dashed line),M = 57 Pa andξ= 74 nm without inertial force (blue dotted line). (B) data for HA840-l brush (), prediction forM = 5 Pa andξ= 130 nm (solid line),M= 5 Pa andξ= 0 (dash-dotted line),M = 12 Pa andξ= 0 (dashed line). (C) data for HA58 brush (
•
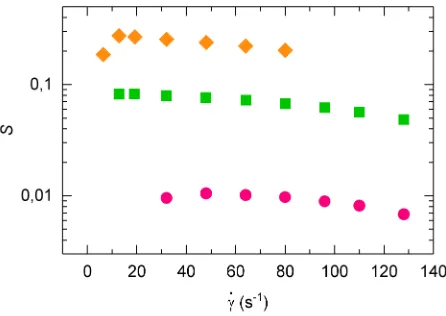
), prediction for M = 15000 Pa andξ= 10 nm (solid line),M = 15000 Pa andξ= 0 (dash-dotted line),M= 30000 Pa andξ= 0 (dashed line).FIG. S3. Brush strainS vsγ˙ computed for the HA840-h (), HA840-l (), and HA58 (
•
) brushes.even at the largest shear rates.
For the sake of completeness, we also illustrate in Fig. S2 the effect of setting the slip length to zero in the model (i.e.assuming an elastic and impermeable layer with a no-slip condition at its surface). It can be seen that, keeping the elastic modulus constant, the predicted values of δ lie, as expected, above those obtained with a slip length of
ξ. We can however predict the correct trend and magnitude for the lift at large shear rates by using a modulus approximately twice as large as the one needed with finite slip. Still, we observe that the no-slip assumption does not capture the low shear rate regime, where the model overestimates the lift. Overall, we expect the no-slip case and the simple slip-length model to represent respectively an upper and lower limit of the predictions that a full poroelastic treatment would yield.
Finally, we estimate the maximum brush strain,S, induced by EHD. Following reference [9], this strain, defined as the maximum deflection of the surface divided by the thickness of the unperturbed layer, is given by:
S=ηR
1/2V(1 +ω)
M δ3/2 (S6)
It can be seen on Fig. S3, where we plotS( ˙γ), that the typical strain of the brush due to EHD is below 1, 10 and 30% for the HA58, HA840-h and HA840-l respectively. As shown in the next section, the mechanical response of HA brushes can be described with a constant elastic modulus up to strains of∼30%, suggesting that non-linear elasticity can be neglected for the three samples studied, including the softest one.
[image:11.612.197.420.274.432.2]S5
with FEHD ∼ η2R2H0Vs2/(M δ3). Combining these two relationships with Eq. S6, we can rewrite the strain as
S ∼p
Fg/(M RH0), which thus appears to be constant and independant of Vs, hence of ˙γ. Furthermore, using the same simplified analysis, we note that the lift can be expressed asδ3
∼η2V2
sS2R/M2. This shows that, as the flow strength is increased, the lift increases due to its dependence onVs, whileS is essentially constant.
V. ESTIMATION OF THE LONGITUDINAL ELASTIC MODULI OF THE BRUSHES
We first come back on the analysis of the force/distance curves (F(h), see Fig. S4a) of HA brushes reported in reference [4]. We note that the contact mechanics situation involved in the colloidal-probe AFM-RICM experiments reported in [4] corresponds to that described by Johnson as the “elastic foundation model”, for which the relationship between force (F) and indentation of the layer (H0−h) is predicted to be [19]:
F =πM(H0−h) 2R
H0
(S7)
withRthe bead radius andM the longitudinal modulus of the elastic layer [20].
In Fig. S4b, we have plotted F(H0−h) from a dataset taken from [4], measured on a HA brush of ξref= 57 nm andH0= 590 nm immersed in a 150mM NaCl solution. It can be seen on the double-logarithmic scale of the figure that, for (H0−h).200 nm, the experimental curve exhibits a regime whereF increases as (H0−h)2. Fitting this quadratic regime with Eq. (S7) yieldsMref≃100 Pa, in excellent agreement with the outcome of a slightly different analysis proposed previously for these HA brushes [21].
FIG. S4. (a) Sketch of brush of unperturbed thickness H0 compressed to a thickness h upon application of a force F on
the bead. (b) Experimental dataF(H0−h) (), fit of the quadratic regime (red solid line) using Eq. (S7), and predictions
according to Eq. (S8) withH0= 590 nm andξ= 57 nm (green dashed line).
We now derive the expected scaling for M as a function of ξ. Within the Alexander-deGennes model of polymer brushes, which describes the mechanical response of our systems reasonably well (Fig. S4b), we expectF(h) to be given by [4]:
F ≃RH0kT ξ3
"
7
H
0
h
5/4
+ 5
h
H0
7/4
−12
#
(S8)
Equating expressions (S7) and (S8), we obtain for the elastic modulus, in the limit of small deformationsh/H0→1, and dropping numerical prefactors:
M ∼ kT
ξ3 (S9)
[image:12.612.141.478.333.483.2]VI. EFFECT OF SUBSTRATE ELASTIC PROPERTIES
We have shown in section IV and V above that our experiments on HA brushes need to be analyzed within the thin film limit, for which Eqs. (S5) and (S7) have been derived, in order to account for the finite brush thickness and the geometrical constraint due to its grafting on the underlying substrate. Now, in order to determine to what extent the mechanical properties of the substrate underlying the HA brush could also affect the EHD interactions, we use the criterion derived by Leroy and Charlaix in their theoretical analysis of non-contact probing of thin elastic films [23]. They have shown that, for a film of thicknessH0 and elastic modulusE placed on a substrate of modulusEs, the substrate contributes to less than 1% of the lubrication forces provided that:
H0&2
E Es
1/3√
Rδ (S10)
TakingR= 12.5µm andEs≃60 GPa for the glass substrate, we compute the right-hand-side of Eq. (S10) to be at most 2–10 nm for the three HA brushes, showing that the contribution of the glass substrate is negligible in our experiments.
If we now estimate the same criterion for a blood cell ofR ∼3µm flowing at a distance of 500 nm from a 50 Pa glycocalyx bound to an endothelium of modulusEsof about 10 kPa, we find that the glycocalyx properties make the dominant contribution to EHD interactions forH0&500 nm. This suggests that, even under the in vivoconditions of blood microcirculation, EHD interactions due to wall compliance are entirely controlled by the softness of the
µm-thick glycocalyx.
[1] J. Raedler and E. Sackmann, Langmuir8, 848 (1992).
[2] Computed from the typical refractive index increment for HA aqueous solutions, dn/dc≃0.15 mL.g−1
, using an average weight concentration in the HA brush of c≃Mw/(NAξ
2
H0)≃0.6 mg.mL− 1
for the HA840-h brush (NA is Avogadro’s
number). Such a low effect of the HA chains on the buffer refractive index is also the reason why we can neglect van der Waals forces between the beads and the brush surface. Indeed, following reference [24], a difference of 10−4
between the refractive indices of the brush and the buffer would result in a Hamaker constant for the polystyrene/buffer/brush system of about 3×10⁻²⁴
J. This is several orders of magnitude smaller than the thermal energy that controlse.g.chain fluctuations, and corresponds to attractive bead/brush forces that become significant and comparable to the gravity force for distances smaller than∼1 nm,i.e.smaller than the Debye length.
[3] J. Schilling, K. Sengupta, S. Goennenwein, A. R. Bausch, and E. Sackmann, Phys. Rev. E69, 199 (2004). [4] S. Attili, O. V. Borisov, and R. P. Richter, Biomacromolecules13, 1466 (2012).
[5] S. G. Bike, L. Lazarro, and D. C. Prieve, J. Colloid Interface Sci.175, 411 (1995).
[6] S. M. Tabatabaei, T. G. M. van de Ven, and A. D. Rey, J. Colloid Interface Sci.301, 291 (2006). [7] J. M. Nielsen, A. W. Adamson, and J. W. Cobble, J. Am. Chem. Soc.74, 446 (1952).
[8] A. J. Goldman, R. G. Cox, and H. Brenner, Chem. Eng. Sci.22, 653 (1967).
[9] J. Urzay, S. G. Llewellyn Smith, and B. J. Glover, Phys. Fluids19, 103106 (2007). [10] J. M. Skotheim and L. Mahadevan, Phys. Fluids17, 092101 (2005).
[11] A. Gopinath and L. Mahadevan, Proc. R. Soc. B467, 1665 (2011).
[12] M. A. C. Stuart, F. H. W. H. Waajen, T. Cosgrove, B. Vincent, and T. L. Crowley, Macromolecules17, 1825 (1984). [13] A. A. Potanin and W. B. Russel, Phys. Rev. E52, 730 (1995).
[14] J. Lee and A. J. C. Ladd, Phys. Fluids14, 1631 (2002).
[15] J. Baudry, E. Charlaix, A. Tonck, and D. Mazuyer, Langmuir17, 5232 (2001).
[16] C. Cottin-Bizonne, S. Jurine, J. Baudry, J. Crassous, F. Restagno, and E. Charlaix, Eur. Phys. J. E9, 47 (2002). [17] E. R. Damiano, D. S. Long, F. H. El-Khatib, and T. M. Stace, J. Fluid Mech.500, 75 (2004).
[18] B. Rallabandi, B. Saintyves, T. Jules, T. Salez, C. Sch¨onecker, L. Mahadevan, and H. A. Stone, Phys. Rev. Fluids 2
(2017).
[19] K. L. Johnson, “Contact Mechanics,” Cambridge University Press, Cambridge (1985).
[20] Note thatM is the correct modulus to take into account [25] as long as the brush can be considered as mechanically confined by the probe,i.e.H0 .
p
2R(H0−h) , which is indeed the case here in the rangeH0−h= 20−200 nm where
the quadratic regime is observed.
[21] S. Attili and R. P. Richter, Soft Matter9, 10473 (2013).
[22] M. Rubinstein and R. H. Colby,Polymer physics(Oxford University Press, 2003). [23] S. Leroy and E. Charlaix, J. Fluid Mech.674, 389 (2011).