White Rose Research Online URL for this paper:
http://eprints.whiterose.ac.uk/118285/
Version: Accepted Version
Article:
Cabry, Christopher Patrick, D'Andrea, Lucia, Shimizu, Karina et al. (6 more authors) (2017)
Exploring the bulk-phase structure of ionic liquid mixtures using small-angle neutron
scattering. FARADAY DISCUSSIONS. ISSN 1364-5498
https://doi.org/10.1039/C7FD00167C
[email protected]
Reuse
Items deposited in White Rose Research Online are protected by copyright, with all rights reserved unless
indicated otherwise. They may be downloaded and/or printed for private study, or other acts as permitted by
national copyright laws. The publisher or other rights holders may allow further reproduction and re-use of
the full text version. This is indicated by the licence information on the White Rose Research Online record
for the item.
Takedown
If you consider content in White Rose Research Online to be in breach of UK law, please notify us by
This is an
Accepted Manuscript
, which has been through the
Royal Society of Chemistry peer review process and has been
accepted for publication.
Accepted Manuscripts
are published online shortly after
acceptance, before technical editing, formatting and proof reading.
Using this free service, authors can make their results available
to the community, in citable form, before we publish the edited
article. We will replace this
Accepted Manuscript
with the edited
and formatted
Advance Article
as soon as it is available.
You can find more information about
Accepted Manuscripts
in the
Information for Authors
.
Please note that technical editing may introduce minor changes
to the text and/or graphics, which may alter content. The journal’s
standard
Terms & Conditions
and the
Ethical guidelines
still
apply. In no event shall the Royal Society of Chemistry be held
responsible for any errors or omissions in this
Accepted Manuscript
or any consequences arising from the use of any information it
contains.
Accepted Manuscript
Faraday
Discussions
Faraday
Discussions
Royal Society of
Chemistry
This manuscript will be presented and discussed at a forthcoming Faraday Discussion meeting.
All delegates can contribute to the discussion which will be included in the final volume.
Register now to attend!
Full details of all upcoming meetings:
http://rsc.li/fd-upcoming-meetings
This is an
Accepted Manuscript
, which has been through the
Royal Society of Chemistry peer review process and has been
accepted for publication.
Accepted Manuscripts
are published online shortly after
acceptance, before technical editing, formatting and proof reading.
Using this free service, authors can make their results available
to the community, in citable form, before we publish the edited
article. We will replace this
Accepted Manuscript
with the edited
and formatted
Advance Article
as soon as it is available.
You can find more information about
Accepted Manuscripts
in the
Information for Authors
.
Please note that technical editing may introduce minor changes
to the text and/or graphics, which may alter content. The journal’s
standard
Terms & Conditions
and the
Ethical guidelines
still
apply. In no event shall the Royal Society of Chemistry be held
responsible for any errors or omissions in this
Accepted Manuscript
or any consequences arising from the use of any information it
contains.
Accepted Manuscript
This article can be cited before page numbers have been issued, to do this please use: C. Cabry, L. D'Andrea, K. Shimizu, I. Grillo, P. Li, S. E. Rogers, D. W. Bruce, J. N. Canongia Lopes and J. M. Slattery, Faraday Discuss., 2017, DOI:
Journal Name
ARTICLE
Received 00th January 20xx, Accepted 00th January 20xx
DOI: 10.1039/x0xx00000x
www.rsc.org/
Exploring the bulk-phase structure of ionic liquid mixtures using
small-angle neutron scattering
Christopher P. Cabry,aLucía D’Andrea,aKarina Shimizu,bIsabelle Grillo,cPeixun Li,dSarah Rogers,d
Duncan W. Bruce,*aJosé N. Canongia Lopes*b,eand John M. Slattery*a
Small-angle neutron scattering experiments, supported by molecular dynamics simulations, have been performed on a range of compositions of the [C2mim]1-x[C12mim]x[Tf2N] ionic liquid mixture system. Isotopic contrast variation, through selective
deuteration of both cations, has been used to assist in fitting the data to different scattering models. These data, and subsequent fitting, show that the structure of the ionic liquid mixtures changes substantially as a function of composition. Mixtures wherex< 0.32 are dominated by aggregates of amphiphilic [C12mim]+ions in the relatively polar [C2mim][Tf2N]
solvent. Compositions wherex> 0.32 can be described as bicontinuous, containing networks of both polar and non-polar domains, where the C12 chains of the [C12mim]+ions percolate through the system to form a continuous non-polar
sub-phase. Temperature-dependent scattering experiments suggest that there is relatively little change in bulk structure in these liquids between 20 and 60oC. The presence of water, however, does influence some aspects of the liquid structure in a
composition that is rich in [C2mim][Tf2N] (wherex= 0.24).
Introduction
Ionic liquids (ILs) are materials that melt below 100 oC and are entirely composed of anions and cations. The benefits of ILs
stem from their remarkable properties, including their negligible vapour pressure, large liquid range and high thermal stability. This has resulted in their adoption in a wide range of areas. ILs are often referred to as designer solvents due to the simplicity of changing their properties by altering the structure of the anion, cation, or both. This has led to large libraries of ILs being synthesised with the aim of achieving specific properties. A simpler, potentially greener, alternative methodology is to mix two, or more, ILs together to produce a range of IL mixtures with different properties.1, 2This has the potential to minimise the amount of
synthetic work needed to screen a range of ILs with different properties for a particular application. Although the structure of ILs is an intense research area, mixtures of ILs have received less attention. One of the most intensively studied ILs are imidazolium-based, including the materials discussed in this contribution, 1-alkyl-3-methylimidazolium salts. These are abbreviated as [Cnmim][X], wherenis the alkyl-carbon number and X the anion.
A range of models have been used to describe IL bulk structure, including ion pairs,3-6hydrogen-bonded networks,7-16ion
clusters,17-19and self-assembled nanoscale structuring.1, 20-29The most appropriate model is strongly related to the type of IL under
study, as there are many distinct classes. Indirect evidence from viscosity, conductivity and Raman spectroscopy proposed long-range ordering in ILs from as early as 2000.20, 30, 31Since then, the structure of ILs has been an intense research area with several
reviews on their bulk structure having being written.7, 8, 32-35
Early molecular dynamics (MD) simulations postulated the formation of nanostructure within several different systems of [Cnmim][X].21, 23-25When alkyl chains were sufficiently long the chains were observed to aggregate to form alkyl-chain domains.24,
25Originally it was reported that nanoscale ordering was only due to alkyl chain aggregation, while the imidazolium head groups
in these ILs were distributed homogeneously.25However, an atomistic simulation of [C
nmim][PF6] introduced the concept of
head-group aggregation to form continuous polar domains, alongside the non-polar sub-phase formed by the alkyl chains.26Scattering
patterns were derived from several simulations and predicted the appearance of a low-qpeak due to alkyl chain aggregation. ILs frequently display three peaks in small-angle scattering experiments: A peak at higher-q(~ 13 nm-1) that relates to characteristic
close-contact separations between ions, the so-called contact peak (CP); a peak at intermediate-q(~ 8 nm-1) that relates to the
a.Department of Chemistry, University of York, Heslington, York YO10 5DD, UK. b.Centro de Química Estrutural, IST, Universidade de Lisboa, 1049-001 Lisboa, Portugal. c.ILL, 71 Avenue des Martyrs, CS 20156-38042, Grenoble Cedex 9, France.
d.ISIS, Science & Technology Facilities Council, Rutherford Appleton Laboratory, Chilton, UK e.ITQB, Universidade Nova de Lisboa, Avenida República, 2780-157 Oeiras, Portugal.
Electronic Supplementary Information (ESI) available: Includes full s ynthetic details. See
Faraday
Discussions
Accepted
Manuscript
Published on 26 June 2017. Downloaded by University of York on 26/06/2017 13:43:48.
View Article Online
average distances between ions of the same charge, the ‘charge ordering peak’ (COP) and a peak at lower-q(~ 2.5 nm-1) that is
[image:4.595.215.436.98.244.2]related to ion-ion distances separated by the non-polar network, the ‘polar/non-polar peak’ (PNPP) (Figure 1).36
Figure 1: Small-angle X-ray scattering data for [C12mim][Tf2N] showing the three peaks (CP, COP and PNPP) commonly seen in nanostructured ILs. Cation head groups are
represented as red circles, anions as blue circles and alkyl chains as grey ellipses.
The PNPP was first identified experimentally by Triolo et al. by X-ray diffraction studies,37and reported subsequently by many
others afterwards.22, 38A dependence of the correlation distance on alkyl chain length (PNPP position) is observed, and as the chain
length increases the peak sharpens, its intensity increases, and it moves to lower q(longer distance). This is rationalised as the alkyl chains segregating from the polar imidazolium head and the anion. The alkyl chains do not fully interdigitate and create domains of alkyl chains and domains of charged imidazolium rings and anions. X-ray diffraction studies on liquid-crystalline ILs (LCILs) in their liquid crystalline and isotropic states indicate that the structural ordering is similar in both, with the low-qpeak intensity decreasing upon the transition into the isotropic phase. This was concluded as being due to the strong alignment effect of the liquid crystal phase being lost and not an intrinsic structural change.39, 40
Small-angle neutron scattering (SANS) techniques have been utilised to further investigate IL structure.27, 41, 42These tend to
agree with the notion that the PNPP is due to nanostructuring in the liquid. However, some contributions put forward an argument that the PNPP does not arise from nanoscale ordering, but is simply derived from a second-shell radial distribution.27, 43The PNPP
observed in SANS studies agrees with the data obtained from X-ray measurements, in that the peak increases in intensity, sharpens and the correlation distance gets longer upon increasing alkyl chain length.27
The structures of IL mixtures are significantly less well understood than pure ILs.1, 40, 42Small angle X-ray scattering (SAXS) has
been used to study binary IL mixtures of [C1mim][Tf2N] and [C12mim][Tf2N].42 Low concentrations of [C12mim][Tf2N] in
[C1mim][Tf2N] have been modelled as pseudospherical aggregates which do not interact with each other, while at higher
concentrations the system has been described using a model based on hard-sphere interacting pseudospherical aggregates. A similar model has been used on a related system where solid [Cnmim][Cl] (n= 14, 16, 18) was dissolved in liquid [Cnmim][FeCl4] (n
= 1, 2).44These data suggest that IL structure in some binary IL mixtures may depend strongly on composition.
In a recent study, it was shown that both the bulk and surface properties of the IL mixture system [C2mim]1-x[C12mim]x[Tf2N],
which contains an IL with a relatively amphiphilic cation, [C12mim][Tf2N], dissolved in a relatively polar IL, [C2mim][Tf2N], behave
in a non-ideal way as the composition of the mixture changes.45Using a range of experimental and computational approaches,
including preliminary SANS data for a small selection of compositions and one isotopic contrast, it was possible to relate this non-ideal behaviour to the surface and bulk structure of these mixtures. The present paper describes the results of a comprehensive SANS study on the [C2mim]1-x[C12mim]x[Tf2N] system, including a full range of compositions and various isotopic contrasts, detailed
fitting of these data to several scattering models and analysis of new MD simulations that aid in the interpretation of the SANS data. This analysis brings new insights into the scattering models that are most appropriate for this system, explores the liquid structure of mixtures with lower [C12mim][Tf2N] concentrations (x< 0.52) in more detail and explores the dependence of the IL
structure on both temperature and added water.
Results and discussion
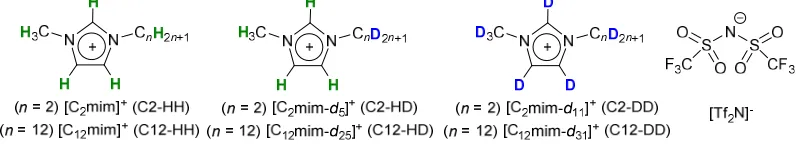
In order to provide contrast between the different components of the IL mixtures, several isotopically labelled ILs were synthesised, as described in the ESI and shown in Figure 2. SANS experiments were performed on a range of mixtures of these selectively deuterated ILs and a full list of contrasts, compositions and selected experimental conditions is given in Table 1. The discussion below will begin by giving an overview of the scattering models used to fit the SANS data, after which the fitting results and the physical interpretation of these, supported by analysis of the MD simulations, will be presented for three compositional ranges of the [C2mim]1-x[C12mim]x[Tf2N] mixtures: Firstly, low concentrations of [C12mim][Tf2N] for which,x
aggregates of [C12mim]+ions are found within the [C2mim][Tf2N S x
Faraday
Discussions
Accepted
Manuscript
Published on 26 June 2017. Downloaded by University of York on 26/06/2017 13:43:48.
View Article Online
bulk-phase structure of the mixtures changes from isolated aggregates of [C12mim]+ions to a bicontinuous network structure.
Thirdly, higher concentrations of [C12mim][Tf2N],x> 0.52, where the liquid structure resembles that of pure [C12mim][Tf2N] and
[image:5.595.99.497.116.188.2]nano-segregation of the polar and non-polar parts of the mixture to form a continuous non-polar sub-phase can be seen.
Figure 2: The chemical structures of the ions used in this study, their degree of deuteration and the naming system used for different ions.
Table 1: Details of the mixtures and contrasts used in the SANS studies.
Isotopic contrast Compositions Temperature (oC) Other details
[C2mim-d11]1-x[C12mim]x[Tf2N] (C12-HH in C2-DD) x= 0, 0.01, 0.04, 0.16, 0.24, 0.32,
0.52, 0.74, 0.87, 0.96, 0.99, 1
20
[C2mim-d11]1-x[C12mim]x[Tf2N] ((C12-HH in C2-DD)) x= 0.01, 0.24, 0.74 60
[C2mim]1-x[C12mim-d31]x[Tf2N] ((C12-DD in C2-HH)) x= 0.01, 0.24, 0.74 60
[C2mim]1-x[C12mim-d31]x[Tf2N] (C12-DD in C2-HH) x= 0, 0.01, 0.04, 0.16, 0.24, 0.32,
0.52, 0.74, 0.87, 0.96, 0.99, 1
20
[C2mim]1-x[C12mim-d25]x[Tf2N] (C12-HD in C2-HH) x= 0.04, 0.24, 0.52, 0.87 20
[C2mim-d5]1-x[C12mim]x[Tf2N] (C12-HH in C2-HD) x= 0.04, 0.24, 0.52, 0.87 20
[C2mim]1-x[C12mim]x[Tf2N] (C12-HH in C2-HH) x= 0.04, 0.24, 0.52, 0.87 20
[C12mim-d31][Tf2N] (C12-DD) - 20 Saturated with H2O
[C2mim-d11]1-x[C12mim]x[Tf2N] (C12-HH in C2-DD) x= 0.24 20 Saturated with H2O
Scattering models used in data fitting
In order to gain molecular insight into bulk-phase structure SANS data are fitted to scattering models appropriate to the system under study. In this work, four scattering models were used:
Shape-based models
Two shape-based scattering models have been used, which are based on the form factors for scattering objects with different shapes. A sphere model describes the system as monodisperse spherical particles with a particular scattering length density (SLD) dispersed in a solvent that also has a uniform SLD. An ellipsoid model describes the system as being composed of ellipsoidal, rather than spherical, scattering objects. The ellipsoids are characterised by axial and equatorial radii. In both models, the volume fraction of the system occupied by the scattering objects is a parameter used in the fitting. The SLD of the scattering objects was taken to be the approximate SLD of non- or perdueterated alkyl chains (–5 10–7and 6.410–6Å–2, respectively) and the solvent SLD was
that of the [C2mim][Tf2N] and cationic head groups of the [C12mim]+ions, which depends on the isotopic contrast and composition
of the mixture. Shape-based models have been augmented by a Lorentzian peak model where necessary to describe the COP (at ~ 8 nm-1) present in the data for some compositions and contrasts (vide infra).
Teubner-Strey model
The Teubner-Strey model is an empirical model that describes the scattering intensity of a two-component system and was developed to describe microemulsions that display a range of structures from micelles to bicontinuous network and lamellar structures.46It has the following functional form:
( ) = + (1)
wherea,c1andc2are empirical fitting parameters, which can be used to derive quantities that relate to the structure of the system
under study:
– = (2)
(3)
( (4)
Faraday
Discussions
Accepted
Manuscript
Published on 26 June 2017. Downloaded by University of York on 26/06/2017 13:43:48.
View Article Online
[image:5.595.42.560.228.374.2]The ‘d-spacing’ can be related to the average distance between scattering objects, or the periodic distance in a bicontinous or lamellar structure. The ‘correlation length’ can be related to the length scale of the scattering objects and the ‘amphiphile strength’ parameter,, has been related to the type of structure formed by the system. Typically for > 1 the system is regarded as disordered, while aggregate/micelle formation is seen for 0 < < 1 and bicontinuous structures are described where –1 < < 0; lamellar structures are seen when < –1.46, 47
Lorentz + Peak Lorentz model
A combination of two scattering models, the Lorentz (or Ornstein-Zernicke model) and Lorentzian peak models, were used to model data from the [C2mim]1-x[C12mim]x[Tf2N] mixtures where the Teubner-Strey model was not providing a perfect description
of the observed scattering. These two models account for broad scattering features at low q(Lorentz model) and a scattering peak at higherq(Lorentzian peak model), which are both seen in these IL mixtures. The Lorentz model has the form:
( ) =
( ( ) )+ (5)
where L is the ‘correlation length’. The Peak Lorentz model has the form:
( ) =
( )
+ (6)
which describes a peak having a height of I0centered at q0and with a half-width half-maximum of B. A ‘correlation length’
associated with this peak can be calculated from 2/q0. In order to main consistency with the nomenclature used here for the
Teubner-Strey model we will call this length scale the ‘d-spacing’, to which it is related. The scatterer size is given by 1/B.
SANS data analysis
Mixtures containing low concentrations of [C12mim][Tf2N], wherex
[image:6.595.83.514.376.713.2]SANS data for the IL mixtures wherex F F x= 0, 0.01, 0.04, 0.16 and 0.24) were studied for two of the isotopic contrasts 12-HH in C2-DD and C12-DD in C2-HH. Additional isotopic contrasts: C12-HD in C2-HH, C12-HH in C2-HD and C12-HH in C2-HH were studied for two compositions in this range (x= 0.04 and 0.24).
Figure 3: SANS data atx C2mim-d11]1-x[C12mim]x[Tf2N] (C12-HH in C2-DD); panel b) all contrasts forx= 0.04; panel d) all contrasts forx= 0.24. Fits to the most
appropriate scattering models (see main text for discussion of these) are shown as black lines. Panel c) shows molecular length scales for the ions in this system (these are approximations, due to conformational flexibility).
Faraday
Discussions
Accepted
Manuscript
Published on 26 June 2017. Downloaded by University of York on 26/06/2017 13:43:48.
View Article Online
The SANS data for [C2mim]1-x[C12mim]x[Tf2N] mixtures wherex qscattering (below
~ 4 nm-1) that increases in relative intensity with increasingxand the COP, which appears at higher-q(around 9 nm-1) and decreases
in relative intensity with increasingx. The COP has been identified in previous work as arising from characteristic distances within the polar network of the IL (see MD discussion below for details).36, 45The low-qscattering for mixtures wherex
to the formation of small aggregates of the C12 chains from the [C12mim]+ions within the polar network, which consists of the
charged imidazolium groups and the [Tf2N]-ions and is driven by hydrophobic effects. This low-qscattering has been fitted to the
[image:7.595.98.500.407.733.2]scattering models described above and derived parameters are shown in Table 2.
Table 2: Selected SANS fitting parameters and derived properties. Data are average values from fitting of both the C12-HH in C2-DD and C12-DD in C2-HH contrasts at that composition, except at x = 0.24 where averages and standard errors from five compositions and repeat measurements are given. The Lorentz + Peak Lorentz model is not included, as in most cases fits are poorer than the shape-based or Teubner-Strey models for this compositional range.
Sphere model Ellipsoid model Teubner-Strey model
Composition (x= )
COP position (nm-1)
Radius (nm)
Volume fraction
Axial radius (nm)
Equatorial radius (nm)
Volume fraction
Correlation length (nm)
d-spacing (nm)
Amphiphile strength,
0 8.8 - - -
-0.01 8.7 0.8 0.01 0.9 0.8 0.01 0.5 4.5 0.3
0.04 8.6 0.8 0.03 1.1 0.6 0.04 0.4 4.2 0.4
0.16 - 0.9 0.07 1.4 0.6 0.10 0.5 4.4 0.4
0.24 - 0.8±0.02 0.11±0.02 1.2±0.07 0.6±0.01 0.11±0.02 0.6±0.01 4.0±0.1 0.1±0.02
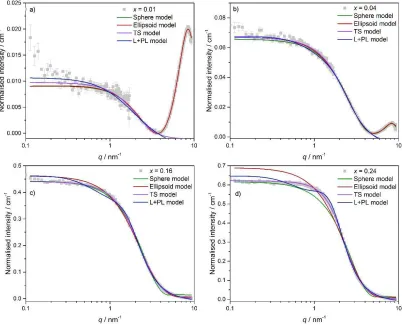
Whenx= 0, i.e. pure [C2mim][Tf2N], the data contain essentially no low-qscattering and have been modelled using a simple
Lorentzian peak fitted to the COP. Whenx= 0.01 and 0.04 all of the scattering models used fit the data well, given that scattering at lowerqis of low intensity with significant error bars. The system is thus described as small aggregates of C12 chains that are either spherical (~ 1.6 nm in diameter) or prolate ellipsoids. As the mole fraction of [C12mim][Tf2N] increases, the volume fraction
of the system occupied by the scattering objects increases and the scattering objects are best described as more prolate ellipsoids. Both spherical and ellipsoidal models fit the data less well from x= 0.16. However, at this point in the compositional range the data fit very well to the Teubner-Strey model (Figure 4), which is also found to be appropriate for mixtures where x> 0.24 (vide infra).
Faraday
Discussions
Accepted
Manuscript
Published on 26 June 2017. Downloaded by University of York on 26/06/2017 13:43:48.
View Article Online
Figure 4: SANS data atx= 0.01 (panel a),x= 0.04 (panel b),x= 0.16 (panel c) andx= 0.24 (panel d) for [C2mim-d11]1-x[C12mim]x[Tf2N] (fits to other contrasts are similar). Fits to the
sphere, ellipsoid, Teubner-Strey (TS model) and Lorentz + Peak Lorentz (L+PL model) are shown in green, red, purple and blue respectively.
When compared to the molecular length scales for the anions and cations in this system (see Figure 3) the fitted and derived parameters in Table 2 allow a discussion of the molecular basis of the liquid structure of the IL mixtures within this compositional range. The scattering objects are relatively small at all compositions where x
model and ~ 2.5 x 1.2 nm for the ellipsoid model. This corresponds to aggregates that, on average, are composed of between two and four C12 chains (see Figure 9 for examples of the structure of these aggregates from MD simulations) and the SANS fitting suggests that the average size of the scattering objects does not change substantially within this range of compositions. However, as the mole fraction of [C12mim][Tf2N] increases, the number density of these aggregates grows (shown by the approximately
linear increase in volume fraction with x) and the average distance between the scattering objects is reduced (the d-spacing decreases from 4.5 to 4.0 nm) as would be expected. At x= 0.24 fitting of the data suggests the presence of an incipient PNPP, which is not visible, but nevertheless affects the shape of the scattering profile. This is discussed in more detail below.
Forx= 0.04 and 0.24 data were collected for five separate isotopic contrasts (Figure 3, panels b and d). In general, the different contrasts paint a similar picture of the liquid structure, which is understandable as in all contrasts the most significant differences in SLD in the system are between the C12 chains and the polar network. However, there are some differences in scattering intensity as the proportion of deuterium to hydrogen in the samples changes. At x= 0.04 the data seem to suggest slightly longer length scales for the scattering objects for the C12-HD in C2-HH, C12-HH in C2-HD and C12-HH in C2-HH contrasts. However, these data are of low intensity, with large error bars, and this may simply be a result of uncertainty in the fits. The most important aspect of the measurements on multiple isotopic contrasts was that fitted and derived parameters could be averaged for chemically identical, but isotopically different, samples and for the compositions where five contrasts were available standard errors could be derived. This gives additional confidence in the structural models and an estimate of their uncertainty. In this compositional range, the averages from all contrasts are presented in Table 2 forx= 0.24, but only for C12-HH in C2-DD and C12-DD in C2-HH at
x= 0.04, due to the scatter in the data for other contrasts.
Mixtures containing intermediate concentrations of [C12mim][Tf2N x
SANS IL x F W
undergoes significant changes, from ILs containing aggregates of C12 alkyl chains within their polar network to ILs where the volume fraction of the system occupied by the C12 chains is sufficiently large that they percolate to form a continuous, non-polar sub-phase. Qualitatively, this can be seen in the SANS data (Figure 5, panel a) by the appearance of a PNPP at intermediate-qvalues (~ 1.5 to 2.5 nm-1), which becomes more defined with increasing x. This peak is associated with the formation of local bilayer
[image:8.595.77.523.490.666.2]structures within the liquids, where the C12 alkyl chains from different cations lie roughly end to end to form aliphatic domains in a similar way to lipid bilayers, and its position is related to the average length scale for these bilayers. In this compositional region, and wherex> 0.52, the data do not fit to the shape-based scattering models described above and these will not be discussed further.
Figure 5: SANS data for [C2mim-d11]1-x[C12mim]x[Tf2N P x x= 0.52. Fits to the Teubner-Strey model are shown as black
lines.
As shown in Figure 4 and Figure 6, the data atx= 0.24 and 0.32 fit well to the Teubner-Strey model. The PNPP begins to appear as an incipient peak at around 1.5 nm-1whenx= 0.32 and this feature is described well by the model. However, it is likely that
some component of the PNPP also affects the observed scattering at x= 0.24, which may account for the poorer fit to the shape-based scattering models at this composition. Indeed, in previously reported SAXS data45and in MD simulations (vide infra), there
Faraday
Discussions
Accepted
Manuscript
Published on 26 June 2017. Downloaded by University of York on 26/06/2017 13:43:48.
View Article Online
is evidence of the PNPP emerging at this point. At x= 0.32 it was not possible to fit the data well to the Lorentz + Peak Lorentz model. However, as the PNPP becomes more defined with increasing mole fraction of [C12mim][Tf2N] in the mixture (i.e. fromx=
[image:9.595.80.525.112.290.2]0.52) both models provide a reasonable fit to the data.
Figure 6: SANS data for [C2mim-d11]1-x[C12mim]x[Tf2N] (fits to other contrasts are similar): Panel a)x= 0.32 and panel b)x= 0.52. Fits to the Teubner-Strey (TS model) and Lorentz +
Peak Lorentz (L+PL model) are shown in purple and blue respectively.
[image:9.595.76.525.425.606.2]Derived parameters from the Teubner-Strey and Lorentz + Peak Lorentz models for all compositions are shown in Table 3. In the Teubner-Strey data, fromx= 0.24 tox= 0.52 thed-spacing decreases dramatically (from 4.0 to 3.1 nm) and the amphiphile strength changes sign (from 0.1 to -0.5). This is consistent with a significant structural change in the liquids, as the isolated aggregates of C12 alkyl chains coalesce to form a non-polar network within the IL.
Table 3: Derived properties for the Teubner-Strey and Lorentz + Peak Lorentz models for all compositions. Data are average values from fitting of both the HH in C2-DD and C12-DD in C2-HH contrasts at that composition, except atx= 0.24, 0.52 and 0.87 where averages and standard errors from five compositions and repeat measurements are given.
Correlation lengths are not presented for the Lorentz + Peak Lorentz model fromx qLorentz component at these
compositions. Hence they were modelled with the Peak Lorentz model only.
Teubner-Strey model Lorentz + Peak Lorentz model Composition
(x)
PNPP position (nm-1)
Correlation length (nm)
d-spacing
(nm)
Amphiphile strength,
Correlation length (nm)
d-spacing
(nm)
Scatterer size (nm)
0 - - -
-0.01 - 0.5 4.5 0.3 - -
-0.04 - 0.4 4.2 0.4 - -
-0.16 - 0.5 4.4 0.4 - -
-0.24 - 0.6±0.01 4.0±0.1 0.1±0.02 - -
-0.32 1.5 0.6 3.7 -0.1 - -
-0.52 1.8 1.0±0.07 3.0±0.05 -0.6±0.05 0.8±0.08 3.4±0.05 1.2±0.06
0.74 2.2 1.1 2.7 -0.7 0.8 2.9 1.3
0.87 2.3 1.5±0.08 2.6±0.04 -0.9±0.01 1.6±0.3 2.8±0.04 1.5±0.07
0.96 2.4 1.6 2.5 -0.9 - 2.6 1.5
0.99 2.5 1.8 2.4 -0.9 - 2.5 1.6
1 2.3 1.9 2.5 -0.9 - 2.7 1.9
Mixtures containing higher concentrations of [C12mim][Tf2N], wherex> 0.52
SANS data for the IL mixtures wherex> 0.52 are shown in Figure 7. The data in this range of compositions are dominated by a large PNPP, which is characteristic of the scattering seen in nano-structured pure ILs such as [C12mim][Tf2N].36The position of the
PNPP shifts steadily to higherqbetweenx= 0.52 (where it is at 1.8 nm-1) andx= 0.99 (where it reaches 2.5 nm-1), with a small shift
back to 2.3 nm-1in pure [C
12mim][Tf2N]. In addition to the PNPP, some additional scattering at lower qis present atx= 0.74, which
diminishes with increasing mole fraction of [C12mim][Tf2N]. Within this compositional range the data have been fitted to the
Teubner-Strey, Lorentz + Peak Lorentz and a single Lorentzian peak model (Figure 8). The PNPP can be described by a single Lorentzian peak alone, but at lower mole fractions of [C12mim][Tf2N] this does not account for the scattering that is present at
lowerq. Conversely, the Teubner-Strey model slightly overestimates the degree of lower qscattering. Poorer fits to the Teubner-Strey model have also been seen in ultra-flexible microemulsion systems, which do not display Porod-law behaviour (where scattering intensity decays withq-4) due to the lack of a ‘sharp’ interface between the two phases.48The Lorentz + Peak Lorentz
Faraday
Discussions
Accepted
Manuscript
Published on 26 June 2017. Downloaded by University of York on 26/06/2017 13:43:48.
View Article Online
model has been used successfully to describe these ultra-flexible microemulsions and was also found to fit well for the IL mixture systems reported here wherex PNPP
[image:10.595.83.520.112.291.2]the lowqscattering in these compositions.
Figure 7: SANS data for [C2mim-d11]1-x[C12mim]x[Tf2N]: Panel a)x> 0.52 and panel b) all contrasts forx= 0.87. In both panels, fits to the Lorentz + Peak Lorentz model are shown as
black lines.
Figure 8: Fits to the Teubner-Strey (TS model), Lorentz + Peak Lorentz (L+PL model) and a Lorentzian peak centered on the PNPP (PL model) are shown in purple, blue and orange respectively for [C2mim-d11]1-x[C12mim]x[Tf2N] wherex= 0.74, 0.87, 0.96, 0.99 and 1 (fits to other contrasts are similar). Fromx
low-qLorentz component and they were modelled with the PL model only.
Within this range of compositions the [C2mim]1-x[C12mim]x[Tf2N] system can be described as a bicontinuous (percolated)
network of continuous polar domains comprising the [Tf2N]- anions, [C2mim]+ cations and imidazolium head groups of the
[C12mim]+ions and non-polar domains comprising the C12 chains of the [C12mim]+ions. This is indicated by the negative amphiphile
strength parameters for all compositions in this range as well as the presence of a clear PNPP. However, this network structure does undergo some changes with increasing mole fraction of [C12mim][Tf2N] in the ILs, which leads to the PNPP shifting to higher qwith increasingx, which is associated with a decrease ind-spacing from 3.1 to 2.5 nm fromx= 0.52 tox= 1. This is in excellent agreement with previous SAXS data.45It could be argued that this might arise from a compression of the local bilayer structure
present in these liquids with increased alkyl chain interdigitation and/or folding of the C12 chains. However, previous MD simulations have suggested there is little change in interdigitation with increasing x.45Examination of the correlation lengths and
Faraday
Discussions
Accepted
Manuscript
Published on 26 June 2017. Downloaded by University of York on 26/06/2017 13:43:48.
View Article Online
[image:10.595.55.538.324.593.2]scatterer size parameters may give some additional hints as to the origins of this effect. Both of these parameters increase steadily from around 1 nm atx= 0.52 to 1.9 nm atx= 1. This suggests that the length scale of the alkyl chain regions within the IL, the non-polar network, gets larger with increasing x. This in turn will induce structural changes within the polar network (since the C12 chains are attached to imidazolium ions that are a fundamental component of the polar network). Indeed, MD simulations (vide infra) suggest, through changes in the position of the COP with increasingx, that the polar network stretches, or expands slightly, as the mole fraction of [C12mim][Tf2N] in the ILs increases. The overall effect of these changes in both the polar and non-polar
networks must result in a reduction in the ion-ion distances separated by the non-polar network, giving rise to the observed changes in PNPP position and d-spacing derived from this. However, based on the data available we are unable to give an unambiguous molecular description of the origin of this effect.
Summary of structural changes with changing composition
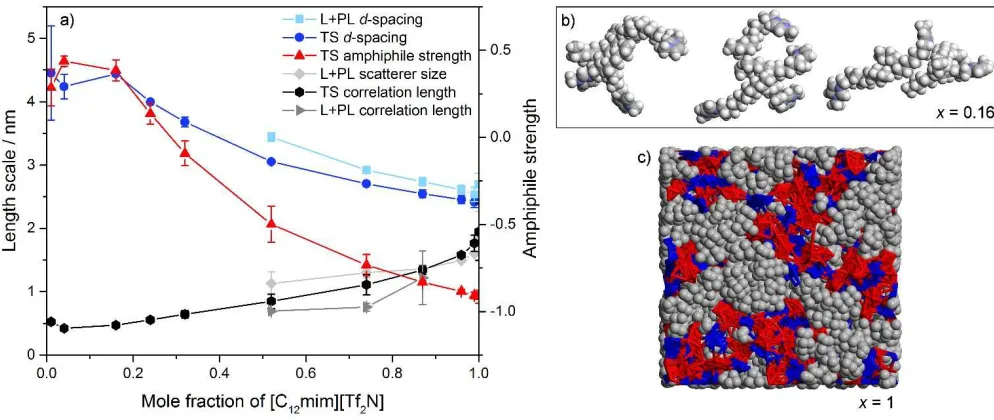
A summary of all derived parameters from the Teubner-Strey model, alongside those from Lorentz + Peak Lorentz model at compositions where the fit is good, are shown in Figure 9 alongside selected data from MD simulations that aid in the visualisation of the C12 chain aggregates and bicontinuous network structures seen in these ILs. Although the fits are not perfect at higher mole fractions of [C12mim][Tf2N], the Teubner-Strey model is perhaps the most appropriate to describe the SANS data across all
compositions of the [C2mim]1-x[C12mim]x[Tf2N] system, as the fits are generally good or very good.
Figure 9 shows several features of interest for this system that allow the molecular basis of the liquid structure to be summarised. Asxincreases, thed-spacing decreases smoothly from around 4.5 (x= 0.01) to around 2.5 nm (x= 1). At low mole fractions of [C12mim][Tf2N] (x C
the decrease ind-spacing in these mixtures represents a decrease in the average distance between these scattering objects. The scattering objects themselves are small, mostly corresponding to aggregates of between two and four C12 chains (see Figure 9, panel b for selected aggregates from MD simulations atx= 0.16).
The amphiphile strength parameter () is positive wherex x
previous studies of microemulsions,47 been linked to changes in structure from weakly structured systems to genuine
microemulsions. In the ILs studied here, the change in sign of can be associated with the percolation threshold where the C12 alkyl chains occupy sufficient volume within the IL mixture to form a continuous non-polar sub-phase and where the IL is best described as a bicontinuous network of polar and non-polar domains. It is possible to extrapolate from the data in Figure 9 that the percolation threshold is reached at aroundx= 0.3 in these ILs. Within the region where the IL can be described as bicontinuous, thed-spacing is associated with ion-ion distances that are separated by the non-polar network. Thus, the d-spacing is indicative of the length scale of the local bilayer structures present within the IL and when x> 0.32 this decreases in length with increasingx. The correlation length and scatterer size parameters give some indication of the length scale of the scattering objects (i.e. the C12 chains). Up tox= 0.24 the correlation length does not change substantially (it is relatively constant at around 0.5 nm), but after x
[image:11.595.47.544.488.698.2]= 0.32 it increases steadily, reaching 1.9 nm in pure [C12mim][Tf2N].
Figure 9: Panel a) shows derived parameters from the Teubner-Strey (TS model), Lorentz + Peak Lorentz (L+PL model) and a Lorentzian peak centred on the PNPP (PL model) across all compositions. Data are averaged values for the [C2mim-d11]1-x[C12mim]x[Tf2N] and [C2mim]1-x[C12mim-d31]x[Tf2N] contrasts and approximate error bars based on the deviation in
derived parameters for these two contrasts have been added. Panel b) shows examples of aggregates of four [C12mim]+ions (the most common aggregate size at this composition)
Faraday
Discussions
Accepted
Manuscript
Published on 26 June 2017. Downloaded by University of York on 26/06/2017 13:43:48.
View Article Online
from MD simulations wherex= 0.16. Panel c) shows a snapshot of the MD simulation box forx= 1, where C12 chains are shown in grey, [Tf2N]-anions in red and the imidazolium
head groups are shown in blue.
The effect of temperature on the [C2mim]1-x[C12mim]x[Tf2N] system
Temperature-dependant SANS studies on three compositions (x= 0.01, 0.24, 0.74) with two contrasts (C12HH in C2DD and C12DD in C2HH) at two temperatures (20 and 60 °C) were performed. The mixtures with a low mole fraction of [C12mim][Tf2N] (x
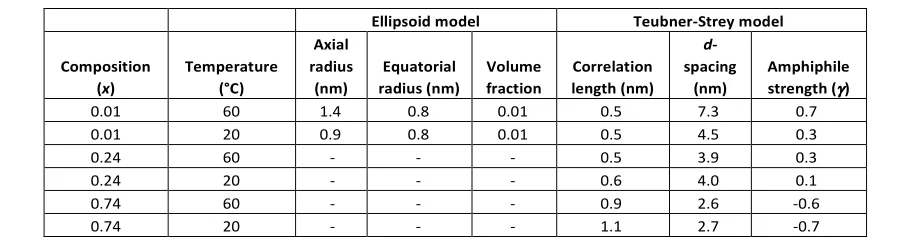
= 0.01) were fitted to the ellipsoid and Teubner-Strey models, whereas the intermediate (x= 0.24) and higher (x= 0.74) mole fraction of [C12mim][Tf2N] mixtures were fitted to the Teubner-Strey model, Figure 10. The average fitted and derived parameter
values of both contrasts are shown in Table 4. There is no significant difference in the derived parameters at both temperatures forx= 0.24 and 0.74, indicating that there is no bulk structural change over the temperature range studied. For x= 0.01 there is a small increase ind-spacing and axial radius from 20 to 60oC, but given the low intensity of the scattering data this may be due to
[image:12.595.68.529.243.418.2]uncertainty in the fits. However, the overall scattering intensity of the mixtures does decrease and increases (forx= 0.01 and 0.24) with increasing temperature, suggesting that the system does become more disordered, as would be expected.
Figure 10: Temperature dependence of the SANS data for three compositions (x= 0.01, 0.24 and 0.74): Panel a) for C12-HH in C2-DD and panel b) for C12-DD in C2-HH.
Table 4: SANS fitting and derived parameters. Data are average values from fitting of both the C12-HH in C2-DD and C12-DD in C2-HH contrasts at that composition.
Ellipsoid model Teubner-Strey model
Composition (x)
Temperature (°C)
Axial radius
(nm)
Equatorial radius (nm)
Volume fraction
Correlation length (nm)
d -spacing
(nm)
Amphiphile strength ()
0.01 60 1.4 0.8 0.01 0.5 7.3 0.7
0.01 20 0.9 0.8 0.01 0.5 4.5 0.3
0.24 60 - - - 0.5 3.9 0.3
0.24 20 - - - 0.6 4.0 0.1
0.74 60 - - - 0.9 2.6 -0.6
0.74 20 - - - 1.1 2.7 -0.7
The effect of water on the [C2mim]1-x[C12mim]x[Tf2N] system
Although all ILs in this study are hydrophobic, in that they are immiscible with water, it is well known that even hydrophobic ILs will absorb some moisture and that this can have an impact on their physical properties. All ILs reported here were synthesised under anhydrous conditions and carefully dried and stored in an N2-filled glovebox prior to the experiments and although the SANS
cuvettes were filled in air, this was done quickly and the cuvettes were sealed in order to minimise exposure of the samples to atmospheric moisture. In order to assess the impact of water on the bulk structure of these ILs, two systems ([C2 mim-d11]0.76[C12mim]0.24[Tf2N] and [C12mim-d31][Tf2N]) were saturated with H2O by shaking samples with water, allowing the two phases
to fully separate and then recovering the H2O-saturated ILs for SANS analysis. The results are shown in Figure 11 and fitted and
derived parameters are given in Table 5.
When saturated with water, the scattering intensity of [C12mim-d31][Tf2N] increases slightly, but the derived parameters from
fitting the data are essentially the same as the IL before adding water. Thus, there appears to be no significant change in structure for this IL when water was added. The picture for [C2mim-d11]0.76[C12mim]0.24[Tf2N] is somewhat different. In the H2O-saturated
sample the scattering intensity decreases on addition of water and the d-spacing and amphiphile strength parameters increase.
Faraday
Discussions
Accepted
Manuscript
Published on 26 June 2017. Downloaded by University of York on 26/06/2017 13:43:48.
View Article Online
[image:12.595.70.519.458.579.2]Adding water appears to lead to a more disordered system with a larger distances between the scattering objects, which themselves do not change significantly in size (the correlation length is the same in both samples). This suggests that water is incorporated into the polar network of the IL, which increases its volume fraction compared to that of the non-polar C12 chain aggregates, increasing the relative distance between them. The observation of a water effect in the IL where x= 0.24 and not for
x= 1 may be due to the difference in liquid structure (aggregates of C12 chains vs. a bicontinuous structure) between the samples, but more likely is due to the more hydrophobic character of pure [C12mim][Tf2N], which results from the significantly higher volume
[image:13.595.179.414.161.337.2]fraction of the IL that is taken up by non-polar alkyl chains.
Figure 11: SANS data for H2O-saturated samples of [C2mim-d11]0.76[C12mim]0.24[Tf2N] and [C12mim-d31][Tf2N] compared to the same compositions without added water.
Table 5: SANS fitting and derived parameters for H2O-saturated samples compared to the same compositions without added water (average values from all isotopic contrasts).
Teubner-Strey model Lorentzian peak model
Composition Added water
Correlation length (nm)
d-spacing (nm)
Amphiphile strength ()
d-spacing (nm)
Scatterer size (nm)
x= 0.24 (averaged) No 0.6 4.0 0.1 -
-x= 0.24 (C12-HH in C2-DD) Yes 0.6 4.9 0.3 -
-[C12mim][Tf2N] (averaged) No - - - 2.7 1.9
Pure C12-DD Yes - - - 2.6 1.8
Molecular dynamics simulations
In order to provide additional insight into this system and to aid in the interpretation of the scattering results atomistic MD simulations have been performed, as described in the experimental section. These simulations have focussed on compositions wherex< 0.52, as this is the region where the system displays the most variability in structure. In particular, it is in this region that the liquid structure changes from one containing isolated aggregates of [C12mim]+ions to a bicontinuous network structure where
all C12 alkyl chains have coalesced to form a continuous non-polar sub-phase, as seen in pure [C12mim][Tf2N]. Simulations of
compositions wherex> 0.52 have been reported recently and show strong evidence of this bicontinuous network structure.45
Faraday
Discussions
Accepted
Manuscript
Published on 26 June 2017. Downloaded by University of York on 26/06/2017 13:43:48.
View Article Online
[image:13.595.49.535.382.466.2]Figure 12: Calculated total structure factor functions,S(q) for pure [C2mim][Tf2N], pure [C12mim][Tf2N] and selected [C2mim]1-x[C12mim]x[Tf2N] mixtures: Panel a) at 300 K and panel
b) at 500 K. Data forx= 0.52 is presented from reference45and these simulations were only performed at 500K, in a smaller simulation box. In order to improve legibility, allS(q)
functions were shifted in they-axis direction in proportion to the volume fraction of the liquid occupied by the alkyl chains.
Figure 12 denotes the structure factor functions,S(q), of the [C2mim]1-x[C12mim]x[Tf2N] mixtures, wherex= 0, 0.01, 0.04, 0.16,
0.24, 0.32, 0.42 and 1, at 300 K and 500 K, which can be derived from the MD simulations of this system. Since the main interest is in structural features at an intermolecular level, the analysis focused on the low-qregions of theS(q) functions (2 <q/nm-1< 18).
In both plots, the PNPP starts to appear as an incipient peak at x= 0.24, increasing its intensity with increasing mole fraction of [C12mim][Tf2N]. Thex= 0.42 data unveil three well-defined peaks around (i) 14, (ii) 9, and (iii) 2 nm-1.
The preciseq-values of those main peaks have been calculated by the deconvolution of the corresponding S(q) functions and the results are presented in Figure 13. The figure shows the structure factor functions of two mixtures: x= 0.16 and 0.24 at 300 K and 500 K. The comparison betweenS(q) of the two different mixtures at same temperature reveals that: i) the position and the intensity trends of the COP and CP peaks are similar for both mole fractions; ii) an incipient PNP peak is observed at 24 mol% [C12mim][Tf2N] mixture, but it is not present at 16 mol% [C12mim][Tf2N]. Figure 13 also shows the comparison between different
temperatures at the same mole fractions. The results are: i) the intensity trends of the COP and CP peaks are similar at 300 K and 500 K; ii) the position of COP and CP peaks are shifted slightly to lower q-values when the temperature of the simulation changes from 300 K to 500 K, e.g. CP at 14.3 nm-1for 16 mol% [C
12mim][Tf2N] at 300 K but 13.2 nm-1for 16 mol% [C12mim][Tf2N] at 500 K;
iii) the intensity of the incipient PNP peak observed in the 24 mol% [C12mim][Tf2N] mixture at 500 K is much lower than at 300 K,
which makes it difficult to identify clearly at that temperature.
Faraday
Discussions
Accepted
Manuscript
Published on 26 June 2017. Downloaded by University of York on 26/06/2017 13:43:48.
View Article Online
Figure 13: Structure factor functions,S(q), for [C2mim]1-x[C12mim]x[Tf2N] mixtures, wherex= 0.16 and 0.24 at 300 K and 500 K. The top row is theS(q) function in the fullq-value
range studied (2 <q/nm-1< 60), where the grey parts of the data are the low-qregions focused on in the discussion; in the second row the focus is on the low-qvalues and the
bottom row is the deconvolution of the low-qpeaks and the fitting deviation.
The COP q-values depend mainly on the characteristic spacing between ions of the same sign separated by a common counterion. In other words, the COP defines the ionic alternation within the polar network mesh that characterises all ILs. In the present case, the COP shifts to lower q-values with increasing temperature. Such a trend is related to the stretching, or slight
T = 0.72 nm for thex= 0.16 and
K = 0.76 nm forx= 0.24 at 500 K. It must be stressed at this point that the fitting of the low-q S(q) functions with multiple complex functions was performed taking into account the position of the COP peak for each type of system. It is observed that there is a very strong link between the position of the COP and the correlation functions, g(r), between pairs of same-charge or opposite-charge ions. In order to avoid consistency problems associated with multi-peak fitting redundancies, checks were carried out to ensure that the characteristic wavelength of the charge-ordering g(r) functions of a given system and the position of the fitted COP peak were coherent. This is shown in Figure 14, where the corresponding charge-ordering
g(r) functions are depicted. A grid representing the characteristic wavelength for each system, obtained from the fitted COP values, is superimposed with the correlation functions and confirms the consistency of the fitting methodology.
Faraday
Discussions
Accepted
Manuscript
Published on 26 June 2017. Downloaded by University of York on 26/06/2017 13:43:48.
View Article Online
Figure 14: Pair radial distribution functions, g(r), for x = 0.16 and 0.24 at 300 K and 500 K. Green curves: cation-aniong(r)s (imidazolium ring centroid to nitrogen atom, CM-NBT); red curves: anion-aniong(r)s (NBT-NBT); blue curves : cation-cationg(r)s (CM-CM). The vertical orange lines and numerals indicate the characteristic wavelength of the dampened periodical functions.
In summary, the MD results show that, as in the SANS experiments, an incipient low-qpeak starts to appear in mixtures around
x= 0.24 and that the intensity of such peak decreases with increasing temperature. Consistent with the SANS data, concentrations
x C12mim]+
ions and the formation of a continuous non-polar domain spanning the entire simulation box. Before such a percolation event, the dodecyl chains are either isolated or form small clusters of a few dodecyl chains. For instance, where x= 0.04, around 70% dodecyl chains are isolated, whereas 20% and 10% form clusters of two and three chains, respectively.45On the other hand, for
mixtures with high [C12mim][Tf2N] concentrations, the dodecyl chains are part of a single and continuous non-polar domain that
separates different polar strands with characteristic spacing in the 2.5–3.0 nm range (PNPPs in the 2.5–2.1 nm-1range). Such
F x
groups from the [C2mim][Tf2N] component are still isolated from the large dodecyl domains, forming small clusters. When x>
0.74, almost all ethyl groups become part of the continuous non-polar dodecyl sub-phase.
Conclusions
A detailed SANS study on a wide range of compositions and isotopic contrasts of the [C2mim]1-x[C12mim]x[Tf2N] system has
been undertaken and this was complemented by new MD simulations. Fitting of the SANS data has shown that several scattering models are appropriate to describe this system, but that the most appropriate model depends on the composition of the IL mixture. Whenx< 0.24, the data are well described by a model based on non-interacting ellipsoidal scattering objects, but also by the Teubner-Strey model, which fits the data well up tox= 0.52. Whenx> 0.74 a combination of the Ornstein-Zernicke model and a Lorentzian peak, centred on the PNPP, describe the SANS data well. After x= 0.96 the proportion of Ornstein-Zernicke model in the fits is negligible and a Lorentzian peak alone is sufficient to describe the data.
Both the SANS fitting and MD simulations suggest that the liquid structure of these IL mixtures changes substantially with composition. At lower concentrations of [C12mim][Tf2N] in the mixture, small aggregates that most commonly contain between
two and four C12 chains are found and their number density increases as xincreases. Atx= 0.24 an incipient PNPP is seen inS(q) functions derived from the MD simulations and is suggested in fits to the SANS data, which indicates that at this composition some C12 chain aggregates are present that are sufficiently large to form local bilayer structures, where C12 alkyl chains from different cations lie roughly end to end with little interdigitation. The data suggest that at around x= 0.3, the percolation threshold is reached and the C12 chains coalesce to form a continuous non-polar sub-phase and the IL mixtures can be described as bicontinuous (with
Faraday
Discussions
Accepted
Manuscript
Published on 26 June 2017. Downloaded by University of York on 26/06/2017 13:43:48.
View Article Online
both polar and non-polar domains). Asxincreases, the length scale of the local bilayers formed within this bicontinuous network decreases and the IL mixtures become more reminiscent of pure [C12mim][Tf2N].
Both MD simulations and SANS studies suggest that the mixtures become more disordered with increasing temperature, but the fundamental liquid structure (e.g. length scales of aggregates or bilayers) does not change substantially. The response of the IL liquid structure to added water was found to depend strongly on composition. When x = 0.24 it appears that water is incorporated into the polar network, which essentially acts to dilute the aggregates found at this composition. Whereas, when x= 1 it appears that the IL is too hydrophobic to incorporate sufficient water to substantially change the liquid structure. Overall, these studies have showed that IL mixtures containing two substantially different cations, but a common anion, have a rich structural chemistry. It is likely that this can be exploited in a range of applications and this class of IL mixture offer exciting possibilities as tunable ILs whose properties can be altered simply by changing their composition.
Experimental
Details of all synthetic procedures are given in the supplementary information.
Small-angle neutron scattering measurements
SANS was carried out on both the D22 instrument at the ILL (Grenoble, France) and the Sans2d small-angle diffractometer at the ISIS Pulsed Neutron Source (STFC Rutherford Appleton Laboratory, Didcot, U.K.).49, 50On D22, two instrument configurations
were used= 4.6 Å,D= 1.25 m Coll= 5.6 m and D= 8m Coll= 8 m with a detector offset of 400 mm to cover a q-range from 9 x 10⁻³to 0.9 Å-1. The scattering vectorqis defined as:
=
(7)whereis the scattered angle and is the incident neutron wavelength. The raw scattering data were corrected for the electronic background and empty cell and were normalised on the absolute scale using the attenuated direct beam to calculate the incident flux using the ILL Lamp software ( https://www.ill.eu/instruments-support/computing-for-science/cs-software/all-software/lamp/). On Sans2d, a simultaneousq-range of 0.0045 – 0.7 Å-1was achieved utilising an incident wavelength range of
1.75 – 16.5 Å and employing an instrument set up of L1=L2=4m, with the 1 m2detector offset vertically 60 mm and sideways 100
mm. The beam diameter was 8 mm. Each raw scattering data set was corrected for the detector efficiencies, sample transmission
vs.q) using the instrument-specific software.49
These data were placed on an absolute scale (cm-1) using the scattering from a standard sample (a solid blend of protonated and
perdeuterated polystyrene) in accordance with established procedures.51
Computational methods
The [C2mim][Tf2N] and [C12mim][Tf2N] binary mixtures were modelled using the CL&P atomistic force field.52, 53The molecular
dynamics simulations were carried out using the Gromacs package54-56at 300 K and 500 K. Gromacs simulations (Table 6) were
started from configurations built with the PACKMOL package57and were performed using 1 fs time-steps and 2 nm cutoff distances,
[image:17.595.69.525.585.683.2]with Ewald summation corrections performed beyond the cutoffs. The isothermal-isobaric ensemble conditions were used during equilibration with v-rescale thermostats and Berendsen barostats. The systems were equilibrated for 4 ns. The production run simulations were performed under isothermal- N H P Rahman barostats with relaxation time constants of 1 and 4 ps, respectively for at least 6.0 ns.
Table 6: Simulation conditions and size of the equilibrated boxes.
Mixture NC2+NC12ion pairs Vboxa/nm3 lboxb/nm Vboxc/nm3 lboxd/nm
1 mol% [C12mim] 3168+32 1342.9 11.03 1532.6 11.53
4 mol% [C12mim] 2688+112 1198.2 10.62 1368.0 11.10
16 mol% [C12mim] 2352+448 1290.0 10.89 1476.5 11.39
24 mol% [C12mim] 2128+672 1352.7 11.06 1549.3 11.57
32 mol% [C12mim] 1904+896 1414.5 11.23 1622.7 11.75
42 mol% [C12mim] 1624+1176 1493.0 11.43 1714.6 11.97
a, bat 300 K;c, dat 500 K
The total static structure factors,S(q), and pair radial distribution functions,g(r) were computed according to previously described methodologies.36, 58
Faraday
Discussions
Accepted
Manuscript
Published on 26 June 2017. Downloaded by University of York on 26/06/2017 13:43:48.
View Article Online
Acknowledgements
The authors are grateful to the NSF and EPSRC (grant numbers NSF-CHE-1266032 and EP/K032062/1), the University of York, the Technical University of Lisbon and the Royal Society (International Exchanges Grants) for funding. We thank the Fundação para a Ciência e a Tecnologia, Portugal, for financial support (Project UID/QUI/00100/2013), for a fellowship to K.S. (SFRH/BPD/94291/2013)). Gratitude is also expressed to the Science and Technology Facilities Council for neutron scattering beam time at ISIS and the ILL (SANS Xpress, ILL experiment 6-03-435 and SANS2D experiment RB1510160) and to the ISIS deuteration facility for providing [D25]-dodecyl bromide for these experiments. All data created during this research are available by request
from the University of York Data Catalogue.
Notes and references
1. H. Niedermeyer, J. P. Hallett, I. J. Villar-Garcia, P. A. Hunt and T. Welton,Chem. Soc. Rev., 2012,41, 7780-7802. 2. G. Chatel, J. F. B. Pereira, V. Debbeti, H. Wang and R. D. Rogers,Green Chem., 2014,16, 2051-2083.
3. E. I. Izgorodina and D. R. MacFarlane,J. Phys. Chem. B, 2011,115, 14659-14667.
4. A. G. Avent, P. A. Chaloner, M. P. Day, K. R. Seddon and T. Welton,J. Chem. Soc., Dalton Trans., 1994, 3405-3413. 5. P. S. Schulz, N. Muller, A. Bosmann and P. Wasserscheid,Angew. Chem., Int. Ed., 2007,46, 1293-1295.
6. R. Katoh, M. Hara and S. Tsuzuki,J. Phys. Chem. B, 2008,112, 15426-15430.
7. E. W. Castner, C. J. Margulis, M. Maroncelli and J. F. Wishart, inAnnual Review of Physical Chemistry, Vol 62, eds. S. R. Leone, P. S. Cremer, J. T. Groves and M. A. Johnson, 2011, vol. 62, pp. 85-105.
8. H. Weingaertner,Angew. Chem., Int. Ed., 2008,47, 654-670.
9. D. F. Evans, S. H. Chen, G. W. Schriver and E. M. Arnett,J. Am. Chem. Soc., 1981,103, 481-482. 10. J. Dupont,J. Braz. Chem. Soc., 2004,15, 341-350.
11. C. Hardacre, J. D. Holbrey, M. Nieuwenhuyzen and T. G. A. Youngs,Acc. Chem. Res., 2007,40, 1146-1155.
12. S. M. Chen, S. J. Zhang, X. M. Liu, J. Q. Wang, J. J. Wang, K. Dong, J. Sun and B. H. Xu,Phys. Chem. Chem. Phys., 2014,16, 5893-5906. 13. F. C. Gozzo, L. S. Santos, R. Augusti, C. S. Consorti, J. Dupont and M. N. Eberlin,Chem. Eur. J., 2004,10, 6187-6193.
14. R. Bini, O. Bortolini, C. Chiappe, D. Pieraccini and T. Siciliano,J. Phys. Chem. B, 2007,111, 598-604. 15. P. J. Dyson, I. Khalaila, S. Luettgen, J. S. McIndoe and D. B. Zhao,Chem. Commun., 2004, 2204-2205. 16. S. Dorbritz, W. Ruth and U. Kragl,Adv. Synth. Catal., 2005,347, 1273-1279.
17. W. Xu, E. I. Cooper and C. A. Angell,J. Phys. Chem. B., 2003,107, 6170-6178. 18. S. S. J. Ho, M. E. Coddens and C. F. Poole,Org. Mass Spectrom., 1985,20, 377-379.
19. C. F. Poole, B. R. Kersten, S. S. J. Ho, M. E. Coddens and K. G. Furton,J Chromatogr, 1986,352, 407-425.
20. U. Schroder, J. D. Wadhawan, R. G. Compton, F. Marken, P. A. Z. Suarez, C. S. Consorti, R. F. de Souza and J. Dupont,New J. Chem., 2000,
24, 1009-1015.
21. C. J. Margulis,Mol. Phys., 2004,102, 829-838.
22. A. Triolo, O. Russina, B. Fazio, R. Triolo and E. Di Cola,Chem. Phys. Lett., 2008,457, 362-365. 23. S. M. Urahata and M. C. C. Ribeiro,J. Chem. Phys., 2004,120, 1855-1863.
24. Y. T. Wang and G. A. Voth,J. Am. Chem. Soc., 2005,127, 12192-12193. 25. Y. T. Wang and G. A. Voth,J. Phys. Chem. B, 2006,110, 18601-18608. 26. J. N. A. C. Lopes and A. A. H. Padua,J. Phys. Chem. B, 2006,110, 3330-3335.
27. C. Hardacre, J. D. Holbrey, C. L. Mullan, T. G. A. Youngs and D. T. Bowron,J. Chem. Phys., 2010,133, 0745101-0745107. 28. D. V. Wagle, H. Zhao and G. A. Baker,Acc. Chem. Res., 2014,47, 2299-2308.
29. E. L. Smith, A. P. Abbott and K. S. Ryder,Chem. Rev., 2014,114, 11060-11082.
30. H. Tokuda, K. Hayamizu, K. Ishii, M. A. B. H. Susan and M. Watanabe,J. Phys. Chem. B, 2005,109, 6103-6110. 31. H. O. Hamaguchi and R. Ozawa,Advances in Chemical Physics, Vol 131, 2005,131, 85-104.
32. T. L. Greaves and C. J. Drummond,Chem. Soc. Rev., 2013,42, 1096-1120.
33. E. C. Wijaya, T. L. Greaves and C. J. Drummond,Faraday Discuss., 2013,167, 191-215. 34. R. Hayes, G. G. Warr and R. Atkin,Chem. Rev., 2015,115, 6357-6426.
35. O. Russina, A. Triolo, L. Gontrani and R. Caminiti,J. Phys. Chem. Lett., 2012,3, 27-33. 36. K. Shimizu, C. E. S. Bernardes and J. N. C. Lopes,J. Phys. Chem. B, 2014,118, 567-576. 37. A. Triolo, O. Russina, H. J. Bleif and E. Di Cola,J. Phys. Chem. B, 2007,111, 4641-4644.
38. O. Russina, A. Triolo, L. Gontrani, R. Caminiti, D. Xiao, L. G. Hines, R. A. Bartsch, E. L. Quitevis, N. Plechkova and K. R. Seddon,J. Phys.: Condens. Mat., 2009,21.
39. A. E. Bradley, C. Hardacre, J. D. Holbrey, S. Johnston, S. E. J. McMath and M. Nieuwenhuyzen,Chem Mater, 2002,14, 629-635. 40. F. Nemoto, M. Kofu and O. Yamamuro,J. Phys. Chem. B, 2015,119, 5028-5034.
41. A. Triolo, A. Mandanici, O. Russina, V. Rodriguez-Mora, M. Cutroni, C. Hardacre, M. Nieuwenhuyzen, H. J. Bleif, L. Keller and M. A. Ramos,
J. Phys. Chem. B, 2006,110, 21357-21364.
42. O. Russina, F. Lo Celso, N. V. Plechkova and A. Triolo,J. Phys. Chem. Lett., 2017,8, 1197-1204.
43. H. V. R. Annapureddy, H. K. Kashyap, P. M. De Biase and C. J. Margulis,J. Phys. Chem. B, 2010,114, 16838-16846. 44. A. Klee, S. Prevost and M. Gradzielski,ChemPhysChem, 2014,15, 4032-4041.
Faraday
Discussions
Accepted
Manuscript
Published on 26 June 2017. Downloaded by University of York on 26/06/2017 13:43:48.
View Article Online
45. D. W. Bruce, C. P. Cabry, J. Nuno Canongia Lopes, M. L. Costen, L. D'Andrea, I. Grillo, B. C. Marshall, K. G. McKendrick, T. K. Minton, S. M. Purcell, S. E. Rogers, J. M. Slattery, K. Shimizu, E. Smoll and M. A. Tesa-Serrate, J. Phys. Chem. B, 2017, DOI: 0.1021/acs.jpcb.1027b01654.
46. M. Teubner and R. Strey,J. Chem. Phys., 1987,87, 3195-3200.
47. K. V. Schubert, R. Strey, S. R. Kline and E. W. Kaler,J. Chem. Phys., 1994,101, 5343-5355. 48. S. Prevost, T. Lopian, M. Pleines, O. Diat and T. Zemb,J. Appl. Crystallogr., 2016,49, 2063-2072. 49. http://www.isis.stfc.ac.uk).
50. R. K. Heenan, S. E. Rogers, D. Turner, A. E. Terry, J. Treadgold and S. M. King,Neutron News, 2011,22, 19-21. 51. G. D. Wignall and F. S. Bates,J. Appl. Crystallogr., 1987,20, 28.
52. J. N. Canongia Lopes, J. Deschamps and A. A. H. Pádua,J. Phys. Chem. B., 2004,108, 2038-2047. 53. J. N. C. Lopes and A. A. H. Padua,J. Phys. Chem. B, 2004,108, 16893-16898.
54. H. J. C. Berendsen, D. Vanderspoel and R. Vandrunen,Comput. Phys. Commun., 1995,91, 43-56.
55. S. Pall, M. J. Abraham, C. Kutzner, B. Hess and E. Lindahl,Solving Software Challenges for Exascale, 2015,8759, 3-27. 56. M. J. Abraham, T. Murtola, R. Schulz, S. P´all, J. C. Smith, B. Hess and E. Lindahl,SoftwareX, 2015,1–2, 19–25. 57. L. Martinez, R. Andrade, E. G. Birgin and J. M. Martinez,J. Comput. Chem., 2009,30, 2157-2164.
58. K. Shimizu, C. E. S. Bernardes, A. Triolo and J. N. C. Lopes,Phys. Chem. Chem. Phys., 2013,15, 16256-16262.
Faraday
Discussions
Accepted
Manuscript
Published on 26 June 2017. Downloaded by University of York on 26/06/2017 13:43:48.
View Article Online
![Figure 1: Small-angle X-ray scattering data for [C12mim][Tf2N] showing the three peaks (CP, COP and PNPP) commonly seen in nanostructured ILs](https://thumb-us.123doks.com/thumbv2/123dok_us/7736235.163968/4.595.215.436.98.244/figure-small-angle-scattering-showing-pnpp-commonly-nanostructured.webp)
![Figure 3: SANS data at x � ���� ���� ����� �� �C2mim-d11]1-x[C12mim]x[Tf2N] (C12-HH in C2-DD); panel b) all contrasts for x = 0.04; panel d) all contrasts for x = 0.24](https://thumb-us.123doks.com/thumbv2/123dok_us/7736235.163968/6.595.83.514.376.713/figure-sans-data-panel-contrasts-panel-all-contrasts.webp)
![Figure 5: SANS data for [C2mim-d11]1-x[C12mim]x[Tf2N�� P���� �� ����� ���� � x � ���� ��� ����� �� ��� ��������� ��� x = 0.52](https://thumb-us.123doks.com/thumbv2/123dok_us/7736235.163968/8.595.77.523.490.666/figure-sans-data-for-mim-mim-tf-p.webp)
![Figure 6: SANS data for [C2mim-d11]1-x[C12mim]x[Tf2N] (fits to other contrasts are similar): Panel a) x = 0.32 and panel b) x = 0.52](https://thumb-us.123doks.com/thumbv2/123dok_us/7736235.163968/9.595.80.525.112.290/figure-sans-data-fits-contrasts-similar-panel-panel.webp)
![Figure 8: Fits to the Teubner-Strey (TS model), Lorentz + Peak Lorentz (L+PL model) and a Lorentzian peak centered on the PNPP (PL model) are shown in purple, blue and orangerespectively for [Clow-2mim-d11]1-x[C12mim]x[Tf2N] where x = 0.74, 0.87, 0.96, 0.9](https://thumb-us.123doks.com/thumbv2/123dok_us/7736235.163968/10.595.83.520.112.291/figure-teubner-lorentz-lorentz-lorentzian-centered-purple-orangerespectively.webp)