0
0
0
a
EUROPEAN COMMISSION
Dairy sector
Working Documents
European Commission
Directorate-General for Agriculture (DG VI)
CAP2000
Working Document
Situation and Outlook
Dairy Sector
April1997
SITUATION AND OUTLOOK DAIRY SECTOR
Table of contents
Foreword
List of acronyms and abbreviations
EXECUTIVE SUMMARY
1. MAIN ECONOMIC AND STRUCTURAL FEATURES 1.1 Milk production in the EU
1.2 Number of dairy cows 1.3 Milk yields
1.4 Milk deliveries 1.5 Milk use in dairies
1. 6 Milk consumption and global balance 1. 7 Butter production and consumption 1. 8 S:MP production and consumption
1. 9 Production and consumption of other milk powder 1.10 Cheese production and consumption
1.11 Production and consumption of fresh products 1.12 Milk producer prices
1.13 Structural aspects of milk production 1.14 Regional distribution of milk production 1.15 EU position on world markets
2. THE COMMON MARKET ORGANISATION 2.1 Market support
2.1.1 System of institutional prices 2.1.2 Intervention system
2.1.3 Border regime
2.1.4 Special disposal measures 2.2 Milk quota system
2.3 Budgetary cost of the regime
3. MARKET OUTLOOK
3.1 Current world market situation and short term outlook 3.2 World market perspectives
3. 3 EU market forecasts
CONCLUSIONS
ANNEXES
CONTENT
Page
1
2 3 3
4
5
6 7 8 8 9 10 13 17 18
19 19 20 24
28
32 41
43
44
52
Foreword
In late 1995, the European Commission presented its Agricultural Strategy Paper1 in which it outlined the major challenges European agriculture and its rural areas would be facing at the tum of the century and the implications these might have for future policy developments.
In its working programme for 1997, the Commission announced its intention to present, after the conclusion of the Intergovernmental Conference, a communication on the financial framework from 2000 onwards, to be accompanied by "a very careful look at the future of the Communities policies, in particular the common agricultural policy and structural policies".
In the light of these orientations, the Directorate-General for Agriculture (DG VI) has undertaken a number of studies, which examine in detail the current situation and the longer term outlook for some of the main agricultural markets, developments in rural areas, and in world markets. These studies are being published as working documents under the common heading CAP 2000.
A general overview of agricultural market trends and long term projections of supply and demand for the main commodities is presented in "Long term Prospects: Grains, Milk and Meat Markets". These are accompanied successively by more detailed sector analyses in "Situation and Outlook" reports for the beef, dairy and grain markets and their organisation. A study on rural development under the CAP 2000 heading will follow.
1
SITUATION AND OurLOOK DAIRY SECTOR ABBREVIATIONS
List of acronyms and abbreviations
ABARE
BSE
BST (rBST) CAP
CEC CEEC CIS CMO DG
EAA
EAGGF EC EUEUROSTAT ex-GDR FAO
FAPRI FSU GATT ha IDA kg/cap. miot NUTS OECD
us
USDA SMP WMP WTOAustralian Bureau of Agricultural and Resource Economics
Bovine Spongifonn Encephalopathy (recombinant) Dovine Somatotropine Common Agricultural Policy
Central European Countries
Central and Eastern European Countries Community of Independant States Common Market Organisation Directorate-General
European Association Agreements
European Agricultural Guidance and Guarantee Fund European Community
European Union
Statistical Office of the European Communities Fonner Gennan Democratic Republic
Food and Agriculture Organisation (of the United Nations)
Food and Agricultural Policy Research Institute Fonner Soviet Union
General Agreement on Tariffs and Trade hectare
International Dairy Agreement kilogram/capita
million tonnes
Nomenclature of territoral Units for Statistics Organisation for Economic Co-operation and Development
United States (of America)
United States Department of Agriculture Skimmed Milk Powder
SITIJATION AND OUTLOOK DAIRY SECTOR EXECUTIVE SUMMARY
EXECUTIVE SUMMARY
• Milk production is the most important agricultural activity in almost all EU countries, and in the EU as a whole (18.4% of total value of agricultural production), despite the fact that the bulk of EU cow's milk is produced by only a few member states. Its importance is further highlighted if the closely-linked cattle sector (accounting for a further 11.9%) is also taken into consideration.
• With the introduction of the milk quota system in 1984, milk output declined in all member states (except Portugal), mainly due to several reductions in the reference quantities. This evolution was accompanied by an even more marked drop in the dairy cow herd as milk yields improved substantially.
• Milk deliveries to dairies have been relatively stable, but on-farm use and direct sales have declined. This is the case throughout the EU, and, in particular, in those member states where the delivery ratio was relatively low.
• Butter manufacture still absorbs about one third of the total milk produced in the EU. However, its share has been in constant decline since 1973. On the other hand, production of cheese, cream and whole milk powder has increased steadily in absolute and relative terms. Fresh products have more or less maintained their share, and the relative importance of concentrated milk has decreased.
• The manufacture of skimmed milk powder (SMP) still absorbs most skimmed milk produced in dairies. Nevertheless, the pattern of skimmed milk use in dairies has changed considerably, especially during the last 10 years. In particular, volumes used in the production of cheese, fresh products, whole milk powder and casein have increased steadily.
• Milk producer prices in nominal terms increased by +4.5% on average per year over the last 20 years, but there has been a clear slowdown in growth rates over time. Beginning with mean annual growth rates of +9.4% and +7.5% respectively in the periods 1973-79 and 1979-84 (+7.7% on average over the period 1973-84), the rise in prices slowed down progressively. In the years immediately following the introduction of the milk quota system, nominal prices increased by +2.3% per year, compared to only +0.7% in recent years. In real terms, producer prices improved slightly from 1984 to 1989 and dropped since.
• The milk quota system has had a profound effect on the dairy sector, halting and indeed reversing the upward trend in production. Nevertheless, the EU milk sector is still characterised by a significant structural surplus. This (net) surplus, estimated at around 9.0 to 9.5 mio t (whole milk equivalent), must be exported (the bulk with subsidies) or stocked. In addition, a significant part of internal consumption is subsidised by means of special disposal measures, involving around 11 mio t milk equivalent. The budget costs of these special disposal measures represent around a third of the market price.
• In this surplus situation, producer prices, and the income of dairy farmers, depend on prices determined to absorb excess production in the form of butter and SMP, by intervention or by special disposal measures. The producer price for milk follows relatively closely the evolution of the target price for milk - an institutional price derived from the intervention prices for butter and SMP, assuming a certain support level.
SITUATION AND OUTLOOK DAIRY SECTOR EXECUTIVE SUMMARY
• The milk quota system, like other production control systems based on individual references quantities, creates a heavy administrative burden. Experience has shown that the implementation of such a system is not easy. Some member states were rapidly able to ensure the correct application. Others had great problems, not only because of administrative difficulties, but also due to special circumstances whose impact on the functioning of the system should not be underestimated (large numbers of small producers; quality of information on which the different elements of the quota system are based, in particular, in the initial period of implementation; level at which the system is administered; etc.). Last, but not least, the necessary political will to implement such a system must exist.
• Due to CAP supported milk prices and relatively high operating margins, large economic rents associated with production rights have been incorporated into quota values. For new entrants and those wishing to expand their production, quota availability is a major problem. Rising quota values imply either higher fixed costs (if quotas are purchased as a permanent asset) or higher variable costs (through short-term lease and rent arrangements) for new entrants or those wishing to expand milk production and, therefore, a reduction in competitive advantage for these dairy farmers.
• In general, the price of milk quotas (for purchase or lease/rent) - and also the trade volume - does not only depend on the milk price itself (or even more on the margins on milk production) and the level of the additional levy. It also depends on the regulatory framework, such as, for example, transfer restrictions or provisions for the depreciation of expenditure on quota. In this respect, the economic consequences can be quite different from one member state to another, as quite different rules often apply. It can be argued that a system of free tradable quotas could provide an economically optimal allocation of production rights, as the most efficient dairy farmers with high margins should be best able to bid for available quotas.
• On the other hand, existing producers benefit from additional revenues (windfall gains) provided by the sale, rent or lease of quota. Of course, the higher values ascribed to milk quota also have an impact on the values of other fixed assets such as land. High quota values can provide the incentive and the financial means for many low margin producers, and those with no successor, to leave farming by selling or leasing their quota to more efficient expanding producers or new entrants.
• However, there are also a number of arguments in favour of the quota system. The binding of quota to land, for example, has contributed significantly to maintaining dairying in less competitive areas, in particular, in mountain and less-developed areas, because production can less easily respond to differences and changes in costs, technology or demand. Nevertheless, certain adjustments within countries are possible because quotas are to a some extent tradable within certain member states.
• Despite criticism that the milk quota regime hampers structural adjustment due to its inflexible nature, it must be pointed out that important structural changes have in fact occurred in the EU milk sector. The move towards more concentration, already evident prior to 1984, in order to benefit from economies of scale, has persisted at both producer and dairy level, and is likely to continue to characterise the evolution of the dairy sector in the future.
SITIJATION AND OUTLOOK DAIRY SECTOR EXECUTIVE SUMMARY
• As regards the medium-term outlook for milk in the EU, cow milk production is forecast to decrease slightly each year from 121.6 mio tin 1996 to around 119.4 mio t in 2001 and about 118.1 mio t in 2005. This result is based on the assumption that milk reference quantities remain unchanged until then and effective deliveries adjust to the level of available quotas. Furthermore, a slight increase in milk fat content and in the delivery ratio is assumed. Global demand for milk (in whole milk equivalent) is expected to decline from 111.8 mio tin 1995 to 110.4 mio tin 2001 and around 108.7 mio t in 2005. This is the net result of falling consumption of some milk products, notably butter, but also in the animal feed sector. It is expected that this will be partially compensated by increasing demand for other items, in particular cheese and fresh products. The above forecasts indicate a net annual surplus of around 9.0 to 9.5 mio t (whole milk equivalent) up to 2005, with a slight decrease in the short-tenn but with a tendency to increase at the end of the forecast period.
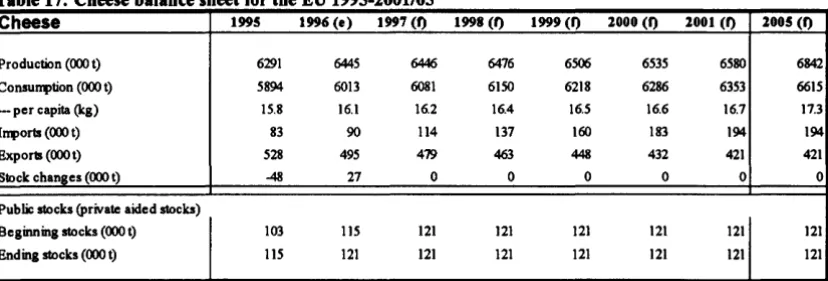
• , For cheese, a further increase in domestic use is expected, but with a more modest growth rate than in the past (+0.8% per capita/year). Cheese imports are forecast to increase, mainly due to the GATT and other market access agreements. Exports will decrease, even on the assumption that a part of the required reduction of subsidised exports can be compensated for by an increase of non-subsidised exports. In any case, in the cheese sector, GATT commitments represent a constraint, limiting the scope for further growth.
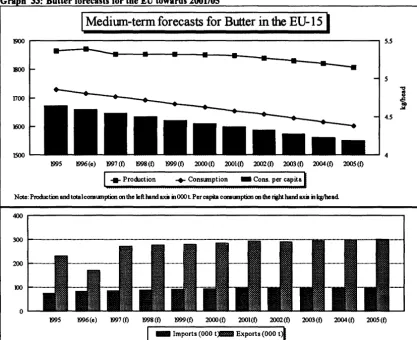
• In the case of butter, domestic consumption is expected to continue to decline (-0.7% per capita/year), but more slowly than in the past. Imports of butter could increase by around 15,000 t due to the GATT and other market access agreements. Butter production is expected to remain relatively stable over the 1997-2001 period and to fall slightly subsequently. On the export side, the margin to fulfil GATT commitments should be more than sufficient. Nevertheless, relatively high exports (around 300,000 t at the end of the forecast period) will be necessary in order to keep intervention stocks down.
• Forecasts for SMP indicate a further drop in consumption, mainly in animal feed use, while human consumption is projected to remain more or less stable. Due to lower availability of milk, and increasing use of skimmed milk in the manufacture of other dairy products (fresh products, cheese), SMP production is likely to decline also, but to a lesser extent than consumption. Excluding the possibility of exports without refunds, the forecasts envisage a situation where intervention stocks for SMP tend to increase from 1998 onwards as the GATT commitments on subsidised exports become binding.
• As far as other milk products are concerned, the forecasts indicate that consumption of fresh products will continue to increase, but modestly given the ~lready high level of per capita consumption. Demand for other milk powder (mainly whole milk powder) is also expected to increase slightly, while there is a strong upward tendency in internal demand for cream. Finally, consumption of concentrated milk is expected to decline further. As in the case of cheese, there is pressure on these products because the volume of subsidised exports must be reduced as a result of the GATT agreement.
• Internationally, only a small part of world milk production is traded (around 6% of total world production, estimated by the FAO at 537 mio tin 1996). The international markets are dominated by a few players. The EU, as the main producer, exported between 10 and 15% of its production in the past and is still the world's biggest exporter. However, the EU share on world markets has been declining steadily for several years, but is still at around 45%. The next two most important exporters, New Zealand and Australia, rank only among the world's medium or even small producers,
SITUATION AND OUTLOOK DAIRY SECTOR EXECtiTIVE SUMMARY
but are much more export-oriented than the EU and are developing further their export capacities.
• There is a broad consensus among analysts that world markets for dairy products are likely to expand. As far as the main milk producer countries are concerned, production growth is expected to be concentrated in those countries where production is not subject to a quota system. It will be particularly strong in countries with a low level of support for the dairy sector, and where farmers can respond rapidly to new market opportunities, such as, for example, Australia and New Zealand. Among the other big developed countries, positive growth rates are forecast for the US and Japan, while production in the EU, Canada and in some of the former centrally planned countries is projected to decrease. A marked increase in production is also expected in Latin and South America and Asia.
• Consumption should globally follow the same trend as production. Amongst the developed countries, a significant increase is projected only for the US and Japan, while consumption in other developed countries is likely to fall. In contrast, consumption is expected to continue to increase by around +2.6% on average per year in developing countries. The perspectives for consumption are most favourable in Asia and Latin America. In general, growing population and urbanisation, coupled with an increase in average incomes, will be the main factors underpinning rising consumption. Other regions in the world, in particular Africa, should also see some improvements, but mainly due to higher population; per capita consumption could even decrease in some cases.
• Improved market balance for dairy products, combined with a decline in subsidised exports resulting from the GAIT Uruguay Round Agreement, and relatively strong demand in a number of non-OECD countries, should lead to higher international prices for dairy products, compared to the first half of the 1990s. The price of cheese is expected to remain firm due to steadily rising demand. The world price for SMP will follow more or less the same trend, mainly as a result of growing demand in the main importing countries, a shift from SMP to WMP exports by New Zealand and the constraining GAIT commitments for some countries as far as subsidised exports are concerned. WMP world market prices will also remain relatively high because of strong demand. Finally, the world butter price is expected to continue to fall from its 1995 record level. Nevertheless, it will still be above the 1991-95 average at the end of the forecast period.
• As international prices for cheese, SMP and WMP are expected to rise, the difference between EU domestic prices and world market prices for these products is likely to narrow. This, coupled with relatively small volumes of public stocks, especially in the US and the EU, could make prices of some dairy products more sensitive to changes in supply and demand in the international market. According to the OECD, mainly butter and SMP prices will be affected and might show quite important fluctuations, the extent of which is difficult to quantify. Nevertheless, although decreasing over the forecast period, the price gaps between the EU and other main producer countries are projected to remain relatively large.
SITUATION AND OUI'LOOK DAIRY SECTOR EXECUI'IVE SUMMARY
markets are likely to be Australia and New Zealand. The cheese sector, in particular, seems to be affected. No major changes are expected for the US and Canada.
• Against this background, it seems likely that market prices in the EU will remain under pressure, due to the internal surplus situation, increasing access to EU markets and difficult conditions for participating in the favourable development of world markets. Certainly, competitive producers have a margin and the tendency towards larger dairy holdings, in order to benefit from economies of scale, will continue to characterise the evolution of the EU dairy sector in the future. However, within the current regulatory framework, quota availability will be a major problem for new entrants and those wishing to expand their production. Purchase, leasing or rent of quota implies higher costs and, therefore, a reduction in competitive advantage. This issue will become more and more important over time as, due to the expected structural change towards larger dairy holdings, increasing volumes of milk will be affected.
CHAPTER1 MAIN ECONOMIC AND STRUC11JRAL FEATURES
1. MAIN ECONOMIC AND STRUCTURAL FEATURES
1.1 Milk production in the EU
In most member states, and in the EU as a whole, milk production is the most important agricultural activity. At EU level, around 18.4% of the total value of agricultural production derives from this sector (the closely-linked cattle sector contributes a further 11.9% to output). The milk sector generates a high proportion of agricultural output, especially in the northern member states; Luxembourg with 43.8% is followed by Ireland, Finland and Sweden with more than 30%. In the south of the EU, the role of milk is relatively modest compared to other products.
In 1995, the EU produced around 121.2 mio t of cow milk1>. The two largest producer countries, Germany and France, accounted for nearly 45%. These two countries, together with the United Kingdom, the Netherlands and Italy, account for around 75% of EU cow milk output. Following enlargement, EU production increased by around 8.9 mio t (or 7.9% of EC-12 production). According to estimates for 1996, EU-15 milk production was around 0.4 mio t higher than in 1995. It is currently estimated at around 121.6 mio t.
T bl 1 C a e : ow M'lk P d I ro uctlon . b M 1y em er tate b S 1984 an d 1995
Germany (old) Germany (new) France Italy Netherlands Belgium Luxemburg United Kingdom Ireland
Denmark Greece Spain Portugal
EC-12
Austria Finland Sweden
EU-15
Notes:
Source:
Cow Milk Production by Member State
1984 1995
OOOt Share In% Share In final OOOt Share In% Share In final
agricultural agricultural
output output
26151 22.0" 25.2" 22898 18.9"
-(34880) -
-
28621 23.6" 26.7"2noo
23.3" 16.9" 25413 21.0" 17.1"10901 9.2" 11.4" 10236 8.4" 11.2"
12782 10.8" 26.5" 11295 9.3" 21.5"
3819 3.2" 15.9" 3375 2.8" 14.8"
299 0.3" 44.6" 269 0.2" 43.8"
17882 15.0" 20.1" 14749 12.2" 23.6" 5730 4.8" 32.3" 5421 4.5" 33.7"
5234 4.4" 22.2" 4673 3.9" 22.0"
791 0.7" 8.3" 764 0.6" 12.8"
6392 5.4" 9.2" 5750 4.7" 8.5" 1192 1.0" 9.9" 1760 1.5" 12.9"
118873 100.0" 17.4" 112326 92.6" 17.9"
3769 3.2" 21.8" 3148 2.6" 20.6"
3224 2.7" 34.9" 2468 2.0" 36.6"
3n3 3.2" 31.6" 3304 2.7" 32.6" 129639 109.1" 18.2" 121246 100.0" 18.4"
Figures for Germany (old) exclude the former GDR.
The share in final agricultural output refers to total milk production (incl. sheep and goat milk),
whereas production figures are only for c~ milk
Figures for 1995 are provisional. EUROSTAT, DG Vl-01 and DG VI-A2
1984-1995
Production change In%
-12.4%
(-17.9%)
-8.3% -6.1% -11.6% -11.6% -10.0% -17.5% -5.4% -10.7% -3.4% -10.0% 47.7% -5.5% -16.5% -23.4% -12.4% -6.5%
CHAPTER! MAIN ECONOMIC AND STRUCTURAL FEATIJRES
Since the milk quota system was introduced in 1984, cow milk production has increased only in Portugal. Production in all other member states dropped, from -3.4% in Greece to -17.5% in the United Kingdom. A similar trend is evident in Austria, Finland and Sweden.
1.2 Number of
dairy
cowsIn the same period, the decline in dairy cow herds was even more marked, as
increased milk yields led to a reduction in the number of animals necessary for producing a given quantity of milk. In most member states, the dairy cow herd shrank by more than 20% over the last ten years. This reduction was particularly marked in the years 1984/85, 1987 and 1990-1992, due to milk quota cuts and herd destocking in the former GDR. According to the Livestock Survey of December 1996, the EU-15 dairy cow herd totalled 22.1 mio head, representing a 2.0% decrease on 1995.
T bl a e 2 : N um ero b fD . atry ows ,y em er tate C b M b S 1984 an d 1996
Germany (old) Germany (new) France Italy Netherlands Belgium Luxemburg United Kingdom Ireland
Denmark Greece Spain Portugal
EC-12
Austria Finland Sweden
EU-15
Notes:
Source:
Number of Dairy Cows by Member State
1984 1996
OOOh•d Share In% Shareln%of OOOhead Share In%
total cattle
5582 20.7% 35.6% 4162
(7662)
-
-
51856764 25.1% 29.3% 4562
2841 10.6% 31.0% 2125
2437 9.1% 46.2% 1642
982 3.6% 32.9% 645
71 0.3% 32.1% 48
3311 12.3% 25.5% 2509
1523 5.7% 26.0% 1272
948 3.5% 35.1% 697
224 0.8% 29.6% 187
1877 7.0% 38.1% 1293
355 1.3% 27.7% 362
26916 100.0% 31.7% 20527
985 3.7% 36.9% 698
642 2.4% 40.4% 396
656 2.4% 34.9% 478
29199 108.5% 32.3% 22098
F1gures for Germany (old) exclude the former GDR.
Figures are based on the results of the December Livestock Survey.
Figures for 1996 are provisional.
EUROSTAT, DG Vl-01 and DG VI-A2
18.8%
23.5%
20.6%
9.6%
7.4% 2.9% 0.2% 11.4%
5.8% 3.2% 0.8% 5.9%
1.6%
92.9%
3.2%
1.8% 2.2%
100.0%
1984-1996
Share In %of o.lrycows
total cattle change In%
32.4% -25.4%
33.1% (-32.3%)
22.2% -32.6%
28.8% -25.2%
37.6% -32.6%
21.0% -34.4%
22.9% -32.7% 22.1% -24.2%
18.8% -16.5%
34.0% -26.5%
34.6% -16.6%
23.0% -31.1%
27.6% 2.0%
26.0% -23.7%
30.7% -29.2%
34.4% -38.4%
27.4% -27.1%
26.3% -24.3%
The reduction in dairy cow numbers has been partly compensated by increasing numbers of other cows (mainly suckler cows). On average, during the period
CHAPTER I MAIN ECONOMIC AND STRUCTIJRAL FEATURES
1.3 Milk yields
The following graph shows the evolution of milk yields in the EU since 1973. In the period 1973-1995, milk yields increased by around 1.9% on average per year. A similar pattern has been obseiVed over the ten year period of the quota system. Lower rates obtained at the beginning (+1.3% from 1984-89), increased in recent years (+2.4% between 1989 and 1996). Milk yields currently range from 4200 kg per dairy cow in Greece and 4500 kg in Spain and Portugal to more than 6500 kg in some northern member states (Sweden, Denmark and the Netherlands), where climatic and structural conditions for milk production are more favourable than in the south.1> This compares
to an EU average of around 5400 kg per dairy cow. In 1985, the EU milk yield averaged around 4360 kg. Over the last ten years, therefore, there has been an increase of about 1050 kg per cow or +24.1%.
Gra h 1: Evolution of milk 'elds in the EU 1973-1996
-. EC9 + EClO
1. 4 Milk deliveries
Dairy Cow Milk Yields
(in kg per dairy cow)
I
~~~:
.... ····1
i-it·-+···i·
'
: ' I
I
:
I
-+--+---1-·-+-~---+-~+--t
I
w EC-12 (w~out cx-ODR) • EC-12 (ilC:I. cx-ODR) + EU·lS (incl. cx-ODR)
I
-~--1
About 93.5% of cow milk output is delivered to dairies. The remainder is used on the farm (animal feed, human consumption) and for direct sales (farm products). At member state level, only Austria, Greece, Spain and Belgium record delivery ratios below 90%. Over the past 15 years, on-farm use and direct sales have been declining, not only in relative but also in absolute terms. In 1995, around 4.4 mio t of whole milk was used as animal feed. A further 4. 4 mio t was absorbed in the production of farm butter, cheese and fresh products. In the case of fresh products, about 1.5 mio tout of a total of2.5 mio t appear in the official statistics as farm (home) consumption.2>
l) However, among the northern member states, milk yields in Ireland are also relatively low, reaching around 4200 kg per daily cow.
l) There are some deficiencies with the official statistics in the milk sector, especially as far as on-farm use and direct sales are concerned. The Court of Justice has complained several times about the available information on direct sales from farms, for which separate reference quantities are fixed, in order to control the correct application of the milk quota system.
CHAPTER I MAIN ECONOMIC AND STRUC11JRAL FEATURES
T bl 3 Deli a e : venes o fC ow M"lk b M I )y em er ae b St t 1984 1994 t an d 1996
Deliveries of Cow Milk by Member State
1984 1994 1996 (p) 1984-1996
Germany (old) Germany (new) France Italy Netherlands Belgium Luxemburg United Kingdom Ireland Denmark Greece Spain Portugal
EC-12
Austria Finland Sweden
EU-1& Notes:
Source:
000 t Share In% Delivery ratio OOOt In% oftotal production
24304 22.7% 92.9% 21689
(31596)
---
---
2604726055 24.4% 94.1% 23278
8198 7.7% 75.2% 9540
12465 11.7% 97.5% 10496
3048 2.8% 79.8% 2916
293 0.3% 97.9% 251
15767 14.7% 88.2% 14322
5585 5.2% 97.5% 5280
5034 4.7% 9<S.2% 4441 454 0.4% 57.4% 639
4787 4.5% 74.9% 4926
985 0.9% 82.5% 1497 106975 100.0% QO.O% 103633 2433 2.3% <S4.5% 2207
3029 2.8% 94.0% 2390
3677 3.4% 97.5% 3357
116114 108.5% 89.2% 111587 FigUres Tor Germany (010) IXCIUOe me Tonner GUR. Figures for 1996 are prOIIislonal.
EUROSTAT, DG VI-D1111d DG VI-A2
1.
5 Milk use in dairies
Share In% Delivery ratio ooot Share In% DeUverles In% of total change In%
production
20.9% 9<S.7% 22168 19.5% -8.8%
25.1% 93.5% 27007 23.7% (-14.5'111)
22.5% 92.1% 23287 20.5% -10.6%
9.2% 94.9% 10187 9.0% 24.3%
10.1% 95.7% 10500 9.2% -15.8%
2.8% 87.2% 3003 2.5% -1.5%
0.2% 9<S.O% 258 0.2% -12.0%
13.8% 95.4% 14203 12.5% -9.9%
5.1% 97.8% 5341 4.7% -4.4%
4.3% 95.7% 4475 3.9% -11.1%
0.6% 93.1% 665 0.6% 46.5%
4.8% 87.1% 5296 4.7% 10.6%
1.4% 91.4% 1650 1.4% 67.5%
100.0% 93.5% 105872 93.0% -1.0%
2.1% <S8.3% 2350 2.1% -3.4%
2.3% 95.1% 2328 2.0% -23.1%
3.2% 98.1% 3260 2.9% -11.3%
107.7% 92.9% 113810 100.0% -2.0%
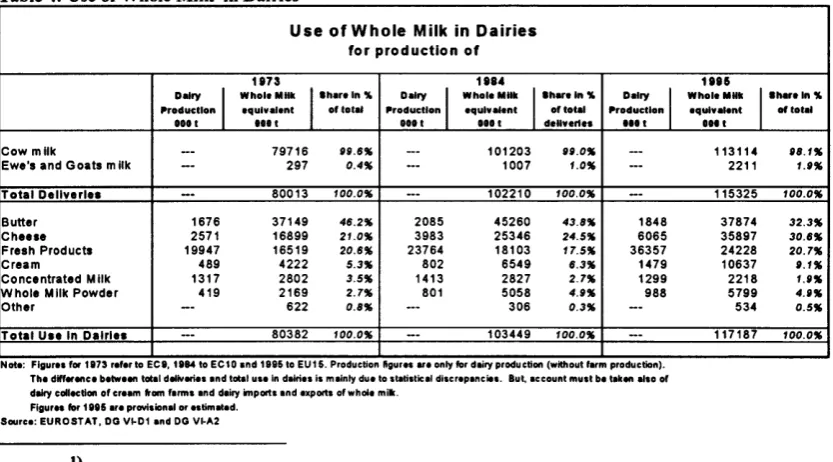
Butter production remains the most important use of whole milk, with cheese now coming a close second. In 1995, butter absorbed 32.3% of the total available whole milk1> - around 3 8 mio t. Nevertheless, its share continues to decline as it has done since 1973, when more than 46% of milk was used for the manufacture of butter. On the other hand, the use of milk in the production of cheese, fresh products, cream and whole milk powder continues to increase in absolute and relative terms. At present, cheese-making absorbs almost as much milk as butter manufacture. In third place comes fresh products, with a share of around 21%, which has remained more or less constant in recent years.
Table 4: Use of Whole Milk in Dairies
Use of Whole Milk in Dairies
for production of
1873 18U 1885
D-ry
I
Whole Milk llhareln "4 DairyI
Whole Milk llhareln "4 DairyI
Whole Milk llhareln "4,.roductlon equivalent of total ,.roductlon equlv•ent of total ,.roductlon equivalent of total OOOt ••• t 0001 Otot deliveries t i l t 0011
Cow milk --- 79716 09.6" --- 101203 90.0" --- 113114 08.1"
Ewe's and Goats milk
--
297 0.4"---
1007 1.0" --- 2211 1.0"Total Dellverlet
--
80013 100.0" --- 102210 100.0"--
115325 100.0"Butter 1676 37149 46.2" 2085 45260 43.8" 1848 37874 32.3"
Cheese 2571 16899 21.0" 3983 25346 24.5" 6065 35897 30.6"
Fresh Products 19947 16519 20.6" 23764 18103 17.5" 36357 24228 20.7"
Cream 489 4222 5.3" 802 6549 6.3" 1479 10637 1.1"
Concentrated Milk 1317 2802 3.5" 1413 2827 2.7" 1299 2218 1.0"
Whole Milk Powder 419 2169 2.7" 801 5058 4.0" 988 5799 4.0"
Other
--
622 0.8" --- 306 0.3"--
534 0.5"Total Ute In Dairies --- 80382 100.0" -- 103449 100.0" -- 117187 100.0"
Note: Flgurn fO# 1873 refer to EC8, 1884 to EC10 and 1885 to EU15. Production ftgurn are only for de1ry production (without f•rm productiOn). The difference between tot•l deliveries •nd total use In d•lries is mainly due to statistical discrepancies. But, account must be t•ken also of dM}' collection of cream torn f•rms •nd dairy irnpO#Is •nd expO#Is of whole mi•.
Flgurn for 11186 •r• prOYisionel or estimated. Source: EUROSTAT, OG Vl-01 and OG VI-A2
I) Total availability of whole milk in dairies differs somewhat from quantities collected by dairies (= delivered by
fanners) mainly due to statistical discrepancies. Account must be taken also of dairy collection of cream on farms and dairy imports
[image:19.560.83.502.90.352.2] [image:19.560.84.501.530.761.2]CHAPTER! MAIN ECONOMIC AND STRUCTURAL FEATURES
While figures for the production and delivery of whole milk are directly available, the quantities of skimmed milk produced in dairies must be calculated. Skimmed milk is released during the process of defattening whole milk to obtain cream - the starting point for butter production. Subsequently, skimmed milk is used in various ways: in liquid form (returned to farms) as animal feed; in dehydrated form as skimmed milk powder (SMP), the bulk of which ends up also in feedingstuffs; in the manufacture of other milk products (together with whole milk) and, after fragmentation into casein, as protein in the agri-food and chemical industry. Most skimmed milk is derived from butter production, even though the importance of cream is increasing.1>
Changing consumer preferences towards lower fat products, and the increasing popularity of cheese and fresh products have led to significant changes in the pattern of
skimmed milk use in dairies, during the last two decades. Its use in cheese and fresh
products increased from around 9 mio t in 1973, representing a share of 23.9%, to more than 23 mio t or 51.6% in 199 5. In contrast, the share of skimmed milk powder production and animal feed (returns to farms) fell from nearly two thirds to less than one third, during the same period. Nevertheless, skimmed milk powder still absorbs over 3 0% of the skimmed milk produced in dairies. An upward tendency is also evident in casein manufacture.
Table S· Use of Skimmed Milk in Dairies
Use of Skimmed Milk in Dairies for production of
1873 1884 1886
Dllry llklmmed Milk llh1re In% D1lry llklmmed Milk llh1reln% Dllry
I
lklmmed MilkII
here In % ll'roductlon equlvelenl of 10111 ll'roduc:llon equlvelenl of 10111 ll'roductlon equlnlent of Ioiii. . . . 0001 000 I 000 I 0001 . . . .
Butter 1676 35474 90.5" 2085 43179 88.3" 1848 36026 79. 7"
Cream 489 3733 9.5" 802 5747 11.7" 1479 9157 20.3"
Total Dairy Production --- 39207 100.0"
--
48926 100.0" -- 45183 100.0"Cheese 2571 5538 14.6" 3983 8222 16.9" 6065 10981 24.4"
Fresh Products 19947 3532 9.3" 23764 5708 11.7" 36357 12282 27.2"
Concentrated MIlk 1317 309 0.8" 1413 456 0.9" 1299 658 1.5"
Skimmed Milk Powder 1802 19712 51.9" 2109 22975 47.1" 1276 13779 30.6"
Whole Milk Powder 419 940 2.5" 801 1310 2.7" 988 1593 3.5"
Casein 56 1859 4.9" 121 4089 8.4" 134 4400 9.8"
Other Uses
--
1654 4.4" --- 1160 2.4" -- 1135 2.5"Returned to farms --- 4466 11.7" --- 4831 9.9"
--
268 0.6"Total Use In Dairies --- 38010 100.0" -- 48751 100.0"
--
45096 100.0"Note: Figures fot 1173 refer to ECI, 11114 to EC10 and 1115 to EU15. Production ftgur11 are only for d11ry production (without ferm production). The difference between total dairy production and totel uuln dairin is mainly due to at•tiatic•l diacrep•nciea. But, •ccount must be t1k1n •lao of other sources (u" of milk p-d• from stocks, etc.) •nd d•lry irnpotts •nd expotts of skimmed milk.
Flgur11 for 1115 are provisional or ntim•led. Source: EUROSTAT, OG Vl-01 end DG VI-A2
1. 6 Milk consumption and global balance
The following graph shows clearly the growing gap between production and demand, starting in the mid 1970s which, together with a depressed world market, led to the build-up of costly stocks during the 1980s. Total milk consumption, expressed in
l) This separation is practiced in the current system of milk statistics even if it does not correspond to the "real'' situation
in dairies. As explained above, whole milk is separated into skimmed milk and cream. After that, butter is produced by using (a part
of the) cream obtained.
[image:20.562.64.478.397.638.2]CHAPTER! MAIN ECONOMIC AND STRUCTURAL FEATIJRES
whole milk equivalent•>, remained more or less stable, while milk production rose steadily. By 1988, the gap had narrowed in response to increasing demand and falling output. In recent years, production and consumption developed relatively closely, with a surplus ranging from 8. 5 to 9. 5 mio t. Over the last two decades, per capita consumption of milk, expressed in whole milk equivalent, has decreased from around 360 kg/head in 1973 (EC-9) to stabilise at around 300 kg/head (EU-15) in recent years.
Gra h 2: Milk Production and Consum tion in the EU 1973-1996
EU MIlk Production and Consumption
EC9 S:::10 S:::12
S:12wllh
ex-GDR BJ15
,aoo~---r---~---4---r---~~
120000
100000
80000
- r r r
80000
40000
20000
I .. ~
I
c:::J Per cap. consumption (kg/head) -+-Production ---ConsumptionI
Note: Milk consumption is expressed in whole milk equivalent.1. 7 Butter production and consumption
The beginning of the 1980s saw enormous quantities of
butter
in EU cold stores, and the need to control production in the dairy sector led to the introduction of the milk quota system in 1984. In the first two years of the operation of the new regime, butter production dropped only to peak once again in 1986. At the end of that year, butter stocks stood at a record level of 1.37 mio t, representing more than 60% of annual production at that time. Due to further EU measures (cuts in milk quotas, stronger penalties for production over quota, intervention price cuts and changes in intervention rules, etc.), butter production has declined steadily since then, except for a short period from 1988-1990, but stabilised in recent years. Overall, EU butter production dropped by -11.8% from 2.120 mio t in 1984 (EC-1 0 without the former GDR) to an estimated 1.870 mio tin 1996 (EU-15). The biggest producers of butter in the EU are GermanyCHAPTER I MAIN ECONOMIC AND STRUCTURAL FEAWRES
(26% of total), France (25%) and the Netherlands (10%), while the four Mediterranean countries account for only about 7%.
Gn h 3: Butter Production and Consum tion in the EU 1973-1996
EU Butter Production and Consumption
EC10 EC12
IC12wllh
ex411R Bl15
r - - - + - - - t t - - - + - - - t - - - , . 7.00
.:··
:· I'':'
5.00
....
4.50
0 4.00
~ ~ ~ ~ § ~
s
I
i
!
I !
!
I
i
I I
~!
i
I
!
I I
I
c:::::J Per cap. consumption (kg/head) -+-Production ... ConsumptionI
Per capita consumption of butter has been on a long-term declining trend since 1974, apart from the 1983-1988 period. In recent years, however, consumption has stabilized at around 4.6 kg per head, compared to 6.9 kg/head in 1974. In the last decade, per capita consumption in the EU fell, on average, by more than 1 0%.1> Almost all member states have experienced this decline. Only Greece and Portugal recorded an increase in the last ten years, but at a very low level. In absolute terms, total consumption in
EU-15 is actually more or less at the same level as in EC-9, at the beginning of the 1970s. Although difficult to quantify, consumption would have fallen even more without the EU subsidized disposal measures. In 1995, for example, these measures concerned about 500,000 t ofbutter, representing around 30% of total consumption.
1. 8 SMP production and consumption
The drop in SMP production was even more marked than for butter (more than 40% since 1973). For 1996, EU-15 output is estimated at around 1.26 mio t, compared to 2.10 mio t in 1984 (EC-1 0 without the former GDR). Over 80% comes from four member states: Germany and France (each accounting for around 32%), Ireland and UK (both with around 9% ). Animal feed accounts for nearly 70% of total domestic use of SMP. Domestic use amounted to around 1. 03 mio t in 1996 and about two thirds of this are subsidized. The SMP market tends to fluctuate. Important volumes (up to 60% of total production) flow from the producer regions to the main demand regions in the EU - those countries with important production of calves for slaughter, such as France, Spain, the Netherlands and Italy. Other uses of SMP (mainly human consumption) show a slight upward tendency.
1
) Excluding the effect of EU enlargements.
CHAPTER! MAIN ECONOMIC AND STRUCTURAL FEATURES
Gra h 4: SMP Production and Consum tion in the EU 1973-1996
EU SM P Production and Consumption
EC9 EC10 EC12
IC12wllh
ex-GDit BJ15
»00~---+---+---+---r--~
2500
2000
i
15001000
500
~ ~ ~ ~ ~ ~ ~
!
!
! ! i I I i I !
~!
~i ! I I
I
c:::J Animal Feed ~Other Use ----Total Domestic Use -ProductionI
1. 9 Production and consumption of other milk powder
In contrast, production of other milk powder, mainly whole milk powder (WMP), rose by more than 20% in the 1984-1995 period to close to 1 mio t. France (28% ), Germany (22%), the Netherlands (15%) and Denmark (11%) are the main producers and account for about 75% of the total. Less than 45% is consumed within the EU. Most is exported to third countries (1995: 0.597 mio t), notably to Algeria, Latin America, the Middle and Far East. Expressed in whole milk equivalent, the export volume (around 3. 5 mio t) is more important than that of cheese exports.
Gra h 5: WMP Production and Consum tion in the EU 1973-1996
EU WM P Production and Consumption
EC9 EC10 EC12
IC12wllh
ex-GDit BJ15
1200 ...---+---+---t---+---,.1.50
1000
800
400
200
lc:::::~Percap. consumption (kg/head) -Production --Consumption
I
1.10 Cheese production and consumption
1.40
1.30
1.20
1.10
1.001
~
0.80
0.80
0.70
0.80
CHAPTERl MAIN ECONOMIC AND STRUCTURAL FEATURES
mio t in 1996 (EU-15). Like other milk products, it is concentrated in a few member states. In 1995, around 75% of the total (6.29 mio t) was produced by only four countries: France (26%), Germany (23%), Italy (14%) and the Netherlands (11%). Demand is mainly concentrated in Germany (27%), France (24%) and Italy (18%). Next comes the UK with just 8%. The Netherlands, one of the main producer countries, is clearly export-oriented and accounts for only 4% of total domestic use in the EU. Consumption per capita increased by 12.6% between 1984 (EC-10 without ex-GDR) and 1995 (EU-15), from 14.1 kg/head to 15.9 hg/head. Wide variations exist between member states. While per capita consumption in Ireland, UK, Portugal and Spain is still below 8 kg/head, the French and the Greeks consume more than 22 kg.
Gra h 6: Cheese Production and Consum tion in the EU 1973-1996
7000
8000
5000
4000
=-l
3000
2000
1000
EU Cheese Production and Consumption
EC9 EC10 EC12
IIC12with
ex.QDR BJ15
, - - - + - - - t - - - + - - - t - - - - r 17.00
~
I"'
n
§
.
... ~r
-1":' ~
~ ~ ~ ~ ~ ~
!
m mi
~I i
~!
~!
~i ! I I
I
c::::::J Per cap. consumption (kg/head) ..._Production ----ConsumptionI
15.00
14.00
I
13.00 a.12.00
11.00
1.11 Production and consumption of fresh products
In the category "fresh products", output also increased by more than 50% during the period from 1984 to 1995. However, a big part of this increase is attributable to the accession of Spain and Portugal in 1986. Excluding the impact of this enlargement, production rose more modestly by around 10%. Output of "drinking milk"'>, by far the most important item, remained relatively stable. However, the manufacture of other items, such as cream, acidified milk (yoghurt and yoghurt preparations), milk-based drinks and other fresh products (milk jelly, etc.) increased. The main producers are Germany (21%), UK (19%), France (15%), Spain (12%) and Italy (9%). Cream
production is concentrated mainly in Germany (43%) and France (17%). Per capita consumption of fresh products (incl. cream) increased by 2.7% from 104.7 kg/head in 1984 (EC-10 without ex-GDR) to 107.5 kg/head in 1995 (EU-15). This rate of change might appear quite negligible, but applies to an already very high absolute level. In some member states, consumption is well above the EU average, with Ireland leading with more than 180 kg/head. On the other hand, consumption in Italy and Greece is only respectively about 65 and 60 kg/head.
l) In 1995, dairy production offresh products (excluding cream) totalled 36.4 mio t, of which about 29 mio t were liquid milk.
CHAPTER! MAIN ECONOMIC AND STRUCTURAL FEATURES
Gn b 7: Production and Consum tion of Fresh Products in tbe EU 1973-1996
EU Fresh Products (excl. cream) Producaon and Consumption &:12 llh w
E:Ct E'C10 E'C12 ex-GDR BJ15
...I ~
... 35000
... ...:P"'
-~
r-
._....I
30000
~ r-
r-25000
-
~ ':':
r-r
-~ ,.,..
15000 r
10000
5000
:= ..
§ ~ ~ ~ ~ ~ ~
!
~i i i ! I
! !
I
~i
!
!
I ! I
I
t::::J Per cap. consumption (kg/head) -+- Production -ConsumptionI
Gn b 8: Cream Production and Consum tion in tbe EU 1973-1996
EU Cream Production and Consumpaon
s:t E'C10 E'C12
11100
1400
1200
1000
=
I
800~~--:;;r'
800
.A
-400 r:'"
":'
~
n
n
n
n
B:12wllh ex-GDR
§
~ ~ ~ ~ ~ ~!
~i i i ! I ! ! I
~i
! !
lc::::JPerc:ap. consumption (kg/head) -+-Production -Consumption
I
1.12 Milk producer prices
BJ15
,,....r.
~-·
105.00
104.00
103.00
102.00
101.00
100.001
118.00
118.00
87.00
118.00
115.00
3.80
3.80
3.40
3.20
3.00
2.801 a. 2.80
2.40
2.20
2.00
1.80
CHAPTER! MAIN ECONOMIC AND STRUCTIJRAL FEATIJRES
There are wide variations between member states ranging from Portugal with 19.75 ECU/100 kg, Spain (27.28 ECU), Austria (28.00 ECU) and Ireland (28.34 ECU) to Denmark (32.60 ECU), Italy (36.41 ECU) and Sweden (38.03 ECU). A big part of these price differences between member states can be explained by differences in the fat content of milk delivered.•> When expressed on the basis of milk with a standardised fat content of 3. 7%, the difference between the lowest (Portugal) and the highest producer price (Sweden) narrows considerably.
Gra h 9: Producer rice for cow milk at actual and 3. 1•1. fat content b Member State in 1996
Producer Price of Cow Milk- 1996
(actual fat content; in ECU per 100 kg)
France Nethedand. Luxemburg I.-land O..ece Portugal Autlia S11eden
Oeonany Italy Belgium Ulited Kingdom Denmadc SpUi Fmland
I -
BJ.15 averageI
Producer Price of Cow Milk- 1996
(standarcimd fat content of3.7%; in ECU per 100 kg)
France Nethedand. Luxemburg I.-land O..ece Portugal AutDa S11eden
O.nnany Italy Belgium UlitedKingdom Denmm Spain Finland
I -
BJ.15 averageI
Over the last 20 years, the average producer price for cow milk in the EC/EU increased from 11.61 ECU in 1973 (EC-9 average) to 30.82 ECU in 1996 (EU-15), representing an increase of around +4.5% on average per year. But a more detailed
l) The actual fat content of the milk delivered, and also increasingly its protein content, are the most important variables determining the milk price paid by dairies to farmers.
CHAPTER I MAIN ECONOMIC AND STRUCTURAL FEATURES
analysis shows clearly that the annual growth rate has declined over time.•> Beginning with mean annual growth rates of+9.4% and +5.7% respectively in the periods 1973-79 and 191973-79-84 (+7.7% on average between 1973 and 1984)1>, the rise in prices slowed down progressively. In the years following the introduction of the milk quota system (1984-90), nominal prices increased by 2.3% yearly, compared to only +0.7% in recent years (1990-96). In real terms, producer prices improved slightly from 1984 to 1989 and have dropped since, as was the case for other agricultural commodities. Only in the UK and Ireland have real producer prices for milk remained at more or less the same level over the last ten years.
rices for cow milk in nominal and real terms 1985-1996
EU Producer Price Indices -Cow milk
(in nominal and in real term~; 1990 = 100)
• i'lnorrilllllterma-EC12 + i'lnorrilllllterma-BJ15 + i'lrealterma-B::12 -Er i'lrealterma-BJ15
As to the evolution of milk producer prices at member state level over the last two decades, nominal prices have developed relatively more favourably in the southern member states (Greece, Italy, Portugal and Spain). This is mainly due to the fact that production in these countries lags behind consumption. Furthermore, relatively high inflation rates have been recorded in these member states over the same period. Among the "bigger" milk producers, the UK saw the most positive evolution in milk prices. This favorable development, in recent years in particular, contrasts with that of other countries - even in real terms. This can be seen, at least partially, as a consequence of the deregulation of the UK milk sector, which appeares to have benefited the UK dairy farmers.3>
I) See detailed tables in the annex of this report.
l) This rise was mainly due to the evolution of the target price of milk (and also the intervention prices for butter, SMP
and cheese), which increased steadily over the same period.
l) Graphs showing the trend in milk prices since 1973 per member state, compared with the evolution of the ECIEU
average, are presented in the annex. For clearer presentation, the graphs are split up in three groups of countries~ each one including
the ECIEU average for comparison purposes. The time series for the EC/EU average consists of averages for 9 (1973-1980),
EC-10 (1981-1985), EC-12 (1986-1994) and EU-15 (since 1995) and has been calculated as weighted average of national indices
CHAPTER I MAIN ECONOMIC AND STRUCTURAL FEATURES
1.13 Structural aspects ofEU milk production
Structure of dairy holdings
In 1993, around 1 million agricultural holdings in the EC-12 were involved in dairy farming, out of a total of 6.3 million agricultural holdings, including 1.9 million cattle holdings (dairy and beef combined). Most dairy farms are situated in Germany (which accounts for 23.3% of all EC dairy farms and 24.9% of the EC dairy cow herd), France (16.7% ofthe dairy holdings and 21.4% of the dairy cow herd), Spain (14.6% of all dairy farms, but only 6.4% of the dairy cows), Italy (holdings: 14.5%; dairy cows: 10.7%) and Portugal (with 9.8% of all EC dairy holdings but only 1.7% of the EC dairy herd). These five countries account for around 79% of total dairy holdings and around 65% of the dairy cow herd in the EC-12. Among the three new member states, Austria also has a significant number of (mainly small) dairy farms.
The distribution of dairy farms by size classes underlines the enormous structural differences between member states.•> For example, farms with less than 10 dairy cows account for 92.7% of all dairy holdings in Portugal, for 86.5% in Greece, for 69.6% in Spain and 60% in Italy. Also, in Germany, the number of small dairy farms is quite important (around 32% of all dairy farms). This percentage is much higher than in other EU member states, where their share ranges between 5.3% in Luxembourg and 20.4% in Ireland. A significant number of these small holdings, in particular in the north of the EU, are owned by part-time farmers.
If the relative importance of small dairy farms (holding fewer than 10 animals) is measured by their overall number of animals, then the picture changes somewhat. While in Greece and Portugal, a significant part of the national dairy herd is held on small farms (Portugal: 53.3% and Greece: 43.8%), the importance of small farms is relatively low in Spain (26.3%) and, in particular, in Italy (14.6% of the dairy herd against 60% of all dairy holdings) and Germany (only 6.6% of the dairy herd but 32% of all dairy farms). In the other countries, the share of the national dairy herd held on small dairy farms is very low, ranging from 0.5% in the UK to 3.4% in Ireland.
On the other hand, in the UK, the Netherlands and Denmark, milk production is much more concentrated on big farms. In the UK, around 23% of all dairy farms hold more than 100 dairy cows, while a further 34.6% of farms keep between 50 and 99 animals. Around 74% of the national dairy herd in the UK is kept on farms falling into these two size classes, compared to 59.8% in the Netherlands and 53.2% in Denmark. But, in all other member states, including the Netherlands and Denmark, the share of farms with more than 100 animals is relatively modest. Nevertheless, in some countries (Italy, Germany, the Netherlands and Denmark) a significant share of the national dairy herd is kept on this small number of holdings. In the case of the Netherlands and Denmark (and also Luxembourg), dairy farms are mainly concentrated in the size classes "50-99 animals" and "30-49" animals.
For the EC-12, the average number of dairy cows per farm amounted to 21 animals in 1993. However, wide variations exist of course between member states. The biggest farms can be found in the United Kingdom with on average 69 dairy cows per holding.
l) The figures are presented in a separate table in the annex of this report.
CHAPTER! MAIN ECONOMIC AND STRUCTIJRAL FEA11JRES
Dairy farms in the Netherlands (42 animals per holding) and Denmark (40 animals per holding) are also well above the EC average. They are followed by Luxembourg (3 3 dairy cows per farm), Belgium (28}, France and Ireland (both with 27}. The average number of animals in Germany (23 dairy cows per farm) is slightly above the mean for the EC-12. The smallest herds are situated in the southern EU countries: Italy (16 animals per holding}, Spain (9 animals per holding), Greece ( 6 animals per holding) and, finally, Portugal with only 4 dairy cows per farm on average.
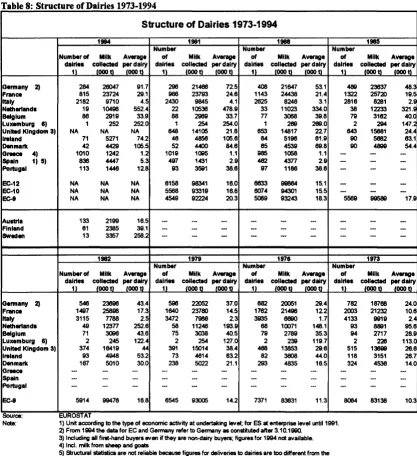
For decades, there has been a clear tendency in ~II member states towards bigger dairy farms. As the table below indicates, this was already evident in the years before the introduction of the milk quota system. If the mean annual rate of change is calculated over shorter periods, it would seem that the concentration process in dairy farms slowed down somewhat during the first years after the introduction of the milk quotas (1985-1987}, but strengthened again in recent years (1987-1993). In any case, even if the wide variations of farm size between member states narrowed somewhat over the whole period, 1> the differences are still enormous.
T bl 6 S a e : tructure o fD. H ld. BII"Y 0 angs 1973 1993
-Structure of Dairy Cow Holdings 1973-1993
1n3 1n1 1187 1185
Number of Average Number of Average Number of Average Number of Average
hold lng • anlm ala
(000) (000)
Size 3) holdlnga anlmala
(000) (000)
Size 3) holding• anima ..
(000) (000)
Size 3) holding• anlmala
(000) (000)
Size 3)
Germany 1) 236 5364 23 275 4769 17 337 5390 16 369 5561 15
France 169 4613 27 201 4969 25 291 5841 20 329 6506 20
~taly 147 2287 16 197 2536 13 310 3024 10 338 3075 9
Nether .. nda 43 1804 42 48 1909 40 58 2166 38 61 2412 39
Belgium 25 702 28 29 806 28 38 922 24 45 973 22
Luxemburg 2 51 33 2 52 31 2 64 32 2 70 31
United Kingdom 40 2786 69 42 2779 66 48 3052 63 53 3257 62
Ireland 47 1274 27 51 1293 26 69 1444 21 77 1528 20
Denmark 18 714 40 21 742 36 27 811 30 32 896 2S
Greece 39 219 6 47 214 5 61 232 4 73 219 3
Spain 148 1371 9 185 1516 8 251 1783 7
-
--Portugel 99 375 4 100 394 4 108 388 4
-
-
-EC-12 1013 21559 21 1198 21978 18 1600 25116 16 - -
-EC-10 766 19813 26 912 20068 22 1242 22945 18 1379 24518 1S
EC-1 726 19594 27 865 19854 23 1181 22713 19 1305 24299 19
~uatrla 116 898 8 -
-
- - - --
-
-Finland 2) 47 490 10 - -
-
-
--
-
--s-d•n 20 525 26 - - -
-
-
-
-1183 1171 1177 1173
Number of Average Number of Aven~ge Number of Aven~ge Number of Aven~ge
holding• animal• Size 3) hold lng a anlm ala Size 3) holding• anlmala Size 3) hold lnga animal• Size 3)
(000) (000) (000) (000) (000) (000) (000) (000)
Germany 1) 397 5529 14 456 5442 12 519 5417 10 630 5486 9
France 427 7195 17 518 7453 14 576 7510 13 697 7683 11
Italy 424 3068 7 483 3074 6 453 2945 6 607 3051 5
Nethar .. nda 64 2557 40 75 2369 32 83 2245 27 99 2255 23
Belgium 49 984 20 58 981 17 66 983 15 85 1000 12
Luxemburg 3 69 27 3 68 21 4 68 18 5 68 14
United Kingdom 58 3334 57 63 3348 53 72 3327 46 93 3544 3S
Ireland 86 1535 18 106 1503" 14 120 1484 12 144 1431 10
Denmark 35 1003 28 47 1071 23 56 1099 20 72 1086 15
Greece 77 237 3 - - -
-
-
- - --Spain - - -
-
-
--
-
-Portugal - - -· - -
-
--
-
-
-
-EC-12
-
-
-
--
- --
-
-
-
-EC-10 1621 25512 16 -
-
--
--
-
-
-EC-1 1544 25275 16 1810 25309 14 1950 25078 13 2432 25604 11
Source: EUROSTAT
Note: 1) From 19931he date for EC end Germany refer to Germany es constituted after 3.10.1990.
2) Figures based on the Agricultun~l Census 1990. 3) Average number of animals per holding.
1
CHAPTER I MAIN ECONOMIC AND STRUCTIJRAL FEATURES
Structure of dairies
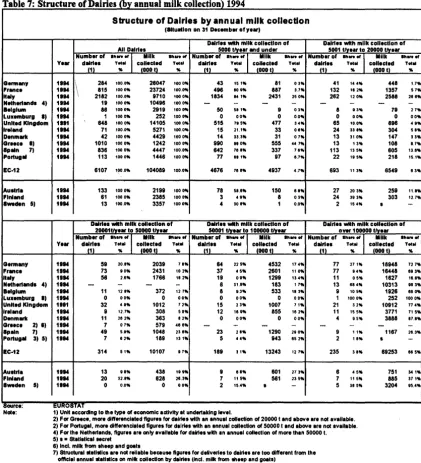
In 1994, around 6100 companies were active in the primary milk collection sector in the EC-12. Around one third, mostly dairies collecting not more than 5,000 t per year, were located in Italy. Greece, Spain, France and the UK also have many very small dairies, pushing up the total number of plants. But, in terms of milk collection, the importance of/ small dairies is very limited, except in Italy and Greece, where they account for 2S. 0% and 44.7% respectively of all milk collected. On the other hand, most of the biggest dairy companies, collecting more than I 00,000 t per year, can be found in Germany, France, the UK and the Netherlands. In all countries, except Spain, Italy and Greece, this group of dairies accounts for at least two thirds of total national milk collection, with the highest figures in the Netherlands (98.3%) and Denmark (87.8%). For the EC-12 on average, the corresponding figure is 66.5%. Among the three new member states, milk collection is highly concentrated in Sweden.
Table 7: Structure of Dairies (by annual milk collection) 1994
Structure of Dairies by annual milk collection (lltullllon on 31 December of year)
Dairies with milk collection of Dairies with milk collection of All Dairies 5000 tlyear and under 5001 tlyear to 20000 tiYear Number of ,,..,. et
J
Milk...
.,. ., Number of ,,..,. .,I
Milk...
.,
Number of... .,I
Milk...
., Year dalrlll Total collected Total dalrlll Total collected Total dalrlll Total collected Total111 "' (ODD tj ,. (1) ,. (000 t)
,.
(1) 'llo (ODD t),.
Germ1111y 1114
\
2a4 100.0 .. 28047 100 0 .. 43 15 1 .. a1 0 3 .. 41 14 4 .. 448 1.7 ..France 1114 815 100 0 .. 23724 100.0 .. 498 eo a .. aa7 3.7 .. 132 11 2 .. 1357 57 ..
Italy 1114 21a2 100.0 .. 9710 100 o .. 1834 841 .. 2431 25 o .. 282 12 0 .. 2588 21 8 ..
Nlllherlllllda 4) 1114 19 100 o .. 10498 100 O'llo
-
- - - - --
-Belgium 1114 ae 100 o .. 2919 100 0 .. 50 51 1 .. 9 03 .. a 83 .. 79 2 7 ..
Luxemburg I) 1114 1 100 o .. 252 100 o .. 0 00 .. 0 00 .. 0 oo .. 0 00 ..
United Kingdom 1111 \
84a 100 0 .. 14105 100 o .. 515 715 .. 477 34 .. 85 10.0 .. 898 41 ..
lrtllllld 1114 71 100.0 .. 5271 100.0 .. 15 21.1 .. 33 01,. 24 33 ... 304 58 ..
Denmark 1114 42 100 o .. 4429 100 0 .. 14 33.3 .. 31 0 7 .. 13 31 0 .. 147 33 .. Gr11ce I) 1114 1010 100 o .. 1242 100 0 .. 990 " 0 .. 555 44 7 .. 13 13'No 108 8.7 ..
Spain 7) 1114 a38 100 o .. 4447 100.0 .. 842 71 ... 337 7 8'No 113 13 5 .. 805 13.8'No
Portugal 1114 113 1000 .. 1448 100 o .. 77 181 .. 97 1.7'No 22 18 5 .. 21a 15.1 ..
EC-12 8107 1po.o .. 1040a9 100.0 .. 4878 78 8'No 4937 4.7'No 693 11 3 .. 8549
""'
Au atria 1114 133 100 O'llo 2199 100 0'"' 78 58.8'"' 150
"'"'
27 20 3 .. 259 11.8 ..Flnl1111d 1114 81 100 0'"' 2385 100 O'No 3 41'"' a 03 .. 24 31 3 .. 303 12.7'"'
Swedan 5) 1114 13 100.0'"' 3357 100 0'"' 4 30 ... 1 O.O'No 2 154 .. I -Dairies with milk collection of Dalrl11 with milk collection of Dairies with milk collection of
20001t/year to 50000 tlyear 50001 t/year to 1 00000 tlyear over 100000 tlyear Number of
... .,. ., I
Milk .,..,.., Number of ,.,.,. orI
Milk ... or Number of ... orI
Milk ,,..,.or Year dalrlll Total collected Total dalrlll Totll collected Total dairies Totll collected Total(1) 'llo (DOD t)
,.
(1) ,. (000 t),.
(1) ,. (000 t),.
Germany 1114 59 20 .... 2039 7 ... 84 22 5 .. 4532 174 .. 77 271 .. 1a94a 72 7 ..
fr1111ce 1114 73 10 .. 2431 10 2 .. 37 45 .. 2601 11 0'"' 77 04'"' 1844a 18""'
Italy 1114 58 2.1 .. 1768 112'No 19 OI'No 1299 134'No 11 05'No 1827 11.8 ..
Netherlands 4) 1114
-
--
- 8 31.8 .. 1a3 I 7 .. 13 884'"' 10313 88 3 ..Belgium 1114 11 12 ... 372 12 7 .. a 1.3 .. 533 18 3 .. 9 10 5'"' 1926 88 0'"'
Luxemburg I) 1114 0 00 .. 0 oo .. 0 00'"' 0 00'"' 1 100 O'No 252 100 o ..
United Kingdom 1111 32 4.8 .. 1012 7 2 .. 15 23'No 1007 71 .. 21 3 2 .. 10912 77 4 ..
lrtllllld 1114 9 12.7'"' 30a sa .. 12 18 8 .. a55 18 2 .. 11 15 5 .. 3771 71 5'"'
Denmark 1114 11 28 2 .. 363 • 2 .. 0 OO'No 0 OO'No 4 9 5'No 3aa8 87.8'"'
Gr11ce 2) 8) 1914 7 0 7'No 579 48 8'"' - - -
-Spain 7) 1914 49 U'No 104a 23 8 .. 23 28'No 1290 21 O'No 9 II'No 1187 26.3 ..
Portugal 3) 5) 1914 7 82'"' 1a9 131 .. 5 44'"' 943 85 2 .. 2
""' I -IC-12 314 51 .. 10107 81 .. 189
"'"'
13243 12 7'No 235 38 .. 89253 88 5'"'Au atria 1114 13
""'
43a 111'"' 9"'"'
801 27 3'No 6 45 .. 751 341 ..flnl1111d 1114 20 32.S.. 82a 28.3'No 7 11 5 .. 581 23 5 .. 7 11 5 .. 885 37 1 ..
Sweden 5) 1114 0 O.O'No 0 OO'No 2 15.4'No I - 5 315'No 3204 15.4 ..
Source: J:UfC05TAT
Nate: 1) Unit eccordlng to the type of economic ectlvlty et underteklng level.
2) For Gr11ce, more dltrerencleted figures for delries with en ennuel collection of 20000 lend ebove ere nat aveilable. 2) For Portugal, more dltrerenclated figures for dairies with en annual collection of 50000 t and above ere nat available. 4) For the Netherlands, figures ere only aveilable for dairies with an ennuel collection of more then 50000 I. 5) 1 • Statistical Hcret
8) Incl. milk from sheep and goets
7) Structural llatllllca ere nat reliable becauH figures for deliveries to dairies are too different from the of'llclal annuellletllllcs on milk collection by dairies (Incl. milk from sheep and goets)
8) Luxemburg Is nat covered by the offlclel delry structure survey.
[image:30.573.67.488.313.776.2]