eurostat
SPEL system
Overview of the SPEL system (Rev. 1)
STATISTISCHES AMT DER EUROPÄISCHEN GEMEINSCHAFTEN STATISTICAL OFFICE OF THE EUROPEAN COMMUNITIES OFFICE STATISTIQUE DES COMMUNAUTÉS EUROPÉENNES
L-2920 Luxembourg - Tél. 43 01-1 - Télex COMEUR LU 3423 B-1049 Bruxelles, rue de la Loi 200 - Tel. 299 11 11
Eurostat hat die Aufgabe, den Informa-tionsbedarf der Kommission und aller am Aufbau des Binnenmarktes Beteilig-ten mit Hilfe des europäischen statisti-schen Systems zu decken.
Um der Öffentlichkeit die große Menge an verfügbaren Daten zugänglich zu machen und Benutzern die Orientierung zu erleichtern, werden zwei Arten von Publikationen angeboten: Statistische Dokumente und Veröffentlichungen. Statistische Dokumente sind für den Fachmann konzipiert und enthalten das ausführliche Datenmaterial: Bezugsda-ten, bei denen die Konzepte allgemein-bekannt, standardisiert und wissen-schaftlich fundiert sind. Diese Daten werden in einer sehr tiefen Gliederung dargeboten. Die Statistischen Doku-mente wenden sich an Fachleute, die in der Lage sind, selbständig die benötig-ten Dabenötig-ten aus der Fülle des dargebote-nen Materials auszuwählen. Diese Daten sind in gedruckter Form und/oder auf Diskette, Magnetband, CD-ROM verfüg-bar. Statistische Dokumente unterschei-den sich auch optisch von anderen Ver-öffentlichungen durch den mit einer stili-sierten Graphik versehenen weißen Einband.
Die zweite Publikationsart, die Veröffent-lichungen, wenden sich an eine ganz bestimmte Zielgruppe, wie zum Beispiel an den Bildungsbereich oder an Ent-scheidungsträger in Politik und Verwal-tung. Sie enthalten ausgewählte und auf die Bedürfnisse einer Zielgruppe abge-stellte und kommentierte Informationen. Eurostat übernimmt hier also eine Art Beraterrolle.
Für einen breiteren Benutzerkreis gibt Eurostat Jahrbücher und periodische Veröffentlichungen heraus. Diese enthal-ten statistische Ergebnisse für eine erste Analyse sowie Hinweise auf weiteres Datenmaterial für vertiefende Untersu-chungen. Diese Veröffentlichungen werden in gedruckter Form und in Datenbanken angeboten, die in Menü-technik zugänglich sind.
Um Benutzern die Datensuche zu erleichtern, hat Eurostat Themenkreise, d. h. eine Untergliederung nach Sachge-bieten, eingeführt. Daneben sind sowohl die Statistischen Dokumente als auch die Veröffentlichungen in bestimmte Reihen, wie zum Beispiel „Jahrbücher", „Konjunktur", „Methoden", unterglie-dert, um den Zugriff auf die statistischen Informationen zu erleichtern.
Y. Franchet Generaldirektor
It ¡s Eurostat's responsibility to use the European statistical system to meet the requirements of the Commission and all parties involved in the development of the single market.
To ensure that the vast quantity of accessible data is made widely avail-able, and to help each user make proper use of this information, Eurostat has set up two main categories of document: statistical documents and publications. The statistical document is aimed at specialists and provides the most com-plete sets of data: reference data where the methodology is well established, standardized, uniform and scientific. These data are presented in great detail. The statistical document is intended for experts who are capable of using their own means to seek out what they require. The information is provided on paper and/or on diskette, magnetic tape, CD-ROM. The white cover sheet bears a stylized motif which distinguishes the statistical document from other publica-tions.
The publications proper tend to be com-piled for a well-defined and targeted public, such as educational circles or political and administrative decision-makers. The information in these docu-ments is selected, sorted and annotated to suit the target public. In this instance, therefore, Eurostat works in an advisory capacity.
Where the readership is wider and less well defined, Eurostat provides the infor-mation required for an initial analysis, such as yearbooks and periodicals which contain data permitting more in-depth studies. These publications are available on paper or in Videotext databases.
To help the user focus his research, Eurostat has created 'themes' i.e. a sub-ject classification. The statistical docu-ments and publications are listed by series, e.g. yearbooks, short-term trends or methodology, in order to facilitate access to the statistical data.
Y. Franchet Director-General
Pour établir, évaluer ou apprécier les différentes politiques communautaires, la Commission des Communautés euro-péennes a besoin d'informations. Eurostat a pour mission, à travers le système statistique européen, de répon-dre aux besoins de la Commission et de l'ensemble des personnes impliquées dans le développement du marché unique.
Pour mettre à la disposition de tous l'importante quantité de données acces-sibles et faire en sorte que chacun puisse s'orienter correctement dans cet ensemble, deux grandes catégories de documents ont été créées: les docu-ments statistiques et les publications. Le document statistique s'adresse aux spécialistes. Il fournit les données les plus complètes: données de référence où la méthodologie est bien connue, standardisée, normalisée et scientifique. Ces données sont présentées à un niveau très détaillé. Le document statis-tique est destiné aux experts capables de rechercher, par leurs propres moyens, les données requises. Les informations sont alors disponibles sur papier et/ou sur disquette, bande magnétique, CD-ROM. La couverture blanche ornée d'un graphisme stylisé démarque le document statistique des autres publications.
Les publications proprement dites peu-vent, elles, être réalisées pour un public bien déterminé, ciblé, par exemple l'en-seignement ou les décideurs politiques ou administratifs. Des informations sélectionnées, triées et commentées en fonction de ce public lui sont apportées. Eurostat joue, dès lors, le rôle de conseiller.
Dans le cas d'un public plus large, moins défini, Eurostat procure des éléments nécessaires à une première analyse, les annuaires et les périodiques, dans les-quels figurent les renseignements adé-quats pour approfondir l'étude. Ces publications sont présentées sur papier ou dans des banques de données de type vidéotex.
Pour aider l'utilisateur à s'orienter dans ses recherches, Eurostat a créé les thèmes, c'est-à-dire une classification par sujet. Les documents statistiques et les publications sont répertoriés par série — par exemple, annuaire, conjonc-ture, méthodologie — afin de faciliter l'accès aux informations statistiques.
Overview of the SPEL system (Rev. 1)
W. Henrichsmeyer
G. Weber
W. Wolf
October 1995
Theme Agriculture, forestry and fisheries Series Methods
ISBN 92-827-5970-9
© ECSC-EC-EAEC, Brussels · Luxembourg, 1996
Reproduction is authorized, except for commercial purposes, provided the source is acknowledged Printed in Spain
TABLE OF CONTENTS iii
LIST OF FIGURES iv
1. BACKGROUND 1
2. AIMS AND BASIC CONCEPT 2
3. CHARACTERISTICS OF THE SPEL APPROACH 3
4. CONCEPT OF THE ACTIVITY-BASED TABLE OF ACCOUNTS AND MATRIX OF
ACTIVITY COEFFICIENTS 4
4.1. Identity System of the Activity-Based Table of Accounts 4
4.2. ABTA Components 6
4.3. Derivation of the Matrix of Activity Coefficients 7
5. THE SPEL/EU SYSTEM 8
5.1. Base System (SPEL/EU-BS) 8 5.1.1. Design and Structure 9 5.1.2. Data Categories and Preparation 10
5.1.3. Status and Application 11 5.2. Short-term Forecast and Simulation System (SPEL/EU-SFSS) 12
5.2.1. Aims and Concept 12 5.2.2. Data Availability and Forecast Periods 13
5.2.3. SFSS Structure and Methodology 15
5.2.3.1. Basic Approach 15 5.2.3.2. Forecasting of Individual Exogenous Variables 15
5.2.3.3. Incorporation of Experts' Judgment 16 5.2.3.4. Integration of Forecasts for Individual Variables within the ABTA Accounting
Framework 16 5.2.4. SFSS Status and Outlook 16
5.3. Medium-term Forecast and Simulation System (SPEL/EU-MFSS) 17
5.3.1. Aims and Requirements 17 5.3.2. MFSS Methodological Design 17 5.3.2.1. The Supply Component 17 5.3.2.2. The Complete SPEL/EU-MFSS 18
5.3.3. Applications for the SPEL/EU-MFSS 19
6. OUTLOOK FOR FURTHER DEVELOPMENTS 20
7. BIBLIOGRAPHY 22
8. EUROSTAT PUBLICATIONS ON THE SPEL SYSTEM 23
ANNEX 25
Figure 1: Alternative Approaches to Model Based Policy Consultation 2
Figure 2: Identity System of the Activity-Based Table ofAccounts 5
Figure 3: Schematic Representation of the Activity-Based Table of Accounts 6
Figure 4: Identity System of the Matrix of Activity Coefficients 7
Figure 5: Modules of the SPEL/EU System 9 Figure 6: Availability of Statistical Data for Updating SPEL/EU Data and the
SPEL/EU-SFSS 14 Figure 7: Design of the Complete SPEL System 19
1. BACKGROUND
The starting signal for the development of the SPEL System was the request by the European Commission (the Directorate-General for Agriculture) for up-to-date information on the current situation and short-term development of agricultural income in the European Union (EU) Member States and EU as a whole. To meet this demand, the Statistical Office of the European Communities (Eurostat) took the decision for the development of an appropriate agricultural model. One of the main targets set by Eurostat was for the model to be so user-friendly that after its development, testing and implementation in Eurostat, it could be constantly updated and used for forecasts and policy-related analyses.
After a short review and check of the agricultural statistics it became immediately clear that intensive work on the database was necessary to ensure sufficient comparability between the EU Member States and consistency between the different domains of statistics.
Therefore, the first few years' work had to be invested in the design of a concept for an integrated information and model system and its peacemeal realization. This work started in 1980 and was carried out by a research group at Bonn University in close collaboration with Eurostat under the project title "Sectoral Production and Income Model for Agriculture" (which in German yields the acronym SPEL).
This work on the database resulted in the Base System (SPEL/EU-BS), which combines different sources of data, contains an agriculturally differentiated and consistent ex-post depiction of the structure, intensity and use of agricultural output and income generation in the agricultural sectors of the EU Member States, and is consistent, in its totals, with the Economic Accounts for Agriculture (EAA).
In the past and during the current work on extending the system to cover new Member States, the design of the SPEL System has proved its worth, the Base System being a useful tool for drawing on the cooperation of the statisticians and experts from the countries involved, especially in the ex-post depiction.
At present the SPEL/EU System comprises the agricultural sectors of the 12 EU Member States1 and the
EU as a whole. Time series for the model system have been established back to the year 1973 and are available to interested parties under the designation SPEL/EU Data. Continous updates of these data are performed by Eurostat.
The SPEL/EU Data serve as a basis for the Short-term Forecast and Simulation System
(SPEL/EU-SFSS), the development of which was started in 1984. In accordance with Eurostat's terms of reference, it
was designed for diagnosing the current income situation, forecasting short-term developments and simulating the short-term impacts of agricultural price and income policies. Over the years, the SPEL/EU System has been extended to include a component for depicting consumption of agricultural products outside the agricultural sector. The SFSS was installed at Eurostat, Luxembourg and has several applications per year.
The successful implementation of the short-term model led to requests for a tool for medium-term forecasts and simulations of the effects of agricultural policy decisions. A highly simplified initial version of a
Medium-term Forecast and Simulation System (SPEL/EU-MFSS/1) was created in a crash programme for the
European Commission's "Green Paper" in 1985 (COMMISSION OF THE EUROPEAN COMMUNITIES 1985). This was expanded in subsequent years to produce an improved second version, the SPEL/EU-MFSS/2, and finally the current version of the SPEL/EU-MFSS.
At the same time as the modelling system has been extended, it has become necessary to extend and modify the basic structure of the SPELSystem. With the accession of the new southern Member States, the set of "Mediterranean" production activities had to be further broken down and supplemented. There was also a need to elaborate the feed module and improve the procedures for allocating input to the different production activities. All these extensions and improvements are contained in the present version of the SPEL/EU System, which thus represents a comprehensive policy information system.
After completion and testing, all models of the SPEL System have been implemented at Eurostat in Luxembourg where a special SPELgroup has been established, responsible for the maintenance, updating and application of the SPEL/EU System.
2. AIMS AND BASIC CONCEPT
As mentioned in the introduction, the main aims of the SPEL System can be summarized as follows:
checking of the consistency of Eurostat's agricultural statistics,
monitoring and diagnosis of the current situation in the agricultural sectors of the EU Member States,
expost analyses of sectoral developments,
short and mediumterm forecasts and policy simulations of the effects of agricultural policy decisions.
The methodological concept of the SPEL/EU System is based on experience from different types of agricultural sector modelling, but while most modelling work involves methodological experimentation and academic exercises, SPEL is different, the mandate being to establish a modelling system for the European Commision to be implemented by Eurostat in Luxembourg.
Figure 1:
Alternative Approaches to Model Based Policy Consultation
Traditional approach
SPEL approach
Data
Data
ι E
■ν
data transfer
4
cooperation data work
îase System
Model
Model
■v,
report
mutual policy dialogue
Policy Infor Foreca Policy
Policy maker
Policy maker
mation System ι
sts ,
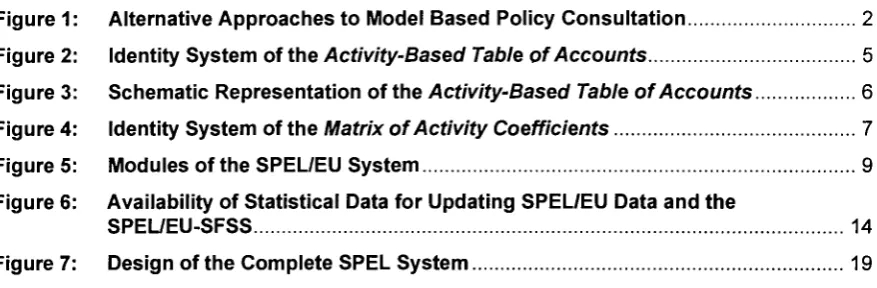
[image:8.595.80.559.438.732.2]These requirements have largely influenced the basic concept and structure of the SPEL System; it is designed as a tool for policy-oriented analyses, forecasts and simulations, which can be used in dialogues with policy-makers and administrators.
The long-standing co-operation between Eurostat and policy-makers has led to a modelling approach which is different in principle from the traditional one: in the traditional (academic) approach the data are taken as a given set of numerical information. Econometric techniques are applied to estimate the model's parameters and to produce forecasts and impact analyses for policy measures. Usually, a selected number of parameter estimates and model results are published and/or presented to policy-makers (Figurei).
The SPEL approach, on the other hand, is characterized by mutual interaction between model-builders
and statisticians or policy-makers. The volume and quality of statistical data are not taken as final (from the outset) but subjected to consistency checks and critical studies which frequently highlight shortcomings. These may lead to jointly agreed revisions of existing statistics, and proposals for amendments and conceptual changes to statistics. Furthermore, the formulation of policy scenarios and interpretation of results are not done in a single process but in the course of a multi-stage reciprocal trade-off.
3. CHARACTERISTICS OF THE SPEL APPROACH
This basic approach constitutes the main orientation for the design of the SPEL System. Some general features can be mentioned regarding its methodology and technical structure:
- Modular approach:
The system as a whole is designed so that the individual components (sub-systems) can be developed, tested, continuously updated and implemented on a shared cooperation basis. The system's recursive structuring ensures that the individual sub-systems can be flexibly interlinked to deal with the specific problem concerned.
- Intelligibility and transparency:
The modular approach makes it easier to understand how the system components interact, even for the non-specialist. Furthermore, the system is designed in such a way that the resultant variables (together with each intermediate step) can be traced back to the original data sources and the underlying hypotheses and assumptions. This means that users of the model and those involved in policy discussions are able to understand how the results were arrived at.
Another feature common to all sub-models is the activity-based accounting approach:
- The activity-based approach:
This allows the agricultural sector and its interfaces with the other parts of the economy to be depicted in a differentiated manner. The breakdown into agricultural production activities2 allows yields, expenditure
and cultivated areas, etc. to be depicted separately. Specific technological features of agricultural production and interdependence between the different activities can be taken into account in forecasts and simulations. The advantages of this approach become apparent in ex-post depictions (especially when new Member States are to be included), when taking account of experts' knowhow in forecasts and simulations and including complex agricultural policy instruments (premium payments, set-aside measures, etc.) in the system.
- The accounting-based approach:
Strict compliance with the accounting-based approach guarantees consistency in respect of both physical and monetary flows, as well as comparability of results on the basis of the definitions used in the Economic Accounts for Agriculture (EAA) (e.g. net value added at factor cost as the central income indicator).
In order to accommodate these features, the SPEL System has quite simple, recursive structures within and between its different components (sub-systems).
4. CONCEPT OF THE
ACTIVITY-BASED TABLE OF
ACCOUNTS
AND
MATRIX OF ACTIVITY COEFFICIENTS
The different system parts or models of the SPEL/EU System provide individual results within a common consistent, activity-based accounting framework.
This accounting framework is based on the principles of the system of national accounts and Economic Accounts for Agriculture (EAA), thus ensuring consistency for physical and monetary flows and comparability on the basis of EAA definitions.
The activity-based approach is the most important feature of the SPEL/EU System since it allows characteristic features of the agricultural production process (yields, cultivated areas, etc.) and the interplay between the different production activities to be taken into account. In addition, the intrasectoral flows between production activities can be included (gross flows), whereas in the EAA only intersectoral flows (net flows) are covered. However, after the aggregation of all production activities in the agricultural sector, the sum of the consolidated gross flows is equal to the sum of the net flows, i.e. the resultant gross value added is equivalent to that of the EAA.
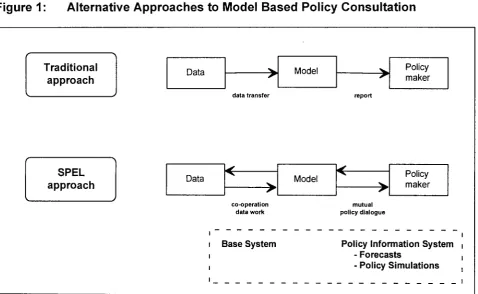
4.1. Identity System of the Activity-Based Table of Accounts
The "Activity-Based Table of Accounts" (ABTA) -stems from a merging of the activity-based approach
with the accounting framework, in other words, from the differentiation of production activities within the accounting framework. This is depicted in Figure2.
At first glance the general presentation of the ABTA looks rather complicated because output, inputs and activities have to be considered simultaneously. If each production activity produced just one output, the model structure (and its notation) would be much simpler. The ABTA could then be presented with the same structure as a conventional input-output table.
The ABTA presented in Figure2 has to be read as follows:
- the columns of the table present the output generation and input use of production activities, as well as different types of "use activities";
- the rows present output balances or input balances.
Figure 2: Identity System of the Activity-Based Table of Accounts
Production activities
Use activities
Output balances
Input balances
with:
Σ^4
\ k j )
+
+
YL
YUi,hQ
uh
k h
— —
0
0
Jpu*J
PG, =
* =
J
Σ
χ
%
i
T
YGk,
hQ
Gk,
hi
where: XG : XU :
YG :
YU :
PG :
PU : ßG :
QU : / :
J ■
k :
A :
Output Generation, ABTA, physical component, Output Use, ABTA, physical component, Input Generation, ABTA, physical component, Input Use, ABTA, physical component,
Unit value producer prices for Output Generation, Producer prices for Output Use,
Purchase prices for Input Generation, Unit value purchase prices for Input Use,
Subscript, production activity, ABTA, (/ = (l,...,nfj,
Subscript, products, ABTA, (j = ( l , . . . , w ) l ,
Subscript, use activity, ABTA, [k = ( « + l , . . . , i V ) i ,
Subscript, input items, ABTA, [h = (m + l,..., M)).
= 0
0
Interpretation of different aspects of the ABTA
The different aspects of the ABTA can be interpreted as follows.
• In the upper section the rows of the ABTA show the output generation of the different production
activities and its use for the different purposes: intrasectoral uses (seed, animal feed, calves etc.,
changes in stocks on farms, human consumption on farms), and intersectoral uses (sales). Intersectoral
[image:11.595.47.541.83.644.2]values of outputs has to be equal to the sum of the values of uses for each individual product and all products as a whole. Accordingly, the rows in the lower section of the ABTA present the generation of inputs (within the agricultural sector and purchases from other sectors) and their uses in agricultural production processes3.
The columns of the ABTA show the gross production value, the value of intermediate inputs and, as a residual, the gross value added at market prices for different production activities and, after aggregation, for the agricultural sector as a whole.
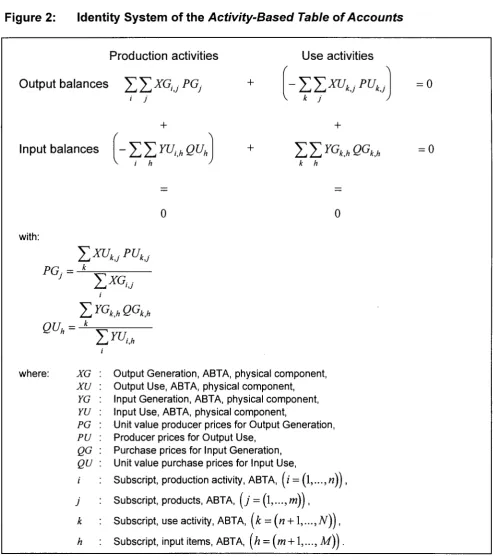
4.2. ABTA Components
Since most agricultural products and some inputs are fairly homogeneous they can be measured in physical units (tons). Therefore, it makes sense also to establish the output and input balances of the ABTA in physical terms. The content of these balances is similar to that of the "Supply Balance Sheets" (as published by Eurostat).
[image:12.595.73.548.370.639.2]If both the physical and valued components of the ABTA are established, it is possible to derive a set of average producer and purchase prices (unit values) by dividing the value variables by the corresponding physical quantity variables. A schematic representation of the correlation between these physical and valued components is given in Figure3.
Figure 3: Schematic Representation of the
Activity-Based Table of Accounts
PHYSICAL component
PRICE
component
VALUE component
Output Generation
Input Use
Output Use
Input Generation
Producer Prices
Purchase Prices
Output Generation
Input Use
Output Use
Input Generation
The possibility of using physical input and output balances and correlations is of crucial importance for empirical specification by means of the Base Model and the Forecast and Simulation Systems. For specifying the ABTA it is particularly important that various types of statistical data, technical information and experts' judgment can be incorporated, and that plausibility and consistency checks can be carried out.
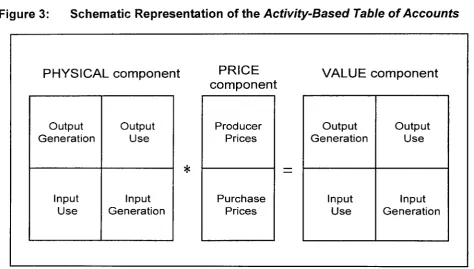
4.3. Derivation of the
Matrix of Activity Coefficients
If the output generation or input use are placed in relation to the scope of production activities, a matrix of output and input coefficients can be derived from the ABTA identity system (Figure3). This "Matrix of
[image:13.595.48.552.175.706.2]Activity Coefficients" (MAC) can be based on physical or valued ABTA components.
Figure 4: Identity System of the Matrix of Activity Coefficients
Output coefficients
Input coefficients
Production activities
ΣΣ-^-PG.
' J
f LEVEL,
with:
where: XG
XU YG YU PG PU QG
QU
J
k
h
-ΣΣ
ν / h
YU
UhLEVEL·
QU
h0
Y^XU^PU^
PGj = - *
QUh =
i
YjG
kMQG
Khk
T
YUuh
Output Generation, ABTA, physical component, Output Use, ABTA, physical component, Input Generation, ABTA, physical component, Input Use, ABTA, physical component,
Unit value producer prices for Output Generation, Producer prices for Output Use,
Purchase prices for Input Generation, Unit value purchase prices for Input Use,
Subscript, production activity, ABTA, (i = (l,...,nj\
Subscript, products, ABTA, (j - (l,...,rrm ,
Subscript, use activity, ABTA, (k = (n + \,...,N)),
Subscript, input items, ABTA, [h-{m + \,...,Mj\.
The MAC output generation sector contains the output activity coefficients broken down by products for each output activity unit. The MAC input use sector contains the input activity coefficients per input item of each production activity unit.
With the definitions given in Figure4, the output and input quantities of the ABTA can be traced back to the output and input coefficients and to the levels of production activities:
Output: XG¡j = XMGU LEVEL¡
Input: YUi h = YMU¡ n LEVEL¡
where: XG XMG LEVEL YU YMU i h
Output Generation, ABTA, physical component, Output Generation, MAC, physical component, Production activity level,
Input Use, ABTA, physical component, Input Use, MAC, physical component,
Subscript, production activity, ABTA (i=(1, ..., n)), Subscript, input items, ABTA, (h=(m+1, ..., M)).
This makes it possible, for example, to explain the development of crop production by both yield and acreage development, which is especially important for forecasts and simulations of the effects of agricultural policy decisions.
Within the ABTA and MAC, there are currently 49 agricultural production activities, 58 products and 32 input items, all of which are listed in an annex to this documentation.
5. THE SPEL/EU SYSTEM
In its modular design, the SPEL/EU System consists of the following interrelated parts: - the Base System (BS),
- the Short-term Forecast and Simulation System (SFSS), and - the Medium-term Forecast and Simulation System (MFSS).
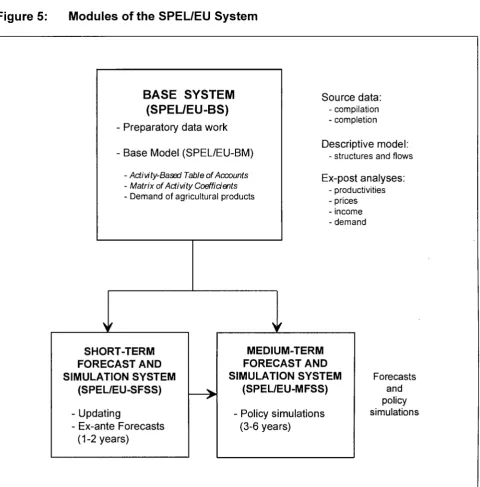
In the following sections these system parts are discussed briefly (Figure 5). For further information on their technical implementation, referto ZINTL, GREUEL (1995a).
5.1. Base System (SPEL/EU-BS)
Figure 5: Modules of the SPEL/EU System
BASE SYSTEM
(SPEL/EU-BS)
- Preparatory data work
- Base Model (SPEL/EU-BM)
- Activity-Based Table of Accounts - Matrix of Activity Coefficients - Demand of agricultural products
> f
SHORT-TERM FORECAST AND SIMULATION SYSTEM
(SPEL/EU-SFSS)
- Updating
- Ex-ante Forecasts (1-2 years)
- ^
V
Source data:
- compilation - completion
Descriptive model:
- structures and flows
Ex-post analyses:
- productivities - prices - income - demand
MEDIUM-TERM FORECAST AND SIMULATION SYSTEM
(SPEL/EU-MFSS)
- Policy simulations (3-6 years)
Forecasts and policy simulations
5.1.1. Design and Structure
The Base System comprises the Data Preparation and Base Model system parts:
• The common shortcomings of statistical material make systematic data preparation work necessary before statistical data can be used in the Base Model.
• The Base Model (BM) combines the different types of information (official statistics, farm sample data, calculation data etc.) in order to depict the production structure and physical and monetary flows within the agricultural sector as well as demand for agricultural products outside the agricultural sector (comparable to the traditional input-output model).
Data from official statistics cannot normally be used by the Base Model (BM) without being checked or preprocessed to ensure consistency. Input and output coefficients, production activity levels and input and output prices, supply balance sheets and accounting data have to be derived gradually in an iterative process, making use of various categories of data and applying consistency and plausibility checking procedures. Such work requires much imagination and care, and is very time-consuming.
In order to keep procedures within the Base System systematic and intelligible, the information used (mainly statistical material) is prepared in groups.
5.1.2. Data Categories and Preparation
A precondition for any modelling work is adequate preparation of the database. Because of the well-known deficiencies of statistical material, original statistics need to undergo intensive preliminary treatment. This is especially true for the SPEL/EU-BM, for which a broad range of statistical material from the Member States has to be given a consistent format, and for which continuous time series need to be established for all variables from 1973 onwards. Therefore it has to be stressed once more that data preparation (including completion of time series) for the Base System (SPEL/EU-BS) was (and still is) an important and time-consuming task.
Data categories
The Base Model cannot be specified directly on the basis of official statistical data. Instead, various sources of data have to be used. The following categories are applied according to the origin of data and their treatment in the numerical specification procedure:
• Original statistical data (OD)
These data are regarded as "core data" for the purposes of data processing and consistency computations. They are taken from official agricultural statistics (mainly Eurostat). When the SPEL/EU data are being established, these data form the pattern to be followed by other data.
• Semi-original statistical data (SD)
These data are based on original statistics, but are adjusted to ensure consistency and completeness within basic SPEL/EU data (e.g. inputs in the SPEL/EU System).
• Calculation data (CD)
This category comprises technical and management data - a collection of coefficients and parameters which are used primarily to break down aggregated statistical values (mostly OD) into their components. This category is mainly used for production or product-based ratios.
For example, in the SPEL/EU data base the fertilizer input for the whole sector is allocated to the different crop input activities according to their nutritional requirements. The output-based feed requirements per animal are calculated on the basis of feed requirement function parameters.
• Residual data (RD)
Residual data can be obtained by resolving a system of defining identities containing all the other established elements. They can then be compared with comparable independent figures, where available, and plausibility checks carried out (e.g. unit values are compared with market prices, or gross value added at market prices per activity unit with gross value added derived from farm accountancy data).
Data preparation
Problems of data extraction, compilation and completion are treated in detail in the SPEL/EU System supplements, the "Methodological Documentation" (cf. WOLF 1995, Parts 1 and 2) and in particular the "Technical Documentation" (ZINTL, GREUEL 1995b). It can generally be said that about 1 500 items of data
are needed for a Member State's agricultural sector in one year. Therefore a SPEL/EU data updating operation involves the use of about 400 000 items of data for EUR 12 for the 22 year period.
In the following section, only a few areas of data preparation work will be mentioned to indicate the type of problems to be solved:
- Input errors:
Systematic checks are necessary, even for official statistics. Formal computerized checking procedures have been developed to support plausibility assessment.
- Incomplete time-series:
This is a problem to which special attention has to be given at all work stages, from system development to routine updating and use. It includes the procedures to be applied for missing data and changes in definitions. Formal computerized checking and completion procedures have been developed for this case too, mainly based on regression analysis.
- Lack of data:
In some areas the required statistical data are not available at all. It is then necessary to close the data gaps by appropriate ways and means (use of correlations with closely related available data, calculations and technical data, farm accountancy data etc.) depending on the problem. At all events, these procedures are well documented and copies can be obtained by the user.
In spite of the many processing stages mentioned, it has to be stated that the accuracy of the SPEL/EU data (resulting from the Base Model) depends on the quality of the original statistics from which about 80 % of the data are derived.
All information processing is carried out by Eurostat. Apart from available documents, the user can obtain all necessary information on the origin and treatment of the individual time series from Eurostat.
If inaccuracies or inconsistencies are detected in statistics at the data preparation stage or by users of the SPEL/EU data, the information is passed on to the relevant statistical authorities by Eurostat.
5.1.3. Status and Application
The results of the Base System (SPEL/EU data) are available for all the Member States (EUR 12) and for EUR 12 as a whole from 1973. The five new Lander of the Federal Republic of Germany are included from 1990 so that the time series for Germany and hence for EUR 12, too, are interrupted from 1989 to 1990.
The Base System's accuracy of depiction has been further improved as a result of the expansions carried out in the past few years in the sectors of production structure, demand for farm products and use of inputs.The system's current applications and further ex-post analyses promise improvements in quality for the future, too.
At the moment, work is progressing on the incorporation of the three new Member States (Austria, Finland and Sweden) in the SPEL/EU data. The question of the length of the ex-post depiction has so far not been decided. It does not appear feasible or desirable to include them in the SPEL/EU data from 1973. An initial version of the EUR 15 data will probably be available for testing by the end of 1995.
Several times a year, the SPEL/EU data are updated to incorporate any new statistical information which has become available. Experience from previous years has shown that most of the (preliminary) statistical material for the past one or two years is subsequently revised by the statistical offices in the Member States. Individual time series, however, are sometimes revised retrospectively for the entire ex-post period, are no longer collected or new statistics become available. The Base System, and especially the Base Model, then need to be adapted accordingly.
Consequently, the data for the entire ex-post period are always included in the updating carried out at least twice a year (in spring and autumn). In the spring, the main item is the new available data for the animal sector. In the autumn, the new and often revised data from the Economic Accounts for Agriculture (EAA) and the crop production data are the main figures to be inserted.
All SPEL/EU data updating work is carried out by Eurostat.
Apart from these updating procedures for the Base System, the SPEL/EU-SFSS is used to update the SPEL/EU data up to the current year on the basis of preliminary statistics and trend forecasts. This type of "updating" or "monitoring" is dealt with in the next chapter.
5.2. Short-term Forecast and Simulation System (SPEL/EU-SFSS)
The aims of the SFSS are
- to "update" the system on the basis of currently available information (to bridge the statistical time-lag), and
- to produce forecasts and simulations of the effects of agricultural policy decisions up to one, or a maximum of two years ahead.
The central hypothesis of the short-term model is that the major decisions on the initiation of the production process and the allocation of production factors have already been made. The production process can then be viewed as having already started so that most output and input variables can be forecast exogenously. Only those (limited) substitutions between products and factors which are feasible within a short time (e.g. substitutions between different feed categories) are explained endogenously by model mechanisms.
The short-term forecasts and simulations are based on:
- econometric trend analyses of all the input and output coefficients, production activity levels and input and output prices of the SPEL/EU database;
- forecasts of exogenous trends by specialists (e.g. Eurostat officials working in the widest-ranging areas of statistics, and officials from the market divisions of the European Commission's Directorate-General VI);
- information on policy-determined variables and parameters,
- consistency calculations using the accounting framework of the SPEL/EU System.
The advantages of the activity-based SPEL approach are:
- that the specific knowledge of experts from different fields of experience (changes in yields, input use, prices etc.) can be included and
- that it covers criteria for specific policy tool variables (including production area, number of livestock, etc.).
The main limitations of the short-term model stem from the fact that only the immediate effects on agricultural production and income are considered, but it does not take into account any allocational responses in the primary factors of labour and capital and the repercussions on investment and labour mobility which determine longer-term developments.
5.2.1. Aims and Concept
The SPEL/EU-SFSS has been designed for the following tasks:
- updating the statistical presentation and diagnosis of the current agricultural production and income situation in the EU Member States (monitoring);
- short-term forecasts of production, price, income and demand developments, and
- simulation of the short-term effects, on production and income, of changes in the CAP, especially the annual price proposals of the Council of Ministers of the European Union.
The main idea is to make use of all types of relevant information, especially
- trend analyses for variables determining developments in production, income and demand,
- information from "early indicators", (e.g. the initiation of the production process, i.e. sown acreage or livestock numbers in stalls; meteorological factors, harvest estimates, etc.);
- expert knowledge of specialists in specific fields (e.g. experts of the European Commission or Member States).
The ABTA and MAC4 of the SPEL/EU System serve to combine all this information and adapt it for
short-term forecasts. The specific advantage of the SPEL System for this application is that it can be broken down to a level (e.g. yield or price trends for specific crop products) at which experts can apply their specific knowledge, or the results of early indicators can be taken into account.
Before further details on the model structure and modelling procedure are presented, the timing of data availability and the identification of suitable forecast periods should be examined.
5.2.2. Data Availability and Forecast Periods
Most statistics only become available after a certain delay, in some cases of more than two or three years. Since the Base System (SPEL/EU-BS) is based on a large number of statistics from the most varied domains, those with the greatest time-lag are the limiting factor for updating the SPEL/EU data. Even if use is made of "preliminary results" and "preliminary estimates", the time-lag for establishing a "preliminary" specification of the ABTA and MAC is at least 1 to 2 years.
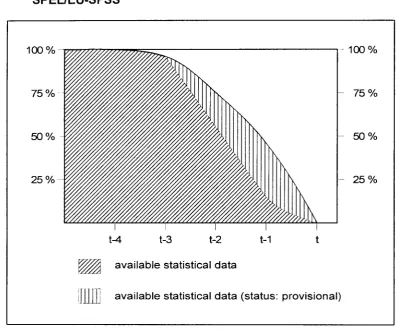
Figure 6 shows, approximately, the availability of original (final and provisional) statistical data needed for an ex-post specification of the SPEL/EU data. In this figure, if "t" is the middle of the current year, it is clear that with a time lag of 2 years, only about 3/4 of the required original statistical data are available for updating the SPEL/EU data, of which only about 2/3 have the status of final data. Even after 3 years, about 5 % of original statistical data are still missing, and only after 4 years is the "final" statistical database complete.
This has an important consequence for the SPEL/EU data because it takes at least four years to update them. When new data become available (to replace estimates), or when final data replace provisional figures, the whole process of model specification has to be repeated.
A further consequence is that there is only a small step between updating the SPEL/EU data for ex-post representation and using the SPEL/EU-SFSS for forecasts up to the current year. As has been shown, for updating the SPEL/EU data use is also made of estimates, while on the other hand for the application of the SPEL/EU-SFSS (e.g. for t-1) just a few statistical data are already sufficient.
The base year for the SPEL/EU-SFSS is always the last year for which the SPEL/EU data (specified by the Base System) are available. If we assume a time-lag of 2 years for the SPEL/EU data, we have the following time-scale for the application of the SPEL/EU-SFSS:
Activity Based Table of Account (ABTA) and Matrix of Activity Coefficients (MAC), cf. Chapter 4.
(t-2) base year (last year of the SPEL/EU data) (t-1 ) updating (first projection year)
(t) current year (second projection year) (t+1 ) ex-ante forecast (third projection year).
F i g u r e 6: A v a i l a b i l i t y of S t a t i s t i c a l Data for Updating S P E L / E U Data a n d the
S P E L / E U - S F S S
100%
75 %
5 0 %
2 5 %
100%
7 5 %
5 0 %
2 5 %
t-4 t-3 t-2
l l p i available statistical data
available statistical data (status: provisional)
The results for the first projection year can be interpreted as a provisional updating for an ex-post period and are mainly based on early statistical indicators.
The results for the second projection year may be regarded as either ex-post updates or ex-ante forecasts, depending on the timing of the forecasting exercise within the year. The time of forecasting determines whether these results are based more on early statistical indicators or on experts' estimates. They are the basis for a diagnosis of the current year.
The results for the third (or fourth) projection year are ex-ante forecasts based as far as possible on experts' estimates and trend extrapolations.
In the course of time, ex-ante forecasts can be compared with updating results, and later with preliminary and final results for the same year. Systematic comparative analyses of this kind have proved useful exercises for improving the quality of forecasts, in a continuous learning process.
Usually, the SFSS is applied in the spring and autumn of each year and, if required, at other times as well, mostly for agricultural policy simulations. The "routine" application in the autumn focuses on the diagnosis of the current year (projection year t), which can usually be based on the updated SPEL/EU data of t-1. The
[image:20.595.110.510.194.524.2]spring application is mainly an updating procedure in which the latest statistical data (early indicators) for t-1 are incorporated to improve the results of the previous autumn.
5.2.3. SFSS Structure and Methodology
5.2.3.1. Basic Approach
The SFSS is directly based on the analytical framework of the SPEL/EU System, as defined by the identities of the Activity Based Table of Accounts (ABTA) (cf. Chapter 4).
The ex-post updates and short-term forecasts are produced in two stages:
- first, the individual (exogenous) variables of the ABTA and MAC are estimated; - then the individual forecasts are combined within the ABTA and MAC.
During the updating period and in the very short period when the production process has already been initiated, most variables of the ABTA (yields, production levels, output and input prices, etc.) have to be regarded as exogenous variables. Then, the endogenous (residual) variables are used to balance the identities. The results are used for consistency and plausibility checks, and may serve as the starting point for well-defined data adjustment procedures.
These calculations are performed year by year for each Member State and then aggregated for the EU as a whole.
5.2.3.2. Forecasting of Individual Exogenous Variables
Different data sources and forecasting methods are used, depending on whether the system is being updated for ex-post periods, or whether ex-ante forecasts are to be produced.
For ex-post updates, in order to bridge the statistical gap, all available statistical information on the actual results of the variables is used. Preference is given to the use of preliminary (or even final) statistical data whenever they are already available. In other cases closely related variables (indicators) are used to derive estimates for the model variables. Only when no current information is available are estimates based on ex-post trend analyses of ABTA variables.
For ex-ante forecasts no precise data are available. The forecasts of most exogenous variables then have to be based on trend analyses of ABTA data or other related data (indicators). Policy-determined variables (administered prices, subsidies, quotas) are derived on the basis of specific policy scenarios or anticipated policy measures.
Updates and forecasts for the current year are a blend of the above two cases since they are mainly based on ex-post trend analyses and assumptions for policy-determined variables, but in some cases information from "early indicators" (such as meteorological data, sowings in winter cereals areas, initial price information etc.) is available, which is incorporated into the forecasts.
The forecasts produced by Eurostat from these data and by these procedures are called "system proposals" and have to be regarded as a starting point for subsequent forecasting work. However, it is evident that short-term developments are influenced by many factors which cannot be covered by formal econometric analysis. Developments are often affected by changes in trends (e.g. in the pig cycle) or random occurrences (such as droughts), but no solid statistical data or workable models are available to quantify these effects. Therefore, experts' judgment plays an important role in short-term analysis and is systematically incorporated in the SFSS forecasting procedure.
5.2.3.3. Incorporation of Experts' Judgment
The results of the individual variable forecasts (system proposals) are submitted for assessment by experts who have a detailed knowledge of specific fields, e.g. developments in certain branches of production, trends in output and input prices etc.
The expert receives for each variable (e.g. wheat yield, wheat production area) and country to be judged the results of the system proposal and documentation on the data and methods on which the forecast is based. For example, for wheat yields, the expert will receive a print-out of the chosen regression function (selected for best fit) and a plotted graph showing ex-post development and the ex-ante forecast. The task of the expert is to judge the forecast on the basis of all the information. The expert can accept the system proposal or modify it according to his/her subjective judgment. In the latter case, the expert proposal is documented and used in the subsequent forecasting procedure. Later when the forecasts can be compared with the actual situation, a check can be made of whether the expert's judgment has improved the forecast result and if so, to what extent.
Experience has shown that the expert's judgment usually improves the quality of short-term forecasts considerably. Therefore, the cooperation of experts is an indispensable element of the 3PEL/EU-SFSS (and probably any other reliable short-term forecasting work for agricultural production and income).
5.2.3.4. Integration of Forecasts for Individual Variables within the ABTA Accounting Framework
The forecast results for the individual exogenous variables are fed into the ABTA identity system. Then, in a series of recursive calculations, the residual endogenous variables (e.g. stock changes) can be derived by which the entire system can be specified (cf. WOLF 1995, Part 4).
By definition, the results of the forecasts are formally consistent within the framework of the ABTA, but this does not necessarily mean that the results are economically plausible in every respect. Therefore, the whole set of results is given a thorough review and plausibility check by Eurostat, which can result in further data adjustments. To exclude any arbitrary decisions, all stages are well documented and copies can be ordered by the user of the forecast results.
5.2.4. SFSS Status and Outlook
The SFSS has been used regularly since the middle of the 1980s. It is applied at least twice a year, usually in autumn and spring, and on special request, especially for simulations of the effects of agricultural policy decisions.
Simulations of the effects of agricultural policy decisions have mainly been concerned with the analysis of the short-term effects on incomes of alternative agricultural price proposals. The SFSS is also used to generate an up-to-date base year solution for the application of the Medium-term Forecast and Simulation System (SPEL/EU-MFSS) (cf. Chapter 5.3).
Overall, the SFSS has proved a useful tool for short-term forecasts and simulations of the effects of agricultural policy decisions. A number of systematic forecast checks undertaken at the end of the 1980s support this view. Other differentiated systematic ex-post forecast checks are planned for the next 18 months. A further step towards improving SFSS forecasts might be to incorporate experts' judgment systematically and not just occasionally as hitherto, not only at EU level, but also at Member State level. This would also stimulate communication between both levels on forecasting matters and contribute to a better understanding of the SPEL System.
5.3. Medium-term Forecast and Simulation System (SPEL/EU-MFSS)
5.3.1. Aims and Requirements
The MFSS was designed to be used for policy-oriented analyses, forecasts and simulation calculations. The idea was to create a model for agricultural administration by the European Commission and to promote dialogue with policy-makers. This resulted in the following specifications:
• the MFSS had to be transparent, so that policy-makers could follow the workings of the model and the data flow;
• it had to be highly detailed (the activity-based approach), so that account could be taken of individual variables relating to policy objectives and tools;
• it also had to be up-to-date and flexible, so that the latest data could be input and the reference year for forecasts and simulations would reflect the current situation;
• above all, however, the model had to have sound forecasting qualities, so that it could not only explain basic links (as academic models often do), but also provide highly accurate numerical forecasts for the most important variables relating to policy objectives (agricultural income, output, self-sufficiency level).
These requirements largely determined the methodological design and basic structure of the MFSS. One important feature is the modular structure, which is based on the unit construction principle. This allows individual components (supply, demand and external trade components) and sub-models to be produced and applied piecemeal, but is also designed to allow the various components to be combined into an overall system. The next section examines the structure of the MFSS and then takes a brief look at the experience so far gained with it.
5.3.2. MFSS Methodological Design
5.3.2.1. The Supply Component
The supply component explains how agricultural production adapts to basic economic changes, and in particular to administered agricultural prices and other agricultural policy measures affecting production.
When the supply component is applied in isolation for policy-related simulations which have hitherto been a priority, agricultural policy and other economic parameters are entered in the form of scenarios. The model then shows how output will adapt and how income will be generated in response to a given scenario. Under the overall system (see ch. 5.3.2.2.) agricultural pricing is then explained endogenously in terms of the interplay between supply, domestic demand and international agricultural trade, and taking the influence of policy into account.
For the design of the supply component, the two main concerns were an up-to-date reference base and sound forecasting ability. This was the main reason why the following two-stage approach was chosen:
(1) During the first stage, trend-based projections for all individual components in the SPEL matrix are produced using the SPEL/EU-BS time series (the approach is similar to that used in the SFSS, but for the medium term). These comprise detailed analyses of ex-post trends, consistency checks and expert assessments, particularly from the specialised departments of the European Commission's DG VI.
(2) During the second stage, the reactions to the changes in agricultural policy and general economic conditions (compared with trend developments) are calculated. Modelling for the second stage is based on three interrelated sub-models:
• The price expectation model explains the price expectations of farmers on the basis of past experience and prices administered under a given policy.
• The yield model then shows how production intensity (input use and yield per unit of production activity) adapts to the anticipated input and output prices. These calculations are based on production functions for the individual categories of crop and livestock products, and on the assumption that farmers determine input use and thus the level of yields per hectare/animal according to profit-maximizing principles.
• The central activity model shows the level of production activities as a function of changes in the value-added per unit of the production activities. Calculations are based on the concept of value-added elasticities, which was developed specifically for this purpose (WEBER 1992 and 1995). This seems to be more plausible than the conventional use of price elasticities, as the profitability of production activities also depends on input prices and technical progress. The specification of elasticities is based on comprehensive econometric estimates of the Institut für Agrarpolitik of the University of Bonn (WOLFGARTEN 1991) and detailed studies of specialist literature. These are combined to create a complete matrix of own and cross value-added elasticities in a specially developed linear-planning calibration process (WEBER 1992 and 1995) which also includes symmetry and homogeneity as theoretical constraints.
The individual sub-models are interlinked recursively, so that in a given year price expectations can be used as a basis for calculating first the way in which production intensity adapts within each type of activity, and then how the level of activity adapts to meet changes in value-added (which, in addition to technical progress and changes in production and factor prices, also reflect changes in production intensity). Similarly, models for individual calendar years are interlinked by a recursive-dynamic procedure to depict how the agricultural sector might develop in the medium term.
The results of the different sub-models are integrated in the sectoral accounting framework of the Activity-Based Table of Accounts (ABTA) (cf. Chapter 4.).
5.3.2.2. The Complete SPEL/EU-MFSS
After the system had been developed, work began on developing further components of the overall SPEL System in the early 1990s.
The demand component includes the various components of domestic use of raw and processed
agricultural products outside the agricultural production sector (food demand, feed use, seed use, industrial use and processing) and stock changes outside the agricultural production sector. A direct link to the supply component exists via the sales activities for raw agricultural products and the purchase activities for seed and feedingstuffs of the supply component. The central area of food demand is recorded using an elasticity-based analysis and forecasting system (SCHEIN 1993).
The external trade component was derived from a world trade model developed under a special research
project for DG VI of the European Commission (HENRICHSMEYER ET AL. 1994). This was designed as a non-spatial equilibrium model and (in its most comprehensive version) distinguishes between 24 different countries or regions of the world and contains supply and demand functions for 45 agricultural products. It allows derivation of the net trade functions between the EU and the rest of the world, which are integrated into the SPEL System as the "external trade component". For a more detailed analysis of the effects of the European Union's agricultural policy on foreign trade, the SPEL/EU-MFSS and world trade model can be iteratively linked by a recursive-dynamic procedure.
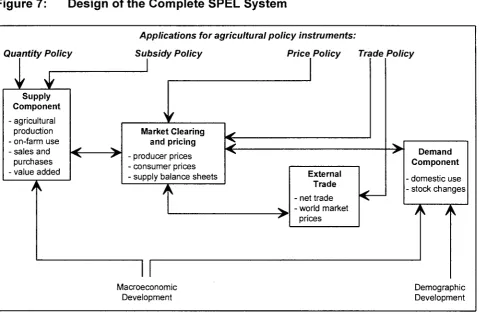
Figure 7: Design of the Complete SPEL System
Quantity Policy
v
±
Supply Component - agricultural
production - on-farm use - sales and
purchases - value added
Applications for agricultural policy instruments:
Subsidy Policy Price Policy Trade Policy
Market Clearing and pricing ■ producer prices ■ consumer prices ■ supply balance sheets
K-External Trade • net trade • world market
prices
Demand Component - domestic use - stock changes
Macroeconomic Development
Demographic Development
Figure 7 shows how the various components are interlinked in the overall system. In it, agricultural pricing
is derived from the interplay between supply, domestic demand and international trade and taking policy influence into account. Market clearing is one of the central constraints of this process. The combination of the results of the supply component (output and intra-branch consumption), demand component (use and stock changes outside the agricultural production sector) and external trade component (net trade) allows complete physical supply balance sheets to be produced.
The various components of the overall system come together as a non-linear programming model for individual calender years. Recursive-dynamic links allow developments in the agricultural sector of the EU Member States to be charted whilst taking account of international trade links. This flexible approach allows complex policy scenarios (EC agricultural reform, GATT decisions, etc.) to be depicted whilst enhancing transparency and intelligibility at the same time.
5.3.3. Applications for the SPEL/EU-MFSS
Since the late 1980s, the MFSS supply component has been used several times a year for policy-related simulations, and especially for preparing agricultural price proposals and EU agricultural reform. Topics for which detailed analyses have been carried out include the following:
1985 European Commission Green Paper
1988 Phasing-out of monetary compensatory amounts 1988/89 Introduction of stabilizer regulations
1990 Reduction of price support in the light of the GATT negotiations 1991 European Commission's proposal for CAP reform (McSharry proposal) 1992 Council of Ministers Decision on CAP reform.
[image:25.595.60.540.99.413.2]Much experience has since been gained with model applications for various situations and policy scenarios. It has also been possible to check various ex-ante projections on the basis of actual developments. On the whole, the SPEL/EU-MFSS supply component has proved a robust and reliable forecasting tool.
Modelling the drastic policy changes inherent in the CAP reform proved a special challenge. These simulations likewise produced plausible results that were borne out by the basic trends visible today (cf. HENRICHSMEYER 1995). In a few years' time it will be possible to check these forecasts more closely, too. The overall system is largely complete and is currently undergoing intensive testing in the form of ex-post and ex-ante forecasts. This means that for the next policy-related forecasts and simulations, it will be possible to apply the overall system (the MFSS supply model and world trade model) for the first time in addition to the tried and tested instruments.
6. OUTLOOK FOR FURTHER DEVELOPMENTS
With the development of the overall model described above, the SPEL System - as a comprehensive information system for policy-making - has been rounded off and reached a certain conclusion. We now have at our disposal a set of mutually compatible sub-components - a model for integrated data collection, consistency checks and ex-post analysis of agricultural developments (SPEL/EU-BS), a system for diagnosing current sectoral developments and generating short-term forecasts and simulations SFSS), and a comprehensive modelling system for medium-term forecasts and simulations (SPEL/EU-MFSS).
Furthermore, the data generated by work on SPEL opens up a number of possibilities for follow-up work by scientific and ministerial working parties in the individual Member States. Eurostat has introduced a wide range of possibilities for accessing the SPEL database.
As for the immediate future, the revision of the European System of Integrated Economic Accounts (ESA 1995) scheduled for the end of 1995 and the consequent revision of the methodology of the Economic Accounts for Agriculture will make adjustments to the definitions of the model system necessary.
In the field of "academic modelling", the development of a long-term model for the agricultural sector is planned as a follow-up project that takes explicit account of the primary factors of labour and capital and includes the dynamic links between resource allocation, output, income generation and adjustment of factor capacity (capital formation, mobility of labour). Preparatory work on an exploratory research topic of this type is currently under way at Bonn University's Institute for Agricultural Policy. It remains to be seen whether a simplified version of such a model might subsequently prove suitable for inclusion in a SPEL-type information system for policy-makers.
Another line for further development is that of adding more sub-components to the current SPEL System. Various preliminary studies have been carried out which allow the cost and usefulness of the various conceivable directions for further development to be assessed. The simplest would be to add to the income calculation incomes from non-agricultural income sources, provided the calculations performed for Eurostat (EUROSTAT 1995b) are accepted as a sufficiently precise source of information. The various income sources could be combined into a fairly simply structured total income module including not only final ex-post results but also projection and simulation possibilities. This would of course involve a switchover from the "agriculture" production sector to the "private households" sector and in this particular case "private agricultural households". The agricultural production of non-agricultural households would then have to be listed separately (as a sort of residual).
Extensive preliminary work and model tests have been carried out for a budget module depicting the effects of alternative policy scenarios on the development of EU market regulation costs (WEBER 1992).
Any further extension would require the inclusion of information from the European Commission and therefore would only be possible in close cooperation with the appropriate department of DG VI.
There are two directions for further differentiation and extension of the policy-related SPEL System:
first, a stylised regional differentiation of the model, and second, the incorporation of certain agricultural-environmental aspects, providing these can be recorded in a blanket model for the EU and are relevant to the EU.
A regional differentiation of the SPEL System - or at least a rough regional differentiation - is needed to
depict the increasing régionalisation of agricultural policy (set-aside measures, regionally differentiated transfer payments, quota regulations). Taking a blanket model for the EU as a whole, however, this could only be a roughly stylised régionalisation (at the level of NUTS II regions), which could basically record only the sectoral impact of regionally differentiated measures and explain how repercussions differed from one region to the next. Analyses for specific regions would have to be done in situ by working groups (cf. GARCÍA ALVAREZ-COQUE 1995, p. 70). However, the results produced by an overall, roughly regionalised SPEL System could be used to construct an economic framework for regional case studies which is consistent with overall sectoral developments at EU level (and which would otherwise be virtually impossible to produce). Initial exploratory attempts to produce a roughly stylised regional version of the SPEL System have shown that the mere inclusion of official statistical data available at NUTS II level (yields, cultivated areas, livestock numbers, etc.) leads to a clear and generally plausible regional presentation of results (FROHBERG 1993) and that the requisite effort is within acceptable limits.
Once a regionalised SPEL System has been produced, it would then be possible, at little extra cost, to incorporate a number of environmental indicators that are relevant at EU level into the system. The most conceivable items would be regional nitrogen balances and indicators for recording gases emitted by the farming industry into the atmosphere. Nitrogen balances provide an indicator of the potential threat to soil and water, particularly groundwater. The crucial advantage of their integration into an economic forecasting and simulation system over the static ex-post balances that are frequently calculated is that such a system can record the impact of changes in basic agricultural and environmental policy (e.g. CAP reform, a nitrogen tax and/or limitation of livestock density). Investigations carried out using RAUMIS, an agricultural-environmental model with detailed regional breakdown devised for the Federal Republic of Germany, show how great the analysis potential is in policy-making terms (STROTMANN 1992, WEINGARTEN 1995).
On the whole, the possibilities inherent in régionalisation and in incorporating environmental indicators confirm that the modular approach of the SPEL System again allows flexible (and technically straightforward) adjustments to be made to changing problems and issues relevant to policy-making.