promoting access to White Rose research papers
White Rose Research Online [email protected]
Universities of Leeds, Sheffield and York
http://eprints.whiterose.ac.uk/
This is an author produced version of a paper published in Proceedings of the
Institution of Mechanical Engineers, Part P: Journal of Sports Engineering
and Technology.
White Rose Research Online URL for this paper:
http://eprints.whiterose.ac.uk/76696
Published paper
Clarke, J., Carre, M.J., Damm, L. and Dixon, S. (2013) The development of an
apparatus to understand the traction developed at the shoe-surface interface in tennis. Proceedings of the Institution of Mechanical Engineers, Part P: Journal of Sports Engineering and Technology, 227 (3). 149 - 160. ISSN 1754-3371
Title: The development of an apparatus to understand the traction developed at the shoe-surface interface in tennis.
James Clarke1*, *Matt Carré1, Loic Damm2, and Sharon Dixon2.
*Corresponding Author, [email protected], 0114-222-7839.
1Sports Engineering Research Group, The University of Sheffield, Department of Mechanical
Engineering, Mappin Street, Sheffield, S1 3JD, UK.
2Exeter Biomechanics Research Team, University of Exeter, St Lukes Campus, Heavitree Road, Exeter,
EX1 2LU, UK.
Abstract:
The traction developed at the shoe-surface interface can have a significant influence on a player’s injury risk and performance in tennis. The purpose of this study was to investigate shoe-surface traction on a dry acrylic hard court and two artificial clay court tennis surfaces in dry and wet conditions. A laboratory-based mechanical test rig was developed to measure the traction force developed at the shoe-surface interface. Linear regression analysis was used to examine the relationship between normal force and three measures of traction: initial stiffness, peak traction force and average dynamic traction force. The normal force did not significantly influence the initial stiffness for the shoe-surface system on the acrylic hard court but did on the artificial clay surfaces. The infill particle size and the addition of moisture influenced the traction developed on the artificial clay surfaces. Small, dry particles developed greater traction, and with a sufficiently high applied normal force will provide traction comparable to that on an acrylic hard court. However, increased particle size and/or the presence of moisture generally reduced traction. Strong and significant positive linear relationships were found between peak traction force and average dynamic traction force for all surface types and conditions. This study improves the understanding of the influence surface characteristics have on shoe-surface traction mechanisms. Once traction mechanisms are understood, surface properties and/or footwear can be effectively changed to maximise performance and/or minimise injury risk.
Keywords: Sport surface; tennis; footwear; traction.
1. Introduction:
1.1 Importance of understanding shoe-surface traction in tennis.
will result in a loss of performance or, if the slip is severe, lead to a fall which may cause injury itself. This study investigates and compares the traction developed at the shoe-surface interface on an acrylic hard court (AHC) and two artificial clay court tennis shoe-surfaces (ACC1 and ACC2). Acrylic hard court tennis surfaces are constructed with a coating of acrylic paint and silica sand mix whereas artificial clay courts are constructed with a synthetic surface membrane, usually a fibre carpet, covered with a layer of clay or sand particles. An artificial clay surface can be described as a synthetic surface with the appearance of clay, whereas a clay surface is constructed from unbound aggregate. The surfaces are called an ‘artificial clay’ because they are designed to simulate a clay tennis court condition.
Biener and Caluori reported 21% of injuries over a range of tennis surfaces were due to uncontrolled slipping [4]. The severity of a slip can be determined by the distance which the shoe moves relative to the surface [5] which will be dependent on the traction force developed at the shoe-surface interface. Clay surfaces have been reported to have a lower occurrence of injury, compared with acrylic hard court surfaces [6-10]. This has partly been attributed to inherent differing styles of play on each surface caused by differences in ball speed and bounce [6]. However, the tractional characteristics of the playing surface also affects the risk of accidental injury occurrence [11-12]. This has led to the hypothesis that surfaces which do not allow sliding increase the potential to cause injury.
1.2 Mechanical shoe-surface traction test devices
The first aim of this study was to develop a laboratory based mechanical test device capable of measuring the development of traction during shoe-surface contact under loading conditions relevant to the game of tennis. Mechanical test devices are commonly used to measure shoe-surface traction in sport. Most test devices apply and measure a rotational or translational shear force to a loaded test ‘shoe’ (actual or simulated) that is mechanically driven across a surface. Mechanical test devices have the advantage of creating objective loading conditions that provide a repeatable measure of shoe-surface traction, eliminating the inherent uncertainties that exist when human subject testing is employed. Frederick highlighted the need to develop repeatable test methods to quantify the range of traction that will allow high performance and acceptable injury risk in sport [1]. However, there exists a large variation in current mechanical test methodologies utilised to measure traction at the shoe-surface interface [13]. Methodologies vary in terms of their loading conditions, driving mechanism and the extracted measurement of traction. These large variations in test devices make a direct comparison of results unreliable. Although studies have been conducted comparing the results of differing methodologies, both for sports situations and pedestrian slip [13-19] there is little evidence which device most clearly predicts the traction likely to be experienced by a human [20-21].
force that when measured in a static set up is 24.5 N. Lewis et al. found the average normal force applied by the pendulum to be 12 N when conducting dynamic tests with a pendulum of identical specification on a force plate [22]. These forces are well below the forces found during dynamic athletic movements by a tennis player during play [23-24] and the level of normal load applied is likely to influence the shoe-surface interaction for tennis. Viscoelastic rubber is commonly used on the outsoles of tennis shoes and the real contact area between a viscoelastic material and a solid substrate, such as an acrylic hard court tennis surface, will be dependent on the normal loading conditions [25-26]. As normal force increases the rubber compresses against the surface, increasing asperity contact and the adhesional and hysteretic components of traction. The traction a particle-based surface, such as an artificial clay tennis surface, provides will increase with its shear strength. The shear strength of a surface with particle layers, such as an artificial clay tennis surface, will also be dependent on the normal load [27]. The normal loading conditions affect the cohesion between particles which will affect the surface's resistance to shear [28-29].
1.3 Understanding the mechanisms of shoe-surface contact
The second aim of this paper is to present experimental data that can build on current understanding of the traction developed at the shoe-surface interface for acrylic hard court and artificial clay surfaces. These different surfaces clearly lead to different types of biomechanical loading, such as a controlled slide on a clay court and therefore different traction requirements, but this will be discussed in future papers. This paper examines whether the new device is capable of measuring different traction characteristics for different surfaces, under a range of normal loading. Despite the accepted knowledge that a shoe-surface combination with excessive traction is likely to increase injury risk in sport, there has been relatively little research on how shoe and surface characteristics influence traction. There is therefore a requirement for improved scientific understanding of shoe-surface interactions in sport and the tribological mechanisms at play [13]. In clean, dry conditions, the traction developed between a viscoelastic tennis shoe outsole and a hard solid substrate (such as an acrylic hard court) will depend on the contribution of adhesion and hysteresis friction mechanisms [16, 25, 30-31]. The traction provided by an artificial clay court will be dependent on the contact between the shoe and the clay particles and by inter-particle friction. Electrostatic attraction causes small particles to compress and bond under loading, increasing shear strength. Artificial clay courts are usually watered as part of a maintenance regime and this moisture content is also likely to influence traction due to changes in the shear strength of the surface [28-29].
2. Development of test rig: 2.1 Understanding human motion.
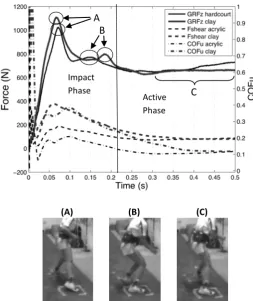
mechanical test requires an understanding of biomechanical data. Damm et al. used a force platform to measure three-dimensional ground reaction forces of the leading leg as tennis players performed a side jump movement out of stance (with fixed foot position) on both an acrylic hard court and an artificial clay surface [23]. A typical force-time trace is shown in Figure 1 and can be characterised by two phases: an impact phase and an active phase. The impact phase includes the player's initial forefoot contact with the surface and results in a peak force. This peak can be described as a ‘passive force peak’ as the muscular system does not change its activity during this phase [32]. Figure 1 shows it is during the impact phase that the player exerts their highest traction demands on the surface as the utilised coefficient of friction (COFu) and shear force (Fshear) also peak. It is argued that it is during
the impact phase of a movement that a player is most at risk from injury caused by excessive forces [11, 32]. It is also during this impact phase that a player is most at risk of experiencing a slip that will lead to a fall, as the player will be less able to respond and recover their balance [33]. During the active phase the musculo-skeletal system is active and the player now requires sufficiently high traction to accelerate away from the surface [32]. Any slip within this phase can be defined as a loss of performance. Within the active phase the normal force does not peak as the active phase describes the player stepping away from the surface. The normal ground reaction forces (GRFZ) presented in Figure 1 can
be further split into three sections that describe the shoe-surface contact. Section A relates to the time during when the forefoot first makes contact with the surface; section B to when the remainder of the foot makes contact until flat on the ground; and C to a phase when the traction in the surface is utilised for propulsion of the player [11, 34].
The mean peak normal ground reaction forces on both surfaces were not found to be significantly different. The mean passive peak normal force on the acyclic hard court surface was 1153.3 ±153.6 N and the mean passive peak on the clay surface was 1035.6 ± 153.6 N. The time of peak normal force appears to coincide with the time of peak shear force (between 0.06-0.07 seconds in Figure 1). It has been reported that clay tennis surfaces have dynamic traction/friction coefficients of 0.5 - 0.7 and acrylic hard court surfaces have dynamic traction/friction coefficients of 0.8 - 1.2 [6]. Surprisingly, the peak horizontal shear force (Fshear) during the impact phase was found to be significantly greater
(A) (B) (C)
Figure 1: Example of vertical component of GRF (GRFz), shear force (Fshear) and utilised coefficient of friction
(COFu) during a side jump movement on two surfaces, and stills from filming showing forefoot impact (A),
foot flat impact (B), and a phase of forefoot propulsion (C). Modified from [23].
2.2 Mechanical test device development.
A mechanical test device was required to conduct repeatable and reliable traction tests on a range of tennis surfaces. To fully replicate the full range of very complex dynamic changes in actual biomechanical loading is an immense challenge, so the aim of this device was to focus on the traction developed at the shoe-surface interface, when a shear force was gradually increased, using a test shoe under a range of normal loads. The results from this device could then be used to compare the surfaces and predict how they would perform in situations with different traction requirements. Pneumatic rams were chosen to apply the loads as they had been proven to be a robust, repeatable lightweight method that allowed flexibility for future rig development (e.g. the addition of computer-controlled valves allowing a range of dynamic load patterns). A number of studies have used velocity controlled motor-driven mechanical test devices when investigating the traction of shoe-surface interactions in sport [35-37]. It is argued that velocity-driven traction test devices are not suitable for classifying the traction developed during the initial movement of a shoe relative to a surface. A force-controlled test device, as developed in this study, provides a dynamic, increasing force in the horizontal direction. This is a critical simulation as it measures the traction force at which the surface effectively fails under loading and can be related to what a player might experience.
Active Phase Impact
Phase A
B
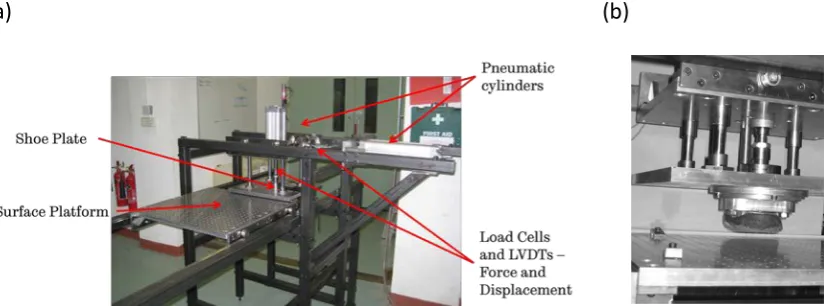
The laboratory-based traction testing device, developed at The University of Sheffield is shown in Figure 2. Firstly a section of a shoe sample is attached onto the shoe plate. A surface sample is then secured on a platform which is slid into place via a bearing and rail system before being secured. A pneumatic ram provides a controlled normal force to the shoe plate which is held rigidly in place via four rods that are only free to move vertically via sealed cartridge bearings. This provides the device with rigidity and limits deviation in the applied normal force, as reported by Severn et al. with respect to previous traction testing methods [37]. Once the desired normal force has been reached, using a throttle valve, a high-pressure pneumatic ram provides a controlled driving force in the horizontal direction. A solenoid valve is opened, opening the pneumatic cylinder, to provide a horizontal force. The horizontal force increases until sliding is initiated. The shoe-plate and assembly moves horizontally on low friction roller bearings and the maximum sliding length is 250 mm. Load cells in the horizontal and vertical direction and a horizontal linear variable differential transformer (LVDT) provide the necessary measurements to describe traction behaviour. Voltage signals from the load cells and LVDT are sampled simultaneously, via signal conditioning modules (National Instruments model numbers NI9237 and NI9215, respectively) and a data acquisition device (National Instruments model number NI9174) and displayed in real time using LabView (version 9 National Instruments). The respective signals are sampled at 2000 Hz and transformed into force and displacement measurements.
(a) (b)
Figure 2: (a) Bespoke traction testing device and (b) a side view of the shoe plate, with shoe attached, and surface platform.
2.3 Methodology
[image:7.595.79.493.421.574.2]were conducted under an appropriate range of normal forces and linear regression analysis was conducted to investigate the relationships between normal force and measures of traction [23].
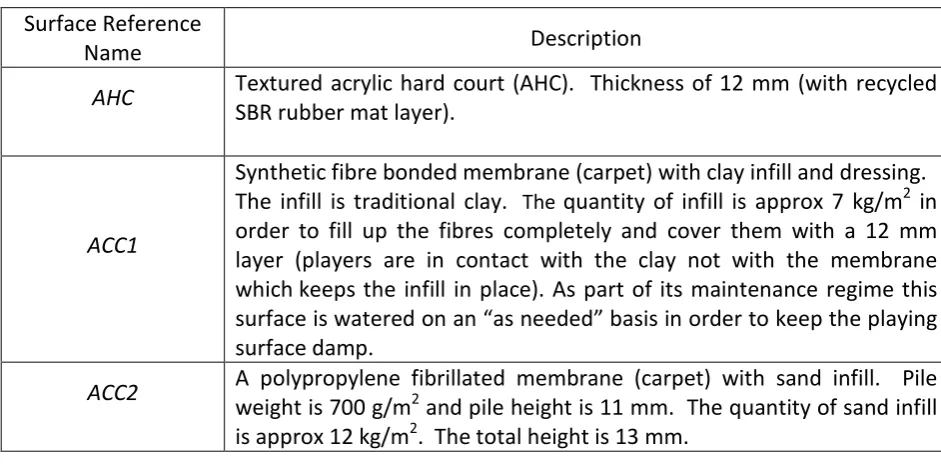
Table 1: Description of test surfaces, based on definitions in manufacturers' specifications
Surface Reference
Name Description
AHC Textured acrylic hard court (AHC). Thickness of 12 mm (with recycled SBR rubber mat layer).
ACC1
Synthetic fibre bonded membrane (carpet) with clay infill and dressing. The infill is traditional clay. The quantity of infill is approx 7 kg/m2 in order to fill up the fibres completely and cover them with a 12 mm layer (players are in contact with the clay not with the membrane which keeps the infill in place). As part of its maintenance regime this surface is watered on an “as needed” basis in order to keep the playing surface damp.
ACC2 A polypropylene fibrillated membrane (carpet) with sand infill. Pile weight is 700 g/m2 and pile height is 11 mm. The quantity of sand infill
is approx 12 kg/m2. The total height is 13 mm.
The test procedure was designed to best replicate the side jump movement described by Damm et al. It was assumed that throughout the critical contacts at which traction is essential (forefoot impact and forefoot propulsion) flexion of the shoe occurs at the Metatarsal-Phalangeal (MP) joint. It was therefore assumed that the segment of the shoe outsole in contact with the surface will be the forefoot segment in front of the MP joint. The approximate location of the MP joint line of a commercially available tennis shoe (Adidas Barricade 6.0) was identified. The shoe was then cut across this line and the remaining segment was attached onto the device with a preloaded contact angle between the outsole and the surface set at 7°. Before testing began the outsole was cleaned with an ethanol solution and allowed to dry at ambient temperature. Prior to testing under each condition, the outsole was prepared by applying P400 silicon carbide paper by hand under minimal pressure as to not change the tread pattern nor the surface texture of the sole. Any debris from the shoe was removed using a clean, soft, dry brush. These procedures are in accordance with parts of BS EN ISO 13287:2007 (International Standard: Personal protective equipment. Footwear. Test method for slip resistance). The front of the shoe was rotated 90° to the direction of movement in order to replicate the likely shoe orientation during a side jump movement. Each test was conducted on a different section of the AHC surface sample in order to negate the influence of wear.
added in order to adhere to the specifications discussed in Table 1. When testing in dry conditions, prior to every test run, the particles were brushed by hand to ensure an approximately even distribution of particles over the membrane. This was done by observation as opposed to measurement.
As described in Table 1 the ACC1 surface is to be kept ‘damp’ for play whereas the ACC2 surface is prepared dry. The quantity of moisture to be added to the ACC1 surface was not specified by its manufacturer. It was decided in this study to test the surfaces in completely dry conditions and then add the same quantity of moisture to each surface to compare wet and dry conditions. During professional tennis play on clay courts it is acceptable to play during light rainfall for a short period of time. Light rainfall is defined as 2.5 mm/hour. It was decided to simulate conditions after 24 minutes of play in light rain during which 1 mm of rainfall would have occurred, which equates to 1 litre of water per square meter of surface. Water was added to the artificial clay surfaces with a calibrated sprayer. The water was sprayed by hand and care was taken to ensure the surface was sprayed evenly. However, the surfaces dried naturally during testing and it was challenging to ensure the moisture content of every test was equal. The surfaces were observed throughout testing and water was added when it was felt appropriate.
2.4 Definition of parameters
(a)
[image:10.595.72.500.81.621.2](b)
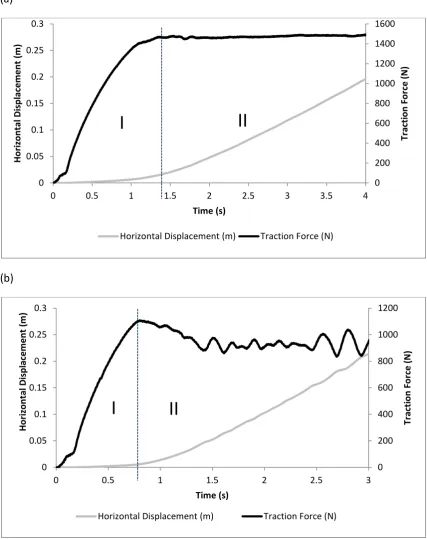
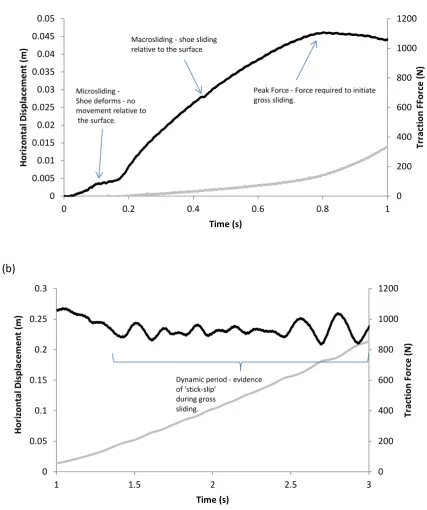
Figure 3: Typical plots of force and displacement against time when testing on (a) The AHC surface and (b) The wet ACC1 surface.
Within the static regime, evidence of micro- and macro-sliding is observed (Figure 4). Micro-sliding describes the period of shearing in which the viscoelastic outsole is deformed under initial horizontal force. Within this time no relative sliding between the outsole and the surface occur. During micro-sliding the magnitude of the traction force recorded will depend on the shear strength of the shoe outsole system and the force required to initiate sliding at the shoe-surface interface. Macro-sliding describes the period of initial relative
0 200 400 600 800 1000 1200 1400 1600 0 0.05 0.1 0.15 0.2 0.25 0.3
0 0.5 1 1.5 2 2.5 3 3.5 4
Tr ac tio n Fo rc e ( N ) Ho riz on ta l D is pl ac eme nt (m) Time (s)
Horizontal Displacement (m) Traction Force (N)
I
II
0 200 400 600 800 1000 1200 0 0.05 0.1 0.15 0.2 0.25 0.3
0 0.5 1 1.5 2 2.5 3
Tr ac tio n Fo rc e ( N ) Ho riz on ta l D is pl ac eme nt (m) Time (s)
Horizontal Displacement (m) Traction Force (N)
sliding between the shoe and the surface (Figure 4a). A peak is reached at which the shoe-surface system fails. The peak traction force will be reached when the traction force exceeds the yield shear strength of the shoe-surface system. After failure, the static regime ends and a period of dynamic gross-sliding begins (Figure 4b). During gross-sliding the velocity remains relatively constant.
(a)
(b)
Figure 4: (a) Static regime of the plot shown in Figure 3b of force (black line) and displacement (grey line) against time when testing on the wet ACC1 surface. (b) Dynamic regime of the plot shown in Figure 3b of force and displacement against time when testing on the wet ACC1 surface.
0 200 400 600 800 1000 1200 0 0.005 0.01 0.015 0.02 0.025 0.03 0.035 0.04 0.045 0.05
0 0.2 0.4 0.6 0.8 1
Tr ra ct io n F Fo rc e (N ) Ho riz on ta l D is pl ac eme nt (m) Time (s) Microsliding - Shoe deforms - no movement relative to the surface.
Macrosliding - shoe sliding relative to the surface
Peak Force - Force required to initiate gross sliding. 0 200 400 600 800 1000 1200 0 0.05 0.1 0.15 0.2 0.25 0.3
1 1.5 2 2.5 3
Tr ac tio n Fo rc e ( N ) Ho riz on ta l D is pl ac eme nt (m) Time (s)
Dynamic period - evidence of 'stick-slip'
[image:11.595.82.510.185.696.2]Three parameters from each plot were extracted to understand the traction developed at the shoe-surface interface. These were:
1. The initial ‘shear stiffness’ of the shoe-surface system. This is defined as the average ratio of traction force and horizontal displacement during the static regime between 0 and 0.002 m of horizontal displacement. This measure relates to the traction a player will experience if the movement does not develop into gross- (or dynamic) sliding. During the active phase of a movement a stiff shoe-surface system is desirable as the player require traction to accelerate. However, during the impact phase high stiffness (resistance to sliding) may cause increased joint loading in the lower extremities. 2. The peak traction force at the transition between the static and dynamic traction
regimes. If the peak traction is reached the shoe-surface system will fail and the traction regime will become dynamic. This is related to a player’s likelihood to slip. A slip of any magnitude can be defined as a loss of performance and, if severe, may lead to a fall.
3. It has been observed that unintentional slips can occur over large displacements [38]. Therefore, the mean dynamic traction was measured between 0.05 and 0.20 m. If slipping occurs then the severity of a slip will be dependent on the traction force developed during the dynamic traction regime.
3. Results
When first examining the relationships between the three traction parameters, compared with the normal load applied, it was found that the vast majority could be described using a linear fit. Although, not necessarily being appropriate for an analytical model of traction over a larger range of normal loads (such as when limits of particular mechanisms are reached), this was considered as a useful tool for comparing the results from the different surfaces tested. Therefore, linear regression analysis was used to analyse the relationships found for the different surfaces. The linear relationships between normal force and the measures of traction can be described by the equation y=mFN+c, where y is the particular
traction parameter, FN is the normal force and m and c are constants. The square of the
Pearson correlation coefficient (R2) was used to determine the strength of the linear
Table 2: Linear relationship coefficients showing effect of normal force applied on each traction parameter.
Surface m Initial Stiffness c R2 p m Peak Traction Force c R2 p m Average Dynamic Traction Force c R2 p
AHC 54.39 279795 0.15 0.066 0.72 360.76 0.85 < 0.05 0.75 336.42 0.77 < 0.05
ACC1 - dry 119.31 178348 0.84 < 0.05 1.23 -305.75 0.81 < 0.05 0.78 109.88 0.51 < 0.05
ACC1 - wet 150.53 148795 0.62 < 0.05 0.62 182.78 0.85 < 0.05 0.55 164.14 0.82 < 0.05
ACC2 - dry 96.45 165188 0.27 < 0.05 0.34 361.25 0.40 < 0.05 0.27 373.07 0.75 < 0.05
ACC2 - wet 179.22 111560 0.95 < 0.05 0.71 2.604 0.96 < 0.05 0.49 149.03 0.96 < 0.05
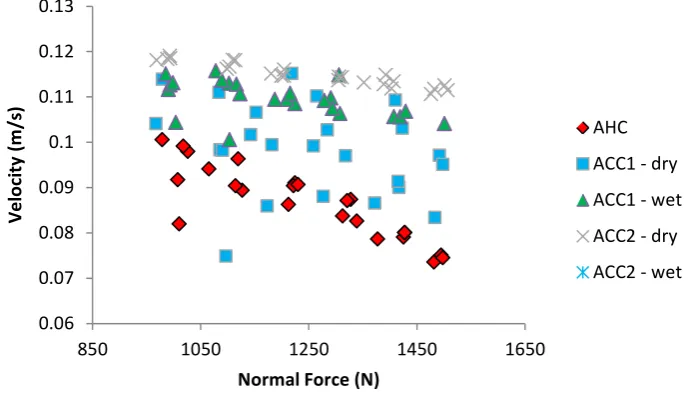
[image:13.595.126.476.361.561.2]The average test velocities during the dynamic period of traction for each test are presented in Figure 5. As the test rig is force-controlled, the velocity is dependent on shoe-surface interaction and normal force. A negative relationship between normal force and velocity was found. The average velocity (over all tests) varied from 0.074 m/s (AHC at 1481 N normal force) and 0.12 m/s (wet ACC2 surface at 993 N normal force). In comparison to other mechanical devices that are used to measure the dynamic traction of shoe-surface contacts in sports this is relatively slow. For example, Clarke et al. and Shorten et al. tested at 0.3 m/s, Wannop et al. (2012) tested at 0.2 m/s, and Wannop et al. (2010) and Severn et al. tested at 0.01 m/s [12, 35-37, 39].
Figure 5: Plots of average velocity against normal force.
3.1 Relationship between initial stiffness and normal force.
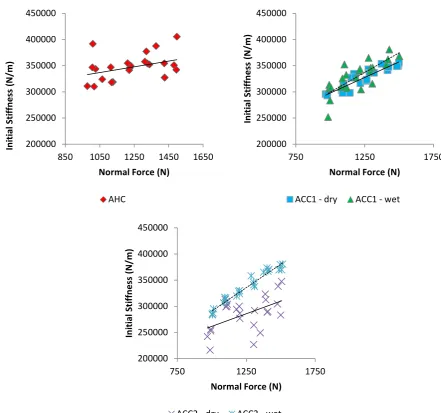
Figure 6 shows the relationships between initial stiffness and normal force for all surface conditions. For the AHC surface the relationship was positive but not statistically significant suggesting that the initial stiffness of the shoe-surface system is not dependent on normal loading. For the dry ACC1 surface a strong, significant, positive, linear relationship was found. For the wet ACC1 the relationship was also found to be statistically significant. This shows the shear stiffness of the shoe-surface system in both wet and dry clay conditions is
0.06 0.07 0.08 0.09 0.1 0.11 0.12 0.13
850 1050 1250 1450 1650
Vel
oc
ity
(m
/s
)
Normal Force (N)
influenced by the normal force. The ACC2 surface showed a weak but significant linear relationship in the dry conditions and a strong significant linear relationship in the wet suggesting that the moisture influenced the response of the surface during the initial period of horizontal loading.
[image:14.595.74.516.154.567.2]
Figure 6: Plots of initial stiffness against normal force (with linear regression lines).
3.2 Relationship between peak traction force and normal force.
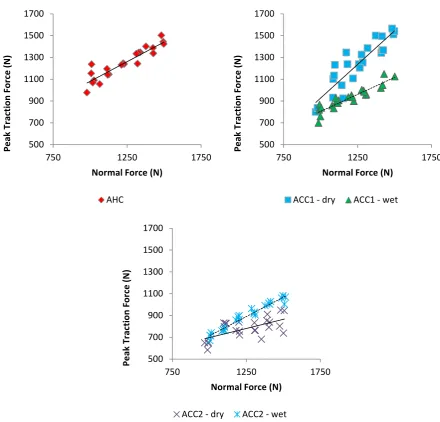
Figure 7 shows the relationships between static peak traction force and normal force. Strong and significant linear relationships were found for each surface condition. As normal loading increased, the ACC2 surface in its dry condition was found to exhibit the lowest peak static traction force. The ACC1 surface in the dry condition exhibits lower peak traction force than the AHC surface at lower normal loads but higher peak traction force at higher normal loads. Considering the two artificial clay surfaces; the dry ACC2 surface generally
200000 250000 300000 350000 400000 450000
850 1050 1250 1450 1650
In itia l S tif fn es s (N /m )
Normal Force (N)
AHC 200000 250000 300000 350000 400000 450000
750 1250 1750
In itia l S tif fn es s (N /m )
Normal Force (N)
ACC1 - dry ACC1 - wet
200000 250000 300000 350000 400000 450000
750 1250 1750
In itia l S tif fn es s (N /m )
Normal Force (N)
has lower peak traction than when wet. However, the opposite is observed with the ACC1 surface which has a greater peak traction force in dry conditions.
Figure 7: Plots of peak traction force against normal force (with linear regression lines).
3.3 Relationship between dynamic traction force and normal force
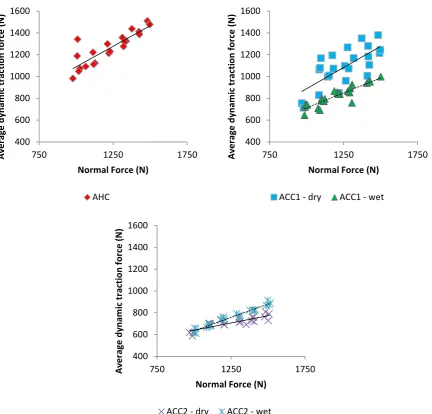
Figure 8 shows the relationships between the average dynamic traction force and normal force. Strong and significant linear relationships were found for each surface condition. The weaker relationship observed for the dry ACC1 surface highlights the greater variation in data for this condition. The ACC1 surface exhibits lower average dynamic traction when wet, compared to dry. In an opposite trend to the ACC1 surface system, generally, the ACC2 surface develops greater dynamic traction in the wet conditions as opposed to dry.
500 700 900 1100 1300 1500 1700
750 1250 1750
Pea k T ra ct io n F or ce (N )
Normal Force (N)
AHC 500 700 900 1100 1300 1500 1700
750 1250 1750
Pea k T ra ct io n F or ce (N )
Normal Force (N)
ACC1 - dry ACC1 - wet
500 700 900 1100 1300 1500 1700
750 1250 1750
Pea k T ra ct io n F or ce (N )
Normal Force (N)
Figure 8: Plots of average dynamic traction force against normal force (with linear regression lines).
4. Discussion
4.1 Understanding the traction mechanisms developed on the tennis surfaces
4.1.1 The influence of normal loading on the initial stiffness
The initial stiffness of both the artificial clay surfaces in dry and wet conditions correlated significantly with normal force, whereas the stiffness of the AHC surface did not. The initial stiffness will be dependent on the elastic limit of the adhesional bonds that are formed during contact due to van der Waals interactions and the internal hysteresis of the rubber as it overcomes the roughness of the surface [30, 40]. Although rubber contact theory suggests that the traction will increase with increased normal force these findings show that the initial stiffness does not and therefore the stiffness experienced by a player when carrying out a movement on acrylic hard courts may not be dependent on the normal force exerted.
400 600 800 1000 1200 1400 1600
750 1250 1750
Av er ag e dy na m ic tr ac tio n fo rc e ( N )
Normal Force (N)
AHC 400 600 800 1000 1200 1400 1600
750 1250 1750
Av er ag e dy na m ic tr ac tio n fo rc e ( N )
Normal Force (N)
ACC1 - dry ACC1 - wet
400 600 800 1000 1200 1400 1600
750 1250 1750
Av er ag e dy na m ic tr ac tio n fo rc e ( N )
Normal Force (N)
The reduced shear forces exerted by players on the acrylic hard court, shown in Figure 1, suggest that the players are operating within the initial region of the force-displacement curve measured in this study which could be described as being within the shoe-surface system's elastic region. The findings in this study suggest that the initial stiffness provided by an acrylic hard court will not be dependent on the normal force exerted by the player but more likely, the specific characteristics of the shoe and the surface.
The significant linear relationships found between initial stiffness and normal force for the dry artificial clay surfaces are thought to be caused by the surface responding and effectively increasing its shear strength as the normal load increases. The clay used in the ACC1 surface system has a particle size of approx 4 µm. Particles below 50 µm have been shown to form strong cohesive bonds in dry conditions [41]. It has been reported that below 50 μm particles do not act as individual entities and instead form layers with high inter-particle shear strength [27, 41]. Under increased normal loading it is likely that the shear strength of the dry ACC1 surface will increase as particles are compressed and cohere. If the shear strength at the shoe-surface interface is greater than the shear strength within the clay surface the failure of the shoe-surface system will be dependent on the shear strength of the cohered clay layers. During the static regime the point marco-sliding becomes gross-sliding will therefore be dependent on the yield strength of the surface system, not (as in the case of acrylic hard courts) the yield strength at the shoe-surface interface. In dry conditions, as the ACC1 surface fails, it is likely that brittle shear failure will occur.
The dry ACC2 surface exhibited reduced initial stiffness compared to the dry ACC1 surface. The sand particles (> 63 µm) used in the ACC2 surface system are much greater in size. Mills
et al. reported 60 µm to be a threshold at which dry particles act as single entities and are less likely to cohere, hence influencing the mechanical behavior of the surface [27]. The traction mechanism developed on the dry ACC2 surface will therefore be more likely influenced by inter-particle friction as opposed to the shear strength of cohered particles. If particles behave discretely the traction mechanism will be based on particles rolling beneath the outsole, as opposed to a shearing mechanism.
In particle-based surfaces the presence of moisture strongly influences their mechanical behaviour. The effective stress (σe) of a particle-based surface governs its strength [29] and
this is defined as the total stress acting on a surface particle, σ, minus the pore pressure, u, (stress in the water in the pores), hence, σe = σ – u. Therefore as pore pressure increases,
less likely to behave as single entities, and the shear strength of the surface will be dependent on the strength of cohesion between particles. In the wet condition, as normal loading is increased, the strength of the surface will increase, this may explain why a significant relationship between the normal force and initial stiffness was observed in wet conditions and not dry on the ACC2 surface. However, Figure 6 shows that the initial stiffness of the ACC1 surface was not significantly influenced by the presence of moisture suggesting that during the initial shear loading the response of this surface system is not dependent on moisture.
4.1.2 The influence of normal loading on the peak traction force
The dry ACC2 surface exhibited the lowest peak traction force, whereas the AHC and the dry ACC1 surfaces show comparable levels of high peak traction force. This suggests the shear yield strengths of the AHC and the dry ACC1 surfaces are greater than the shear yield strength of the wet ACC1 surface. This is in contradiction to the initial stiffness results.
The peak traction force is greater in the dry than the wet with the ACC1 surface. In the dry conditions the shear yield strength of the surface will be dependent on the cohesion of the clay particles. As discussed in section 4.1.1 the effective stress of a surface system is dependent on pore pressure. Guisasola et al. reported a reduction in shear yield strength of cohesive clay based soils with increased moisture content [29]. Increased pore pressure decreases the effective stress and the distance between particles is increased, reducing particle cohesion. This may explain the reduced peak traction in wet conditions compared to dry conditions with the ACC1 surface observed in the results of this study.
The peak traction force is generally greater in the wet than the dry with the ACC2 surface. The results suggest that the degree of saturation in these tests increased the shear yield strength of the ACC2 surface system. Negative pore pressure increases the shear yield strength caused in wet conditions. It was also observed that, during testing, during the period of macro-sliding sand particles would build up ahead of the shoe. Therefore the peak traction force measured will also be dependent on the ploughing traction force required to overcome this.
P
e
a
k
T
ra
ct
io
n
F
o
rce
(
N
)
Figure 9: Linear regression line and upper and lower 95% confidence limits (dashed lines) for the
relationship between Peak Traction Force and Normal Force for the AHC and the dry ACC1 surfaces.
4.1.3 The influence of normal loading on the average dynamic traction force
The AHC surface provides greater dynamic traction during the period of gross sliding, as in agreement with previous studies, showing it is easier to keep sliding on the artificial clay surfaces. During the dynamic period the moisture of the wet clay will lubricate shoe-surface contact and inter-particle contact, reducing its resistance to dynamic shear. With the artificial clay surfaces the dynamic period of sliding can be described as stick-slip.
With the ACC1 and wet ACC2 surfaces, the stick-slip observed may have been partly caused by the continual shearing of different layers of cohered clay particles. The surface is therefore cyclically failing and resisting the shear force generated by the shoe. Stick-slip will have also been caused by the build up of particles ahead of the shoe which would increase the traction force until it had been overcome and the build up would begin again. It was observed that the build up of clay on the ACC1 surface during the dynamic period was greater in dry conditions and this may be because the lubricating effect of the moisture in wet conditions allows the clay particles to slide under the outsole more easily. However, the opposite was true for the sand-based ACC2 surface where the ploughing force required to overcome the large build up of wet sand may explain why the average dynamic traction force is greater in the wet than in the dry. Considering the AHC surface, it can be seen that the adhesive and hysteretic friction components during the dynamic regime remain relatively constant.
4.2 Further technical developments of the test device
The initial findings discussed in this paper show the test device is capable of measuring the development of shoe-surface traction. The better the test device can simulate realistic kinematics and kinetics the more meaningful the findings will be [42]. Currently the device is capable of measuring translational traction. Excessive rotational resistance at the surface interface has also been identified as an injury risk factor in sport. An optimum shoe-surface combination needs to provide a balance of translational traction and rotational traction. The test device may be developed further by allowing and measuring a controlled rotation in the vertical axis.
control into the current system. Electro-pneumatic control valves can be programmed to provide transient force-time profiles that best replicate phases of typical movements.
5. Conclusions
The infill particle size used in an artificial clay surface will significantly influence the traction developed at the shoe surface interface. Clay particles will bond in wet and dry conditions and the initial stiffness and peak traction will be dependent on the normal force applied to the surface by the shoe. Larger sand particles will exhibit reduced traction caused by a reduction in shear strength. Surfaces with large sand particles will develop lower traction in dray than in wet conditions as the particles are unable to cohere and therefore act as single entities. In dry conditions and under increased normal loading, the traction developed at the shoe-surface interface on an artificial clay surface may be greater than an acrylic hard court surface.
References:
1. Frederick, EC. Kinematically Mediated Effects of Sport Shoe Design: A Review. Journal of Sports Sciences, 1986. 4: 169-184.
2. Reinschmidt C and Nigg BM. Current issues in the design of running and court shoes. Sportverletzung-Sportschaden, 2000. 14(3): 71-81.
3. Milburn PD and Barry EB. Shoe-surface interaction and the reduction of injury in rugby union. Sports Medicine, 1998. 25(5): 319-327.
4. Biener K and Caluori P. Tennissportunfälle (tennis injuries). Med. Klinik, 1977. 72: p. 754-757. 5. Perkins PJ. Measurement of slip between the shoe and ground during walking. 1978,
Philadelphia, PA, ETATS-UNIS: American Society for Testing and Materials. 17.
6. Nigg B. Injury and performance on tennis surfaces. The effect of tennis surfaces on the game of tennis. 2003. http://es.hartru.com.planitapps.com/uploads/downloads/Doc_7.pdf [cited 2012 26th September].
7. Hutchison MR, Laprade RF, Burnett, QM, et al. Injury surveillance at the USTA Boys' Tennis Championships: a 6-yr study. Medicine & Science in Sports & Exercise, 1995. 27(6): 826-830. 8. Nigg BM and Segesser B. The Influence of Playing Surfaces on the Load on the Locomotor
System and on Football and Tennis Injuries. Sports Medicine, 1988. 5(6): 375-385. 9. Kulund DN, McCue FC, Rockwell DA, et al. Tennis injuries: prevention and treatment.
American J Sports Med, 1979. 7(4): 249-253.
10. von Salis-Soglio G. Sportverletzungen and Sportschäden beim Tennis (sport injuries in tennis).
Deutsche Zeitschrift fϋr Sportmedizin, 1979. 8: 244-247.
11. Dixon SJ, Batt ME, and Collop AC. Artificial playing surfaces research: A review of medical, engineering and biomechanical aspects. International Journal of Sports Medicine, 1999. 20(4): 209-218.
12. Wannop JW, Worobets JT, and Stefanyshyn DJ. Footwear Traction and Lower Extremity Joint Loading. The American Journal of Sports Medicine, 2010. 38(6): 1221-1228.
13. Severn KA, Fleming P, Clarke JD, et al. Science of synthetic turf surfaces: A comparison of traction test methods, in Science, Technology and Research into Sport Surfaces. 2010: Loughborough, U.K.
15. Gronqvist R, Hirvonen M, and Tohv A. Evaluation of three portable floor slipperiness testers. International Journal of Industrial Ergonomics, 1999. 25(1): 85-95.
16. Gronqvist R, Hirvonen M, Rajamaki E, et al. The validity and reliability of a portable slip meter for determining floor slipperiness during simulated heel strike. Accident Analysis and
Prevention, 2003. 35(2): 211-225.
17. Marpet M. Comparison of walkway-safety tribometers. Journal of Testing and Evaluation, 1996. 24(4): p. 245-254.
18. Ricotti R, Delucchi M, and Cerisola G, A comparison of results from portable and laboratory floor slipperiness testers. International Journal of Industrial Ergonomics, 2009. 39(2): 353-357.
19. Hallas K and Shaw R, Evaluation of the Kirchberg rolling slider and slipalert slip resistance meters. 2006, Health and Safety Laboratory.
20. Powers CM, Brault JR, Stefanou MA, et al. Assessment of walkway tribometer readings in evaluating slip resistance: A gait-based approach. Journal of Forensic Sciences, 2007. 52(2): 400-405.
21. Siegmund GP, Heiden TL, Sanderson DJ, et al. The effect of subject awareness and prior slip experience on tribometer-based predictions of slip probability. Gait & Posture, 2006. 24(1): 110-119.
22. Lewis R, Carré MJ, Abu Kasim A, et al. A comparison of pendulum heel slip simulation with actual foot friction measurements., in International Conference on slips, trips and falls, HSL, 2011: Buxton, UK.
23. Damm L, Low D, Richardson A, et al. Modulation of tennis players’ frictional demand according to surface traction characteristics in International Society of Biomechanics Congress XXIII. 2011. Brussells.
24. Stiles VH and Dixon SJ, The influence of different playing surfaces on the biomechanics of a tennis running forehand foot plant. Journal of Applied Biomechanics, 2006. 22(1): 14-24. 25. Persson BNJ. Theory of rubber friction and contact mechanics. Journal of Chemical Physics,
2001. 115(8): 3840-3861.
26. Persson BNJ. On the theory of rubber friction. Surface Science, 1998. 401(3): 445-454. 27. Mills R, Dwyer-Joyce RS, and Loo-Morrey M. The mechanisms of pedestrian slip on flooring
contaminated with solid particles. Tribology International, 2009. 42(3): 403-412.
28. Guisasola I, James I, Llewellyn C, et al. Quasi-static mechanical behaviour of soils used for natural turf sports surfaces and stud force prediction. Sports Engineering, 2009. 12(2): 99-109.
29. Guisasola I, James I, Stiles V, et al. Dynamic behaviour of soils used for natural turf sports surfaces. Sports Engineering, 2009. 12(3): 111-122.
30. Palasantzas G. Influence of self-affine roughness on the adhesive friction coefficient of a rubber body sliding on a solid substrate. Surface Science, 2004. 565(2-3): 191-196.
31. Persson BNJ. Rubber friction: role of the flash temperature. Journal of Physics: Condensed Matter, 2006. 18(32): 7789.
32. Nigg BM. External force measurements with sport shoes and playing surfaces. in Proceedings of the international symposium on biomechanical aspects of sport shoes and playing
surfaces. 1983. University of Calgary.
33. Strandberg L and Lanshammar H.The dynamics of slipping accidents. Journal of Occupational Accidents, 1981. 3(3): 153-162.
34. Whittle MW. Generation and attenuation of transient impulsive forces beneath the foot: a review. Gait & Posture, 1999. 10(3): 264-275.
36. Shorten M, Hudson B and Himmelsbach J. Shoe-Surface Traction of Conventional and In-Filled Synthetic Turf Football Surfaces. in XIX Int. Congr. Biomech 2003. New Zealand. 37. Severn KA, Fleming P, Clarke JD, et al. Science of synthetic turf surfaces: investigating
traction behaviour. Proc. IMechE Part P:: Journal of Sports Engineering and Technology, 2011. 225(3): 147-158.
38. Dunn M, Goodwill S, Weat J, et al. Assessing tennis player interactions with tennis courts, in Biomechanics in sports 29. 2011, Portuguese Journal of Sport Sciences. 859 - 862.
39. Wannop J, Luo G, and Stefanyshyn D. Footwear traction at different areas on artificial and natural grass fields. Sports Engineering, 2012. 15(2): 111-116.
40. Persson BNJ. Elastoplastic Contact between Randomly Rough Surfaces. Physical Review Letters, 2001. 87(11): 116101.
41. Orband JLR and Geldart D. Direct measurement of powder cohesion using a torsional device. Powder Technology, 1997. 92(1): 25-33.