R E S E A R C H
Open Access
Obesity is associated with a decrease in
expression but not with the hypermethylation of
thermogenesis-related genes in adipose tissues
Alina Kurylowicz
1*, Marta Jonas
1, Wojciech Lisik
2, Maurycy Jonas
2, Zofia Agnieszka Wicik
1, Zbigniew Wierzbicki
2,
Andrzej Chmura
2and Monika Puzianowska-Kuznicka
1,3*Abstract
Background:Impaired thermogenesis can promote obesity. Therefore, the aim of this study was to investigate whether the expression of thermogenesis-related genes is altered in adipose tissues of obese individuals and whether excessive methylation of their promoters is involved in this phenomenon.
Methods:The expression of genes encodingβadrenergic receptors (ADRBs), thyroid hormone receptors (THRs), 5’-iodothyronine deiodinases (DIOs), and uncoupling proteins (UCPs) was measured by real-time PCR in visceral and in subcutaneous adipose tissues of 58 obese (BMI >40 kg/m2) and 50 slim (BMI 20-24.9 kg/m2) individuals. The methylation status of these genes was studied by the methylation-sensitive digestion/real-time PCR method.
Results:The expression ofADRB2,ADRB3,THRA,THRB,DIO2, UCP2was significantly lower in the adipose tissues of obese patients than in tissues of normal-weight individuals (P < 0.00001). In the obese, the expression ofADRB2, ADRB3,DIO2was lower in visceral adipose tissue than in subcutaneous adipose tissue (P = 0.008, P = 0.002, P = 0.001, respectively). However, the mean methylation of CpG islands of these genes was similar in tissues with their high and low expression, and there was no correlation between the level of expression and the level of methylation.
Conclusions:Decreased expression of thermogenesis-related genes in adipose tissues of obese patients might result in the reduced reactivity to both hormonal and adrenergic stimuli and therefore in a lower potential to activate thermogenesis.
Keywords:Obesity, Adrenergic receptors, Thyroid hormone receptors, 5’-iodothyronine deiodinases, Uncoupling proteins, Methylation
Background
The imbalance between energy intake and expenditure is one of the main causes of obesity [1]. Since most of the currently available non-invasive obesity treatments are ineffective in the long-term, new therapeutic strategies need to be developed to reduce excessive adiposity [2].
In small mammals and in human newborns, non-shivering thermogenesis in brown adipose tissue (BAT) is the most important regulatory mechanism for main-taining body temperature [3]. Functional studies proved
however that BAT cells dispersed within the white adi-pose tissue (WAT), also known as beige/brite adipocytes, co-regulate energy homeostasis and their number in-creases upon exposure to cold also in adult organisms [4,5]. Thermogenic function of brown adipocytes is under strict neurohormonal control. Exposure to cold leads to increased noradrenaline release and subsequent stimulation of various subtypes ofβ-adrenergic receptors (ADRB), leading to the proliferation of brown adipocytes (ADRB1) [6] and activation of lipolysis and/or of thermogenesis (ADRB2 and ADRB3) [7]. While adrener-gic stimulation provides the means for rapid responses, triiodothyronine (T3) increases the capacity of cells to respond to catecholamines [8,9]. Moreover, cold-induced noradrenergic stimulation of brown adipocytes results in
* Correspondence:[email protected];[email protected] 1Department of Human Epigenetics, Mossakowski Medical Research Centre,
Polish Academy of Sciences, 5 Pawinskiego Street, 02-106 Warsaw, Poland
3Department of Geriatrics and Gerontology, Medical Centre of Postgraduate
Education, 99 Marymoncka Street, 01-813 Warsaw, Poland Full list of author information is available at the end of the article
the local activation of the type 2 5’-iodothyronine deiodi-nase (DIO2), which catalyzes conversion of thyroxin (T4) to T3 [10]. Subsequently, T3 acting by its α and β nuclear receptors (TRα and TRβ, respectively) increases the expression of various genes, including the genes for uncoupling proteins (UCP) responsible for dissipation of oxidation energy as heat in BAT’s mitochondria [11,12].
There is mounting evidence that disturbances of thermogenesis-related pathways may play a role in the development of obesity. Early epidemiological studies showed that obese individuals have lower energy ex-penditure; this could be explained by a lower efficiency of adaptive thermogenesis [13]. To verify this hypothesis, a number of animal knock-outs with a selective ablation of various thermogenesis-related genes were created; however, results of these studies were ambiguous and underlined the complexity of mechanisms controlling thermogenesis [14-18]. Studies concerning the use of various activators of thermogenesis in the treatment of obesity were also performed, and a number of novel thermogenic compounds are currently being studied, such as synthetic and selective thyroid hormone receptor orβ-adrenergic receptor agonists [19].
In recent years, epigenetic modifications, activated via
environmental stimuli, has been found to be an important mechanism regulating the gene expression in adipocytes. For example, it was shown that in mouse pre-adipocytes, a high-fat diet promotes methylation of the peroxisome proliferator-activated receptor γ (PPARG) promoter and this may contribute to the pathogenesis of obesity and of the metabolic syndrome [20]. Diet deficient in methyl group donors and methionine-homocysteine cycle co-factors (e.g. folate, methionine, choline, betaine) reduces methylation and up-regulates the expression of genes in-volved in free fatty acids uptake and in synthesis of triglyc-erides, promoting fatty-liver disease and, presumably, obesity [21]. In human adipose tissue, even moderate cal-orie restriction decreases methylation of the cholesterol ester transfer protein gene resulting in its higher expres-sion; this facilitates lipid transport to cellular sites where hydrolytic enzymes are active [22]. Therefore, it is plausible that epigenetic modifications regulate the equilibrium between the environment and the activity of thermogenesis-related genes. This is supported by the results of animal studies showing that the expres-sion of these genes depends on environmental factors such as diet or exposure to cold (14-17).
So far little is known about the physiological changes in thermogenesis-related pathways in adipose tissue of obese humans, and such knowledge would constitute a crucial link between the in vitro experiments and pharmaco-logical studies. In this work we show that the expression of several thermogenesis-related genes is lower in adipose tissues originating from obese individuals than in tissues
of non-obese study participants, and that the level of ex-pression of these genes is probably not related to the methylation status of their promoters.
Methods Adipose tissue
One hundred sixteen samples of visceral (VAT) and sub-cutaneous (SAT) adipose tissues were obtained from 58 obese patients (body mass index (BMI) calculated as weight (kg) divided by height squared (m2), >40 kg/m2) during bariatric surgery. Fifty control tissues were col-lected from normal-weight patients (BMI 20-24.9 kg/m2) undergoing elective cholecystectomy (VAT, N = 22) or operated on for inguinal hernia (SAT N = 28). After col-lection, the samples were immediately frozen in liquid nitrogen and stored at -80°C. The project was approved by the Bioethics Committee of the Medical University of Warsaw (decision KB/47/2009), and a written informed consent for participation in this study was obtained from all participants.
Basic biochemical parameters
Basic biochemical and hormonal parameters in serum/ plasma of obese individuals were measured in the diag-nostic laboratory of the Infant Jesus Teaching Hospital of the Medical University of Warsaw, according to a routine procedure.
Nucleic acids isolation, reverse transcription and real-time PCR
Approximately 500 mg of each tissue was homogenized in liquid nitrogen and total RNA and DNA were extracted with TRIzol Reagent (Invitrogen, Carlsbad, CA, USA) ac-cording to the manufacturer’s procedure. One hundred nanograms of each RNA was used for reverse transcrip-tion performed with RevertAid First Strand cDNA Syn-thesis Kit (Fermentas, Vilnius, Lituania) according to the manufacturer’s protocol. The resulting cDNA was diluted in RNAse-free dH2O (Invitrogen, Carlsbad, CA, USA).
Methylation analysis
Analysis of methylation was performed with the One-Step qMethyl Kit (Zymo Research, Irvine, CA, USA) ac-cording to the manufacturer’s protocol. The tested DNA was divided into a “test reaction” and a“reference reac-tion”. Each sample contained 20 ng of the genomic DNA, 10 μl of 2x Test/Reference Reaction Premix and 1 μl of 10μM solution of the primers (Additional file 2: Table S2). The test sample was then digested with a mix of methylation sensitive restriction enzymes (AccII,
HpaII, HpyCHIV4) at 37°C for 2 hours, while the refer-ence sample was not. Subsequently, the DNA from both samples was amplified in the LightCycler 480 Instru-ment II in the presence of SYTO® 9 fluorescent dye and then quantified. The PCR conditions were as follows: de-naturation at 95°C for 10 min, 45 cycles of 95°C for 30 s, 62-64°C for 60 s, 72°C for 60 s, and then one melting curve cycle. All measurements were performed in dupli-cate. Along with the patients’samples, Human Methyl-ated & Non-methylMethyl-ated DNA Standards provided by the manufacturer were also tested in order to validate the quality of the reactions. The methylation level of the amplified region was determined using the following equation: percent methylation = 100 × 2-ΔCt, where ΔCt is the average Ct value from the test reaction minus the average Ct value from the reference reaction.
Statistical analysis
The differences in mRNA expression were assessed with the Statistica software package v.10 (StatSoft, Tulsa, OK) using the Student’s t/Mann-Whitney U test or Kruskal-Wallis analysis of variance. All correlations between quantitative values were performed with the Spearman correlation test. Normality of distribution and homogen-eity of the variance were checked with the Shapiro-Wilk and Levene’s tests, respectively. To minimize false posi-tives, the Bonferroni correction for multiple testing was ap-plied and the level of significance was established at 0.01.
Results Studied groups
[image:3.595.57.542.437.716.2]The group of obese individuals consisted of 49 females and 9 males. Their basic clinical characteristics, bio-chemical parameters and thyroid status are summarized in Table 1. The metabolic syndrome was diagnosed in 48 (82.7%) on the basis of the International Diabetes Feder-ation criteria for the Europeans [www.idf.org]. All pa-tients suffering from type 2 diabetes mellitus and with a glomerular filtration rate (GFR) ≥60 ml/min were treated with metformin or with a combination of metformin and sulphonylureas, while individuals with GFR <60 ml/min were treated only with sulphonylureas. Patients with hypertension received at least one antihypertensive drug
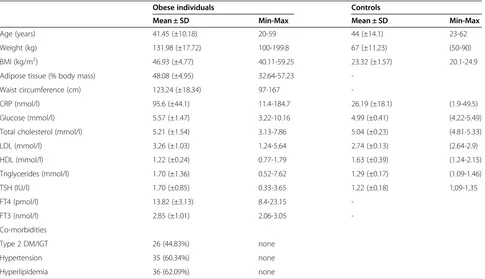
Table 1 Selected clinical and biochemical parameters of study participants
Obese individuals Controls
Mean ± SD Min-Max Mean ± SD Min-Max
Age (years) 41.45 (±10.18) 20-59 44 (±14.1) 23-62
Weight (kg) 131.98 (±17.72) 100-199.8 67 (±11.23) (50-90)
BMI (kg/m2) 46.93 (±4.77) 40.11-59.25 23.32 (±1.57) 20.1-24.9
Adipose tissue (% body mass) 48.08 (±4.95) 32.64-57.23
-Waist circumference (cm) 123.24 (±18.34) 97-167
-CRP (nmol/l) 95.6 (±44.1) 11.4-184.7 26.19 (±18.1) (1.9-49.5)
Glucose (mmol/l) 5.57 (±1.47) 3.22-10.16 4.99 (±0.41) (4.22-5.49)
Total cholesterol (mmol/l) 5.21 (±1.54) 3.13-7.86 5.04 (±0.23) (4.81-5.33)
LDL (mmol/l) 3.26 (±1.03) 1.24-5.64 2.74 (±0.13) (2.64-2.9)
HDL (mmol/l) 1.22 (±0.24) 0.77-1.79 1.63 (±0.39) (1.24-2.15)
Triglycerides (mmol/l) 1.70 (±1.36) 0.52-7.62 1.29 (±0.17) (1.09-1.46)
TSH (IU/l) 1.70 (±0.85) 0.33-3.65 1.22 (±0.18) 1,09-1,35
FT4 (pmol/l) 13.82 (±3.13) 8.4-23.15
-FT3 (nmol/l) 2.85 (±1.01) 2.06-3.05
-Co-morbidities
Type 2 DM/IGT 26 (44.83%) none
Hypertension 35 (60.34%) none
Hyperlipidemia 36 (62.09%) none
BMI: body mass index calculated as weight (kg) divided by height squared (m2
(angiotensin-converting enzyme inhibitor, angiotensin II receptor antagonist, diuretic, calcium channel blocker, or
β-blocker). Individuals diagnosed with hyperlipidemia received statins or fibrates. All patients were euthyroid.
The control group consisted of 40 females and 10 males. Apart from cholelithiasis or inguinal hernia, they had no history of any chronic disease, including compo-nents of the metabolic syndrome and thyroid diseases. Their normal health status was confirmed by physical examination and blood tests (Table 1). Although their adipose tissue content was not calculated, based on their medical history, BMI values and biochemical parameters, they were considered to be metabolically healthy.
A detailed dietary questionnaire was not obtained from our study subjects; however, calculations based on the typical menus showed that in obese individuals the average daily calorie intake exceeded energy demand by at least 1000-1500 kcal in women and by 1500-2000 kcal in men. All obese individuals led a sedentary lifestyle.
Expression of thermogenesis-related genes in adipose tissues from obese and from slim individuals
Ten genes were included into the study:ADRB1,ADRB2
and ADRB3 encoding adrenergic receptors β1, β2 and
β3, DIO1 and DIO2 encoding type 1 and type 2 5’ -iodothyronine deiodinases, THRA and THRB encoding thyroid hormone receptors α and β, and UCP1, UCP2,
UCP3 encoding uncoupling proteins 1, 2 and 3. Initial analysis showed that the mean expressions of these genes did not differ in adipose tissues of males and fe-males; therefore, all analyses were performed for both sexes together.
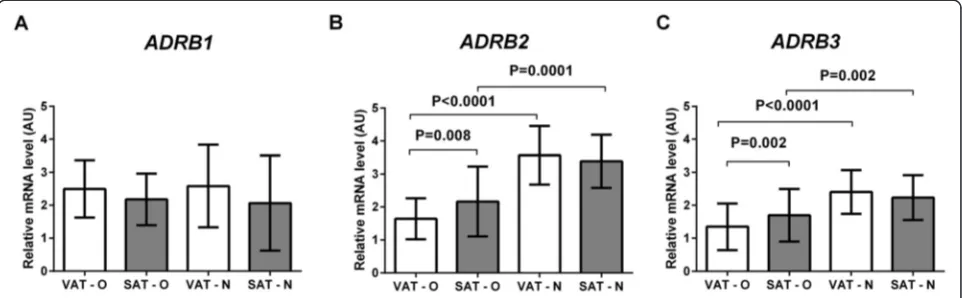
Analysis of the expression of ADRB2 (Figure 1B) and
ADRB3 (Figure 1C) showed that their mean mRNA levels were significantly lower in adipose tissues of obese patients than in the tissues of normal-weight controls (P < 0.00001 and P < 0.00001), both in VAT (P < 0.0001
for both) and in SAT (P = 0.0001 and P = 0.002, respect-ively). Furthermore, in obese patients the mean expres-sion of ADRB2 and ADRB3 was significantly lower in VAT than in SAT (P = 0.008 and P = 0.002, respectively), while in normal-weight individuals no difference be-tween VAT and SAT was detected. The expression of
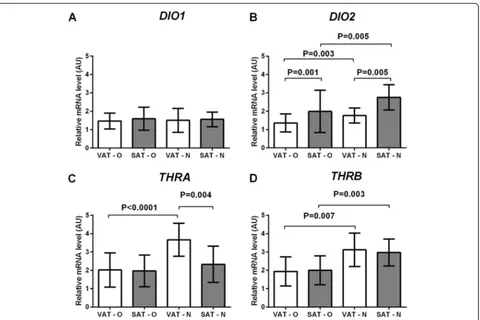
ADRB1was similar in all examined tissues (Figure 1A). The mean expression of DIO2(Figure 2B) was signifi-cantly lower in adipose tissues of obese patients than in the control group (P < 0.0001), and the difference concerned both VAT (P = 0.003) and SAT (P = 0.005). In obese patients, the mean DIO2 expression was signifi-cantly lower in VAT than in SAT (P = 0.001) and a simi-lar observation was made in normal-weight individuals (P = 0.005). No differences in theDIO1 expression were observed in the investigated tissues (Figure 2A). The mean expression ofTHRA (Figure 2C) was significantly lower in adipose tissues of obese patients than in those of normal-weight individuals (P < 0.0001), but the differ-ence was detected only in VAT (P < 0.0001). In addition, in obese patients the expression ofTHRA was similar in VAT and SAT, while in normal-weight individuals it was higher in VAT than in SAT (P = 0.004). The mean ex-pression ofTHRB (Figure 2D) was significantly lower in adipose tissues of obese patients than of normal-weight individuals (P < 0.0001), and the difference concerned both VAT (P = 0.007) and SAT (P = 0.003). The THRB
expression was similar in VAT and SAT of obese pa-tients. It was also similar in both adipose tissue subtypes of normal-weight individuals.
[image:4.595.58.539.548.697.2]The mean expression ofUCP2(Figure 3B) was signifi-cantly lower in adipose tissues of obese patients than in normal-weight individuals (P < 0.0001), and the differ-ence was noted in both VAT (P = 0.002) and SAT (P = 0.009). TheUCP2 expression did not differ between VAT and SAT of obese patients and between VAT and SAT of normal-weight individuals. The analysis ofUCP1
and UCP3 showed no significant differences in their mean mRNA levels between the investigated tissues (Figures 3A, 3C).
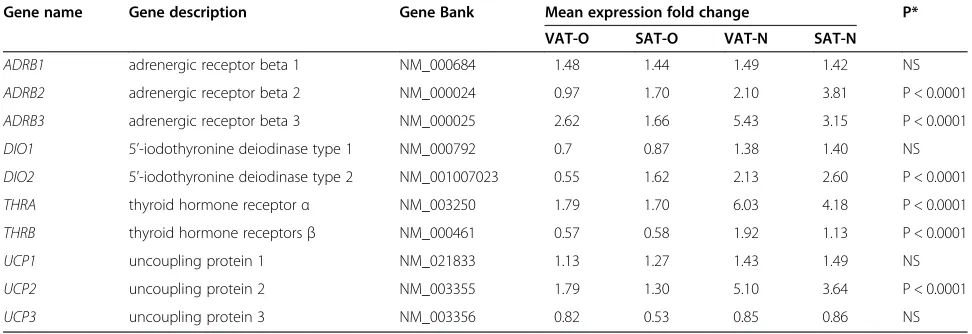
Alternative analysis using the expression FC (Table 2) confirmed the described above differences described above in the ADRB2, ADRB3, DIO2,THRA,THRB and
UCP2mRNA levels.
The experiments were performed on the whole adi-pose tissue homogenates. However, the finding that the mean expression of two BAT-specific genes, UCP1 and
[image:5.595.60.540.87.407.2]PPARG (Figure 3 and Additional file 3: Figure S1), was similar in all analyzed tissues, implies that the differ-ences in the expression of thermogenesis-related genes were not due to a different content of beige adipocytes.
Figure 2Comparison of the expression ofDIO1(A),DIO2(B),THRA(C), andTHRB(D) genes in the visceral (VAT) and subcutaneous (SAT) adipose tissues of obese (O) and normal-weight (N) individuals.Results, normalized against the expression ofACTB, are shown as the mean ± standard deviation.
[image:5.595.58.538.555.697.2]Correlation between the expression of thermogenesis-related genes from adipose tissues of obese individuals and clinical, biochemical as well as hormonal parameters The expression levels of the investigated genes were corre-lated with basic clinical (BMI, percentage of the adipose tissue, waist circumference), biochemical (fasting serum glucose, total cholesterol, low density lipoproteins, high density lipoproteins, triglycerides and C-reactive protein concentrations), as well as hormonal (thyroid stimulating hormone, free thyroxin, free triiodothyronine) parameters. No significant correlations were found.
Methylation of the regulatory regions of thermogenesis-related genes in adipose tissues
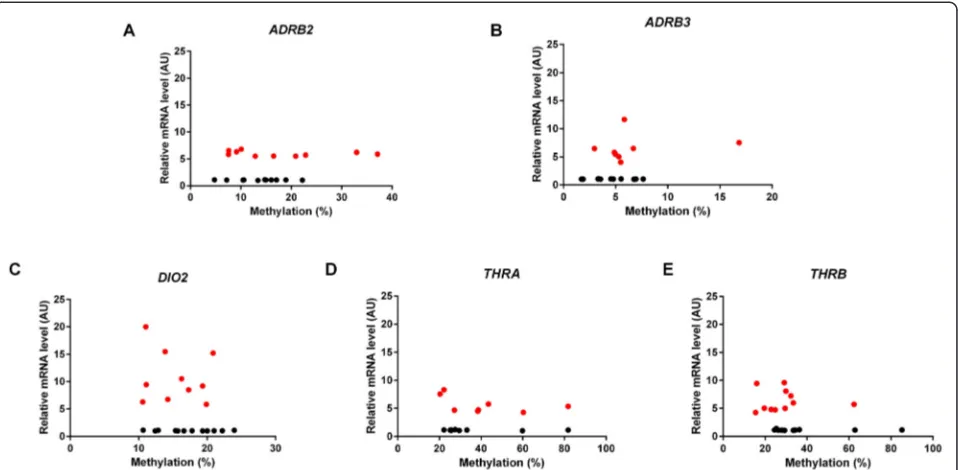
The analysis of the methylation status of genes of inter-est was preceded by anin silicoanalysis of their regula-tory regions with the CpG Islands Searcher (www. cpgislands.com) and CpG Plot (http://www.ebi.ac.uk). In five out of six genes with expression levels significantly different in obese and slim individuals, namely in
ADRB2, ADRB3,THRA,THRB, and DIO2, the analysis revealed the presence of CpG islands in their promoters. Subsequently, 22 DNA samples for each gene, 11 repre-senting tissues with a low, and 11 reprerepre-senting tissues with a high expression of this gene were used for methy-lation analysis. The mean level of methymethy-lation in tissues with a low expression was similar to the level of methy-lation in tissues with a high expression of each of these genes. There was no correlation between the levels of expression and methylation (Figure 4). In addition, the mean level of methylation of each gene was similar in VAT and SAT. Finally, the mean levels of methylation of the genes of interest were similar in obese and slim patients; however, the number of tissues from slim
patients was only 5 and the statistical power of this ana-lysis was low.
Discussion
In this work we show that the mean expression of sev-eral thermogenesis-related genes is significantly lower in adipose tissues originating from obese patients than in tissues from lean individuals. We also suggest that this phenomenon is probably not associated with differential methylation of their promoters.
The genes investigated in the present study formed three groups. The first consisted of genes encoding β -adrenergic receptors. Both ADRB2 and ADRB3 play an important role in the regulation of lipolysis in human BAT and WAT that provides free fatty acids for thermo-genesis. There is indirect evidence that ADRB2 and ADRB3 might participate in the regulation of body weight in humans. For example, their established poly-morphisms, e.g. Glu27 variant ofADRB2or 64Arg vari-ant ofADRB3, both characterized by a reduced receptor activity were associated with metabolic complications and with weight gain in different populations [23-26]. Individuals with a low ADRB3 function in adipose tissue (assessed by its lipolytic activity) tend to increase their body weight over time, whereas a high receptor function seems to protect from weight gain [27]. These data, to-gether with the results from animal studies showing that mice with betaadrenergic receptors knock-outs have re-duced metabolic rate and developed massive obesity due to a failure of diet-induced thermogenesis [15] suggest that an unaffected function of ADRB2 and ADRB3 is crucial for thermogenesis and lipolysis in adipose tissue. However, we found that the expression of ADRB2 and
[image:6.595.55.541.112.279.2]ADRB3 encoding these receptors was significantly decreased in adipose tissues of obese subjects. We
Table 2 Mean expression fold changes of thermogenesis-related genes in adipose tissues of obese and normal-weight individuals
Gene name Gene description Gene Bank Mean expression fold change P*
VAT-O SAT-O VAT-N SAT-N
ADRB1 adrenergic receptor beta 1 NM_000684 1.48 1.44 1.49 1.42 NS
ADRB2 adrenergic receptor beta 2 NM_000024 0.97 1.70 2.10 3.81 P < 0.0001
ADRB3 adrenergic receptor beta 3 NM_000025 2.62 1.66 5.43 3.15 P < 0.0001
DIO1 5’-iodothyronine deiodinase type 1 NM_000792 0.7 0.87 1.38 1.40 NS
DIO2 5’-iodothyronine deiodinase type 2 NM_001007023 0.55 1.62 2.13 2.60 P < 0.0001
THRA thyroid hormone receptorα NM_003250 1.79 1.70 6.03 4.18 P < 0.0001
THRB thyroid hormone receptorsβ NM_000461 0.57 0.58 1.92 1.13 P < 0.0001
UCP1 uncoupling protein 1 NM_021833 1.13 1.27 1.43 1.49 NS
UCP2 uncoupling protein 2 NM_003355 1.79 1.30 5.10 3.64 P < 0.0001
UCP3 uncoupling protein 3 NM_003356 0.82 0.53 0.85 0.86 NS
*P values calculated with the Kruskal-Wallis analysis of variance.
hypothesize that this phenomenon may contribute to the development of obesity and speculate that this might result in a lower effectiveness of receptor-stimulating compounds in the treatment of this condition. Notably, we did not observe differences in the ADRB1expression between obese and normal-weight study participants. This finding is consistent with previous data showing no association of polymorphic variants of this gene with body mass in humans, and with the fact that the block-age of ADRB1 did not inhibit cold-induced thermogen-esis in humans [28].
The second analyzed group consisted of genes encod-ing proteins involved in the metabolism (DIOs) and function (TRs) of thyroid hormones, the most important hormones involved in energy production in mitochon-dria. Studies in animals have demonstrated that knock-out of dio2 increased the susceptibility to diet-induced obesity while animals with thra knockout were highly vulnerable to low temperatures due to the complete lack of BAT reactivity to noradrenergic stimulation [14,16]. Genetic studies performed in humans suggested that
functional polymorphisms of DIO2 and THRA that
decrease gene expression and/or protein activity might increase susceptibility to obesity and its complications [29,30]. Low expression of DIO2, THRA, and of THRB
in adipose tissues of obese individuals might then be a mechanism related to the progression of obesity, difficul-ties in weight loss and, supposedly, resistance to the therapies targeting this pathway [31]. This hypothesis is consistent with the finding that obese, clinically euthyr-oid patients commonly have elevated serum levels of free
T3 (FT3) and decreased expression ofTHRA in adipose tissues compared to lean individuals [32]. One can therefore speculate that the reduced expression ofTHRA
andTHRBin adipose tissue of obese individuals changes the phenotype of adipocyte in such way that it becomes partially “resistant” to T3. A decreased expression of
DIO2 resulting in a lower local conversion of T4 to T3 and a decreased intra-cellular concentration of T3 might also contribute to this phenomenon. As a consequence, the level of FT3 in serum increases to cope with the peripheral hormone“resistance”, but this might be insuf-ficient to normalize the disturbed T3-dependent metab-olism in the adipocyte. Notably, we had expected that
DIO1, which is regulated by TRs, would be also under-expressed in the obese, but our study did not confirm these expectations. Moreover, Ortega et al. found that the expression and activity of DIO1 are increased in adi-pose tissues of obese individuals of Spanish origin [33], suggesting a minor role for T3 in the regulation ofDIO1
[image:7.595.60.539.89.324.2]expression in adipose tissues of obese individuals. The third group of analyzed genes was composed of genes encoding uncoupling proteins. Since the expres-sion of all of them is activated by T3 [11,34,35], one could expect that in adipose tissues of obese subjects, where the expression of THRA, THRB, and of DIO2 is decreased, allUCPgenes would be under-expressed. We found however that only the expression of UCP2 was decreased. Our data corroborate previous findings in humans showing that obesity, low rates of energy ex-penditure and metabolic complications are linked to cer-tain UCP2 polymorphisms, such as the presence of 3′
UTR Ins variant altering mRNA processing or stability [36,37]. In turn, an unchanged expression of UCP1 and
UCP3suggests that T3 might not be the most important molecule controlling the activity of these genes in adipose tissues of obese subjects. In fact, other, T3-independent mechanisms may play a dominant role. In-deed, some researchers suggest that a chief regulator of
UCP1 in adipose tissue is PPARγcoactivator-1α[38]. In skeletal muscles, the UCP3 expression is up-regulated when long-chain fatty acids delivery exceeds their oxida-tion capacity and MyoD, PPARα and PPARδ transcrip-tion factors co-regulate this process; it has not been tested however if similar mechanisms regulate theUCP3
expression in adipocytes [39].
To date little is known about the differences in thermogenic activity between VAT and SAT. The finding that“beige”adipocytes are present predominantly in hu-man SAT may suggest its dominant role in thermogenesis [40] and support the epidemiological and experimental data indicating that increased subcutaneous fat exerts a lower risk of metabolic complications than visceral fat reviewed in [41]. Our finding that the expression ofDIO2, ADRB2 and ADRB3 in obese subjects was significantly lower in VAT than in SAT might indicate a lower lipolytic and thermogenic potential of VAT, corroborating previous studies.
Out of many mechanisms regulating gene expression in adipose tissue, epigenetic modifications are of special interest. Since diet is the chief factor influencing the maturation and metabolism of adipocytes, as well as epi-genetic modifications, especially methylation of DNA [20-22,42], we decided to investigate if the changes re-garding the expression of thermogenesis-related genes in diet-induced obesity can be related to the methylation status of their regulatory regions [43]. However, we found no differences in methylation between normal-weight and obese subjects, between VAT and SAT, and between tissues with high vs. low expression of a given gene. In addition, the methylation level of the investi-gated genes was not related to the level of their expres-sion. This may be due to a number of phenomena. Firstly, methylation may not be the chief mechanism in-volved in the regulation of activity of these genes in adi-pose tissue. Secondly, the analyzed regions, although carefully chosen, may not be crucial for the regulation of gene activity. Thirdly, we have analyzed only the overall methylation of the promoter fragments, while the differ-ences in methylation of a specific cytosines located within the binding sites for strong transcriptional activa-tors could also be relevant. Therefore, further studies using other analytical methods are needed to clarify whether or not this epigenetic modification is involved in the regulation of the activity of thermogenesis-related genes in adipose tissue in obesity. In addition, newest
data indicate, that drugs often taken by obese individuals can affect epigenetic modifications. For example, it has been demonstrated that metformin might increase [44], while statins might decrease methylation of DNA [45]; this should also be taken into account during data analysis.
Conclusions
To the best of our knowledge, the evidence we present here is the first to show that adipose tissues of obese in-dividuals are characterized by a decreased expression of the key genes involved in the activation of thermogen-esis. On that basis we propose that adipose tissue of obese individuals might be less reactive to both hormo-nal and adrenergic stimuli and, therefore, less likely to activate thermogenesis than in lean subjects.
Additional files
Additional file 1: Table S1.Primers used for the analysis of expression of thermogenesis-related genes.
Additional file 2: Table S2.Primers used for the analysis of methylation status.
Additional file 3: Figure S1.Comparison of the expression ofPPARG gene in the visceral (VAT) and subcutaneous (SAT) adipose tissues of obese (O) and normal-weight (N) individuals. Results, normalized against the expression ofACTB, are shown as the mean ± standard deviation.
Abbreviations
ACTB:Gene encodingβ-actin; ADRB: Adrenergic receptorβ;ADRB1: Gene encoding adrenergic receptorβ1;ADRB2: Gene encoding adrenergic receptorβ2;ADRB3: Gene encoding adrenergic receptorβ3; AU: Arbitrary units; BAT: Brown adipose tissue; BMI: Body mass index; DIO1: Type 1 5’ -iodothyronine deiodinase;DIO1: Gene encoding type 1 5’-iodothyronine deiodinase; DIO2: Type 2 5’-iodothyronine deiodinase;DIO2: Gene encoding type 2 5’-iodothyronine deiodinase; DM: Diabetes mellitus; FT3: Free triiodothyronine; FT4: Free thyroxin; GFR: Glomerular filtration rate; HDL: High density lipoproteins; IGT: Impaired glucose tolerance; LDL: Low density lipoproteins; PPARα: Peroxisome proliferator-activated receptor alpha; PPARδ: Peroxisome proliferator-activated receptor delta; PPARγ: Peroxisome proliferator-activated receptor gamma;PPARG: Gene encoding peroxisome proliferator-activated receptor gamma; SAT: Subcutaneous adipose tissue; TR: Thyroid hormone receptor; TRα: Thyroid hormone receptorα;
TRβ: Thyroid hormone receptorβ; TREs: Thyroid hormone-response elements; TRHA: Gene encoding thyroid hormone receptorα;TRHB: Gene encoding thyroid hormone receptorβ; TSH: Thyroid stimulating hormone; T3: Triiodothyronine; T4: Thyroxin; UCP: Uncoupling protein;UCP1: Gene encoding uncoupling protein 1;UCP2: Gene encoding uncoupling protein 2; UCP3: Gene encoding uncoupling protein 3; VAT: Visceral adipose tissue; WAT: White adipose tissue.
Competing interests
The authors declare that they have no competing interest.
Authors’contributions
Acknowledgements
This work was supported by the Polish Ministry of Science and Higher Education grants NN402 557440 and by the statutory funds from the Mossakowski Medical Research Centre, PAS.
Author details
1Department of Human Epigenetics, Mossakowski Medical Research Centre,
Polish Academy of Sciences, 5 Pawinskiego Street, 02-106 Warsaw, Poland.
2Department of General and Transplantation Surgery, Medical University of
Warsaw, 59 Nowogrodzka Street, 02-005 Warsaw, Poland.3Department of Geriatrics and Gerontology, Medical Centre of Postgraduate Education, 99 Marymoncka Street, 01-813 Warsaw, Poland.
Received: 22 September 2014 Accepted: 14 January 2015
References
1. Guyenet SJ, Schwartz MW. Clinical review: regulation of food intake, energy balance, and body fat mass: implications for the pathogenesis and treatment of obesity. J Clin Endocrinol Metab. 2012;97:745–55. 2. Aronne LJ, Wadden T, Isoldi KK, Woodworth KA. When prevention fails:
obesity treatment strategies. Am J Med. 2009;122(4 Suppl 1):S24–32. 3. Dawkins MJ, Scopes JW. Non-shivering thermogenesis and brown adipose
tissue in the human new-born infant. Nature. 1965;206:201–2.
4. Chechi K, Nedergaard J, Richard D. Brown adipose tissue as an anti-obesity tissue in humans. Obes Rev. 2014;15:92–106.
5. Xue B, Rim JS, Hogan JC, Coulter AA, Koza RA, Kozak LP. Genetic variability affects the development of brown adipocytes in white fat but not in interscapular brown fat. J Lipid Res. 2007;48:41–51.
6. Bukowiecki L, Collet AJ, Follea N, Guay G, Jahjah L. Brown adipose tissue hyperplasia: a fundamental mechanism of adaptation to cold and hyperphagia. Am J Physiol. 1982;242:E353–9.
7. Collins S, Surwit RS. Theβ-adrenergic receptors and the control of adipose tissue metabolism and thermogenesis. Recent Prog Horm Res. 2001;56:309–28.
8. Hellström L, Wahrenberg H, Reynisdottir S, Arner P. Catecholamine-induced adipocyte lipolysis in human hyperthyroidism. J Clin Endocrinol Metab. 1997;82:159–66.
9. Rubio A, Raasmaja A, Silva JE. Thyroid hormone and norepinephrine signaling in brown adipose tissue. II: differential effects of thyroid hormone onβ3-adrenergic receptors in brown and white adipose tissue. Endocrinology. 1995;136:3277–84.
10. de Jesus LA, Carvalho SD, Ribeiro MO, Schneider M, Kim SW, Harney JW, et al. The type 2 iodothyroninedeiodinase is essential for adaptive thermogenesis in brown adipose tissue. J Clin Invest. 2001;108:1379–85. 11. Silva JE. Thermogenic mechanisms and their hormonal regulation. Physiol
Rev. 2006;86:435–64.
12. Silva JE, Bianco SD. Thyroid-adrenergic interactions: physiological and clinical implications. Thyroid. 2008;18:157–65.
13. Braitman LE, Adlin EV, Stanton Jr JL. Obesity and caloric intake: the National Health and Nutrition Examination Survey of 1971–1975 (HANES I). J Chronic Dis. 1985;38:727–32.
14. Marsili A, Aguayo-Mazzucato C, Chen T, Kumar A, Chung M, Lunsford EP, et al. Mice with a targeted deletion of the type 2 deiodinase are insulin re-sistant and susceptible to diet induced obesity. PLoS One. 2011;6:e20832. 15. Bachman ES, Dhillon H, Zhang CY, Cinti S, Bianco AC, Kobilka BK, et al.βAR
signaling required for diet-induced thermogenesis and obesity resistance. Science. 2002;297:843–5.
16. Pelletier P, Gauthier K, Sideleva O, Samarut J, Silva JE. Mice lacking the thyroid hormone receptorαgene spend more energy in thermogenesis, burn more fat, and are less sensitive to high-fat diet-induced obesity. Endocrinology. 2008;149:6471–86.
17. Ukropec J, Anunciado RP, Ravussin Y, Hulver MW, Kozak LP. UCP1-independent thermogenesis in white adipose tissue of cold-acclimated Ucp1-/- mice. J Biol Chem. 2006;281:31894–908.
18. Gong DW, Monemdjou S, Gavrilova O, Leon LR, Marcus-Samuels B, Chou CJ, et al. Lack of obesity and normal response to fasting and thyroid hormone in mice lacking uncoupling protein-3. J Biol Chem. 2000;275:16251–7. 19. Tseng YH, Cypess AM, Kahn CR. Cellular bioenergetics as a target for obesity
therapy. Nat Rev Drug Discov. 2010;9:465–82.
20. Fujiki K, Kano F, Shiota K, Murata M. Expression of the peroxisome proliferator activated receptor gamma gene is regulated by DNA methylation in visceral tissue of mouse. BMC Biol. 2009;7:38.
21. Pogribny IP, Tryndyak VP, Bagnyukova TV, Melnyk S, Montgomery B, Ross SA, et al. Hepatic epigenetic phenotype predetermines individual susceptibility to hepatic steatosis in mice fed a lipogenic methyl-deficient diet. J Hepatol. 2009;51:176–86.
22. Bouchard L, Rabasa-Lhoret R, Faraj M, Lavoie ME, Mill J, Pérusse L, et al. Differential epigenomic and transcriptomic responses in subcutaneous adipose tissue between low and high responders to caloric restriction. Am J Clin Nutr. 2010;91:309–20.
23. Jalba MS, Rhoads GG, Demissie K. Association of codon 16 and codon 27
β2-adrenergic receptor gene polymorphisms with obesity: a meta-analysis. Obesity. 2008;16:2096–106.
24. Mirrakhimov AE, Kerimkulova AS, Lunegova OS, Moldokeeva CB, Zalesskaya YV, Abilova SS, et al. An association between TRP64ARG polymorphism of theβ3 adrenoreceptor gene and some metabolic disturbances. Cardiovasc Diabetol. 2011;10:89.
25. Liu ZQ, Mo W, Huang Q, Zhou HH. Genetic polymorphisms of human
β-adrenergic receptor genes and their association with obesity. Zhong Nan Da Xue Xue Bao Yi Xue Ban. 2007;32:359–67.
26. Masuo K. Roles ofβ2- andβ3-adrenoceptor polymorphisms in hypertension and metabolic syndrome. Int J Hypertens. 2010;2010:1–12.
27. Andersson D, Wahrenberg H, Löfgren P.β3-adrenoceptor function and long-term changes in body weight. Int J Obes. 2009;33:662–8.
28. Wijers SL, Schrauwen P, van Baak MA, Saris WH, van Marken Lichtenbelt WD.
β-adrenergic receptor blockade does not inhibit cold-induced thermogenesis in humans: possible involvement of brown adipose tissue. J Clin Endocrinol Metab. 2001;96:E598–605.
29. Fiorito M, Torrente I, De Cosmo S, Guida V, Colosimo A, Prudente S, et al. Interaction of DIO2 T92A and PPARγ2 P12A polymorphisms in the modulation of metabolic syndrome. Obesity. 2007;15:2889–95. 30. Fernández-Real JM, Corella D, Goumidi L, Mercader JM, Valdés S, Rojo
Martínez G, et al. Thyroid hormone receptor alpha gene variants increase the risk of developing obesity and show gene-diet interactions. Int J Obes (Lond). 2013;37:1499–505.
31. Amorim BS, Ueta CB, Freitas BC, Nassif RJ, Gouveia CH, Christoffolete MA, et al. A TRbeta-selective agonist confers resistance to diet-induced obesity. J Endocrinol. 2009;203:291–9.
32. Nannipieri M, Cecchetti F, Anselmino M, Camastra S, Niccolini P, Lamacchia M, et al. Expression of thyrotropin and thyroid hormone receptors in adipose tissue of patients with morbid obesity and/or type 2 diabetes: effects of weight loss. Int J Obes. 2009;33:1001–6.
33. Ortega FJ, Jílková ZM, Moreno-Navarrete JM, Pavelka S, Rodriguez-Hermosa JI, Kopeck Ygrave J, et al. Type I iodothyronine 5'-deiodinase mRNA and activity is increased in adipose tissue of obese subjects. Int J Obes. 2012;36:320–4. 34. Barbe P, Larrouy D, Boulanger C, Chevillotte E, Viguerie N, Thalamas C, et al.
Triiodothyronine-mediated up-regulation of UCP2 and UCP3 mRNA expression in human skeletal muscle without coordinated induction of mitochondrial respiratory chain genes. FASEB J. 2001;15:13–5.
35. Gjedde S, Gormsen LC, Riis AL, Jørgensen JO, Rungby J, Møller N, et al. Reduced expression of uncoupling protein 2 in adipose tissue in patients with hypothyroidism. J Clin Endocrinol Metab. 2010;95:3537–41. 36. Jia JJ, Zhang X, Ge CR, Jois M. The polymorphisms of UCP2 and UCP3
genes associated with fat metabolism, obesity and diabetes. Obes Rev. 2009;10:519–26.
37. Brondani LA, Assmann TS, de Souza BM, Bouças AP, Canani LH, Crispim D. Meta-analysis reveals the association of common variants in the uncoupling protein (UCP) 1-3 genes with body mass index variability. PLoS One. 2014;9: e96411.
38. Beranger GE, Karbiener M, Bariquissau V, Pisani DF, Scheideler M, Langin D, et al. In vitro brown and“brite”/”beige”adipogenesis: human cellular models and molecular aspects. Biochim Biophys Acta. 1831;2013:905–14. 39. Nedergaard J, Ricquier D, Kozak LP. Uncoupling proteins: current status and
therapeutic prospects. EMBO Rep. 2005;6:917–21.
40. Elabd C, Chiellini C, Carmona M, Galitzky J, Cochet O, Petersen R, et al. Human multipotent adipose-derived stem cells differentiate into functional brown adipocytes. Stem Cells. 2009;27:2753–60.
42. Lim U, Song MA. Dietary and lifestyle factors of DNA methylation. Methods Mol Biol. 2012;863:359–76.
43. Herrera BM, Keildson S, Lindgren CM. Genetics and epigenetics of obesity. Maturitas. 2011;69:41–9.
44. Yan L, Zhou J, Gao Y, Ghazal S, Lu L, Bellone S, et al. Regulation of tumor cell migration and invasion by the H19/let-7 axis is antagonized by metformin-induced DNA methylation. Oncogene. 2014. doi:10.1038/ onc.2014.236. [Epub ahead of print]
45. Kodach LL, Jacobs RJ, Voorneveld PW, Wildenberg ME, Verspaget HW, van Wezel T, et al. Statins augment the chemosensitivity of colorectal cancer cells inducing epigenetic reprogramming and reducing colorectal cancer cell 'stemness' via the bone morphogenetic protein pathway. Gut. 2011;60:1544–53.
Submit your next manuscript to BioMed Central and take full advantage of:
• Convenient online submission
• Thorough peer review
• No space constraints or color figure charges
• Immediate publication on acceptance
• Inclusion in PubMed, CAS, Scopus and Google Scholar
• Research which is freely available for redistribution