This is a repository copy of Evolutionary implications of C3 -C4 intermediates in the grass
Alloteropsis semialata..
White Rose Research Online URL for this paper:
http://eprints.whiterose.ac.uk/96017/
Version: Accepted Version
Article:
Lundgren, M.R., Christin, P.A. orcid.org/0000-0001-6292-8734, Escobar, E.G. et al. (7
more authors) (2016) Evolutionary implications of C3 -C4 intermediates in the grass
Alloteropsis semialata. Plant, Cell and Environment, 39 (9). pp. 1874-1885. ISSN
0140-7791
https://doi.org/10.1111/pce.12665
[email protected] https://eprints.whiterose.ac.uk/ Reuse
Unless indicated otherwise, fulltext items are protected by copyright with all rights reserved. The copyright exception in section 29 of the Copyright, Designs and Patents Act 1988 allows the making of a single copy solely for the purpose of non-commercial research or private study within the limits of fair dealing. The publisher or other rights-holder may allow further reproduction and re-use of this version - refer to the White Rose Research Online record for this item. Where records identify the publisher as the copyright holder, users can verify any specific terms of use on the publisher’s website.
Takedown
If you consider content in White Rose Research Online to be in breach of UK law, please notify us by
Evolutionary implications of C3-C4 intermediates in the grass Alloteropsis semialata
Running title: C3-C4 Alloteropsis semialata
Authors: Marjorie R. Lundgren1*, Pascal-Antoine Christin1, Emmanuel Gonzalez Escobar1, Brad S.
Ripley2, Guillaume Besnard3, Christine M. Long4, Paul W. Hattersley5, Roger P. Ellis6, Richard C.
Leegood1, Colin P. Osborne1
1Department of Animal and Plant Sciences, University of Sheffield, Western Bank, Sheffield S10 2TN,
UK
2 Botany Department, Rhodes University, Grahamstown 6139, South Africa
3 CNRS, UniversitŽ de Toulouse, ENFA, UMR5174 EDB (Laboratoire ƒvolution & DiversitŽ
Biologique), 118 Route de Narbonne, 31062 Toulouse, France
4
Department of Primary Industry and Fisheries, Northern Territory Government, Darwin, NT 0801,
Australia
5School of Chemistry and Biochemistry (honorary research fellow), University of Western Australia,
Crawley, WA 6009, Australia
6PO Box 2461, Beacon Bay, East London 5205, South Africa
*author for correspondence: Marjorie R. Lundgren, email: [email protected];
telephone: +44-114-222-0034; fax: +44-114-222-0002
Statement of authorship: MRL, PAC, and CPO designed the study. MRL generated and analysed
data. EGE and RCL performed the PEPC quantifications. MRL, PAC, BSR, GB, and CPO contributed
plant material. MRL, CL, PWH, and RPE contributed accession collection locations and isotope data.
1
ABSTRACT
C4 photosynthesis is a complex trait resulting from a series of anatomical and biochemical
modifications to the ancestral C3 pathway. It is thought to evolve in a stepwise manner, creating
intermediates with different combinations of C4-like components. Determining the adaptive value of
these components is key to understanding how C4 photosynthesis can gradually assemble through
natural selection. Here, we decompose the photosynthetic phenotypes of numerous individuals of the
grass Alloteropsis semialata, the only species known to include both C3 and C4 genotypes. Analyses of
δ13C, physiology, and leaf anatomy demonstrate for the first time the existence of physiological C3-C4
intermediate individuals in the species. Based on previous phylogenetic analyses, the C3-C4 individuals
are not hybrids between the C3 and C4 genotypes analysed, but instead belong to a distinct genetic
lineage, and might have given rise to C4 descendants. C3 A. semialata, present in colder climates, likely
represents a reversal from a C3-C4 intermediate state, indicating that, unlike C4 photosynthesis,
evolution of the C3-C4 phenotype is not irreversible.
KEYWORD INDEX: C3-C4, C2 metabolism, Alloteropsis semialata, grasses, complex trait,
INTRODUCTION
C4 photosynthesis is a complex trait that requires the accumulation and coordination of several
anatomical and biochemical modifications to the ancestral C3 pathway (Hatch 1987). This suite of
novelties results in an efficient CO2 concentrating mechanism (CCM) that separates CO2 assimilation
and reduction into two compartments, usually mesophyll and bundle sheath cells respectively, to
increase the concentration of CO2 around Rubisco (Hatch & Osmond 1976; von Caemmerer & Furbank
2003). The C4 system consequently minimizes the oxygenation of RuBP and the associated costs of
photorespiration, making it more efficient than plants that lack this complex trait under conditions
where photorespiration would be limiting, such as hot, arid, saline, and/or high light environments.
However, the extra energetic costs of the C4 reactions make C4 plants less competitive in cool and
shady habitats where photorespiration rates are low (Chollet & Ogren 1975; Ehleringer 1978; Bauwe et
al. 2010; Sage et al. 2012; Fernie et al. 2013). These environmental interactions under a low-CO2
atmosphere are thought to have been the selection pressures underlying the independent origins of the
C4 trait in nearly 70 plant lineages across 19 angiosperm families (Sage et al. 1999, 2011; GPWG II
2012).
The evolutionary trajectory from the ancestral C3 state to a derived C4 trait is thought to gradually pass
through a series of intermediate stages, all of which must confer an advantage, or at least little
disadvantage, compared to the previous one (Heckmann et al. 2013; Williams et al. 2013). While the
adaptive significance of many of these intermediate stages is still unclear, the glycine shuttle, or C2
cycle, increases photosynthetic efficiency by recycling photorespired CO2 through a weak
mesophyll-bundle sheath CCM, while also beginning to establish the mesophyll-bundle sheath Calvin cycle and
two-compartment coordination that are characteristic of C4 photosynthesis (Hylton et al. 1988; Sage et al.
2013). Therefore, studies of plants using a C2 cycle, alongside close C3 and C4 relatives, are important
for uncovering the individual steps occurring along these evolutionary transitions and for
understanding their adaptive significance (Christin et al. 2011; Muhaidat et al. 2011; Vogan & Sage
2011).
Naturally occurring plant assemblages that incorporate a high level of photosynthetic diversity are rare,
phenotypically diverse non-C4 populations, presenting remarkable intraspecific photosynthetic
variation (Ellis 1974a, b; Ueno & Sentoku 2006; Lundgren et al. 2015). This diversity makes A.
semialata an ideal system to study the evolutionary relationships between C3 and C4 phenotypes. The
C3 and C4 photosynthetic types of A. semialata have been described in detail (Ellis 1974a, b; Brown
1975; Ellis 1981; Frean et al. 1983a, b; Gibbs Russell 1983). Plants grown under natural climatic
conditions have previously presented typical C3 and C4 phenotypes (Ripley et al. 2007). However, the
leaf anatomy and physiology of plants grown in controlled environments have not always aligned well
with typical C3 and C4 types, to the extent of being described as C3-like and C4-like (Ueno & Sentoku
2006). Moreover, several studies have identified anomalous stable isotope signatures, leaf anatomy,
and gross plant morphology in accessions collected from the wild, pointing to intermediate states
between the two photosynthetic types (Table 1; Ellis 1981; Gibbs Russell 1983; Renvoize 1987;
Hattersley & Watson 1992; Lundgren et al. 2015). Despite this compelling evidence for a gradient of
photosynthetic phenotypes in the species, C3-C4 intermediates have not been clearly demonstrated in A.
semialata. However, this is probably because previous physiological studies were focused on South
African and Australian accessions and did not investigate central African plants, in which most of the
anomalous phenotypes are now known to exist (Table 1).
Here we use accessions from across the speciesÕ range, including material collected from central and
western Africa and Madagascar, as well as South Africa and Australia, to reveal the photosynthetic
variation that exists within A. semialata, testing the hypothesis that there are C3-C4 intermediate forms
within the species (Hattersley & Watson 1992). In doing so, we reveal the first known example of
intraspecific photosynthetic variation that spans C3, C3-C4, and C4 photosynthetic types. We then
decompose the photosynthetic phenotype into its anatomical and physiological components to gain
insights into the gradual accumulation of C4 characters among geographically isolated populations of
the same species complex. Based on the phylogeographic history of the group (Lundgren et al. 2015),
we discuss the possible transitions among distinct photosynthetic types, highlighting the diversity of
MATERIALS AND METHODS
Plant material
This study included 22 accessions of A. semialata from 11 geographic origins spread across the range
of the species (Table 2). The same accessions were analysed by Lundgren et al. (2015). Accessions
from South Africa (MDG, SFD, CRL, EML, JMS, and KWT) and Tanzania (L01 and L04) were
collected as cuttings from the field and established in controlled environment conditions at the
University of Sheffield. Accessions from Australia (AUS), Burkina Faso (BF), and Madagascar (MAJ)
were collected as seeds in the field and germinated under sterile conditions at 30¡C, high light, and
65% RH in a controlled environment plant chamber (Sanyo, Bensenville, IL, USA). Once the field
cuttings became established and the seedlings were mature, plants were maintained under well-watered
conditions at 60% RH, 25/20¡C day/night temperatures, and 500 µmol m-2 s-1 photosynthetic photon
flux density (PPFD) over a 14 hour photoperiod at ambient CO2 concentrations (averaging 374 ppm
over the span of the experiment) in a controlled environment growth chamber (Conviron Ltd,
Winnipeg, Canada) and fertilized once a fortnight with Scotts Evergreen Lawn Food (The Scotts
Company, Surrey, England). All plants were grown in large round plastic pots (sized between one and
four litres to accommodate variation in root material) in potting compost (compost no. 2 and 3; John
Innes Manufacturers Association, Reading, England). The Tanzanian plants were grown in higher
nutrient potting compost (no. 3) to aid re-establishment of the cuttings. To test whether this difference
in soil nutrients influenced the results, the Tanzanian plants were transplanted into the same moderate
soil nutrient compost (no. 2) after the initial set of measurements and re-analysed (see Supplementary
Methods and Results). Between one and four replicate plants were analysed per population (Table 2).
For each plant, leaf physiology was measured first, then the same leaf was immediately sampled for
subsequent carbon isotope discrimination and leaf anatomy analyses, as described below.
Carbon isotope discrimination
Tissue from the centre of the leaf blade was harvested, dried in an oven, and ground to a fine powder,
of which 1-2 mg was analyzed using an ANCA GSL preparation module coupled to a 20Ð20
stable isotope analyzer (PDZ Europa, Cheshire, UK). δ13C signatures are presented as isotopic ratios
grasses that use the C3 pathway range between -31 and -24ä while those that use C4 photosynthesis
range between -16 and -10ä (Smith & Brown 1973).
As carbon isotope composition in plants raised in growth chambers may differ from natural populations
(Farquhar et al. 1989), δ13C signatures were measured on silica-dried leaves collected from the same
population, and often the same plant, growing in the wild, when available (as reported in Lundgren et
al., 2015). To estimate a field δ13C value in accessions lacking equivalent field material (i.e., AUS, BF,
MAJ, and SFD populations), growth chamber δ13C values were adjusted based on the difference (i.e.
-2.8ä) between field (-11.1ä; Ibrahim 2007) and growth chamber (-13.9ä) plants measured on the
MDG population.
Physiology
Leaf physiology measurements were made between two and seven hours into the photoperiod on the
youngest fully expanded leaf of the tallest tiller of each plant using an open gas exchange system,
incorporating an infra-red gas analyzer with leaf chamber fluorometer attachment (6400XT and
LI-6400-40, respectively; LICOR, Lincoln, Nebraska, USA). All light and CO2 response curves were
collected at 27¡C leaf temperature (Tleaf), 250 µmols-1 flow rate, and approximately 70% RH, after
sufficient acclimation to chamber conditions to achieve steady state CO2 and H2O fluxes. Light
response curves were collected at 400 µbar reference CO2 concentration (CO2R) at decreasing PPFD of
2000, 1750, 1500, 1250, 1000, 750, 500, 250, 100, 50, 25, and 0 µmol m-1 s-1 after reaching a steady
state of CO2 uptake at each light level. A/Ci curves were collected under ambient (~21%) and low (2%)
O2 concentrations at light saturation (1600 µmol m-2 s-1 PPFD) after reaching a steady state of CO2
uptake at each CO2R. Measurements were collected at 400, 250, 150, 120, 100, 85, 70, 50, and 35 µbar
CO2R, then a second measurement was collected at 400 µbar CO2Rto confirm no reduction in rate had
been caused by exposure to low Ci (e.g. through Rubisco deactivation), and finally at 600, 800, 1000,
and 1200 µbar CO2R. The subambient portion of the A/Ci curve was repeated for C3 accessions at 150
and 75 µmol m-2 s-1 PPFD, to calculate the CO2 compensation point in the absence of mitochondrial
CO2 release not associated with photorespiration (Γ*) following Laisk (1977). The sub-ambient portion
Light- and CO2-response curves of photosynthesis were analysed following Bellasio et al. (2015) to
generate values for CO2 compensation point (CCP), maximal carboxylation efficiency (CE), CO2
saturated net photosynthesis (Asat), respiration in the light (Rlight), gross assimilation (GA), light
compensation point (LCP), the PPFD that half saturates GA (PPFD50), and maximal quantum yield for
CO2 fixation (ΦCO2). O2 inhibition (OI) was calculated as the difference between CCP derived at
ambient and low O2 concentrations. Intrinsic water use efficiency (iWUE) is calculated as A/gs, both
measured at 400 µbar CO2R and light saturation (1600 µmol m-2 s-1).
To indicate deviation from typical C3 metabolism, 13C discrimination independent of the PDB standard
(Δ13C) is plotted against the ratio of internal to ambient CO2 concentrations (Ci/Ca). Ci/Ca values
collected at growth light levels (500 µmol m-2 s-1 PPFD), 400 µbar CO2R, and 27¡C Tleaf were used.
Δ13C was calculated according to Farquhar et al. (1989), accounting for chamber air in this growth
facility following Llorens et al. (2009), with the assumption that the ambient growth chamber CO2
concentration is approximately 374 µbar (the average value measured in this chamber during the
experiment). The theoretical relationship between Δ13C and Ci/Ca is presented, according to Ubierna &
Farquhar (2014), as:
!
!"! ! !! ! ! ! ! ! !
!!!!
! !
!! !!1
where the fractionation associated with the diffusion through air (a) = 4.4ä, by Rubisco carboxylation
(b) = 27ä, and during photorespiration (f) =12ä. Averaged over the seven C3 accessions, Γ* = 26.5
µmol mol-1 and Ca = 374 µbar. The theoretical relationship is adjusted by +2ä to account for
differences in discrimination measured online (as presented in Ubierna & Farquhar 2014) and in bulk
leaf material (used here).
Leaf anatomy
Tissue samples 3-5 mm in length were collected from the centre of the youngest fully expanded leaf of
each plant, fixed in 4:1 ethanol:acetic acid, and embedded in methacrylate embedding resin (Technovit
7100, Heraeus Kulzer GmbH, Wehrhein, Germany). Embedded leaves were sectioned between 6-8 µm
Blue O (Sigma-Aldrich, St. Louis, MO, USA). Stained leaf sections were photographed using
microscopy imaging software (CellA; Olympus, Hamburg, Germany) and a camera mounted on a
microscope (Olympus DP71 and BX51, respectively. Olympus, Hamburg, Germany). Images were
stitched together (using DoubleTake, Echo One, Frederikssund, Denmark) to reproduce the whole
width of the leaf blade in cross-section.
Anatomical traits were measured along segments of the leaf cross-sections using ImageJ (Schneider et
al. 2012). A single segment was defined as the leaf portion between two 2¡ veins, which are large and
contain metaxylem, while minor veins (e.g. tertiary, quaternary, and quinary veins) lack metaxylem.
Only segments in the middle of the leaf blade were used and those immediately adjacent to the mid-rib
and lateral edges of the cross-section were avoided. The total number of veins per segment, or vein
frequency (VF), was counted and averaged along three segments per leaf. The minimum number of
adjacent mesophyll cells separating vein pairs, or interveinal mesophyll cells (IVMC), was counted for
ten pairs of veins per leaf and averaged. The width of one outer bundle sheath cell (OBS) and one inner
bundle sheath cell (IBS) on both sides of a 2¡ vein were measured and averaged for three 2¡ veins per
leaf. Only bundle sheath cells lying parallel to the leaf surface were chosen to maintain consistency
across samples. To show chloroplast localization in mesophyll and bundle sheath cells, cross-sections
of fresh leaves from a subset of accessions were cut by hand, mounted with distilled H2O, then imaged
as described above.
PEPC content
Nine of the A. semialata genotypes were sampled for PEPC content, alongside maize (C4) and rice (C3)
controls. At the time of sampling, the A. semialata plants were growing under greenhouse conditions
set to a 14-hour photoperiod at 25/20¡C day/night temperatures at 60% RH and ambient light,
augmented by 200 µmol m-2 s-1 when ambient light fell below 1000 µmol m-2 s-1 PPFD during the
photoperiod. Maize and rice plants were grown in controlled growth chambers using a 12-hour (360
µmol m-2 s-1 PPFD, 25/17¡C day/night) and 11-hour (270 µmol m-2 s-1 PPFD, 28/24¡C day/night)
photoperiod, respectively. To assess the assimilatory pathway used by the Tanzanian plants at the time
measured again to calculate CCP and CE, as the slope (CE) and x-intercept (CCP) of the line
connecting the data points.
Mature leaves were harvested at midday and flash-frozen in liquid nitrogen. Leaf tissue (250 mg) was
ground to a fine powder in liquid nitrogen, homogenised in 1 mL chilled 200 mM Bicine-KOH (pH
9.8) and 50 mM dithiothreitol (DTT), and centrifuged at 16,800 g for 5 minutes at 4¡C until
supernatants appeared clear. Protein concentrations of the crude extracts were determined following
Bradford (1976). A 1:1 ratio of crude protein to SDS-solubilisation buffer [100 mM Tris-HCl (pH 6.8),
200 mM DTT, 20% (v/v) glycerol, 4% (w/v) SDS, 0.2% (w/v) bromophenol blue] was boiled at 100¡C
for 5 minutes, immediately cooled on ice, and then stored at -80¡C. Two µg of protein was resolved by
SDS-PAGE using a 4-20% SDS-PAGE gel. After electrophoresis, the proteins were transferred to a
polyvinylidene fluoride (PVDF) blotting membrane using a wet transfer Trans-Blot tank (Bio-Rad,
Hertfordshire, UK). Membranes were blocked for 2 hour in TBS-T [TBS (pH 7.4), 0.2% (v/v) Tween
20] containing 5% (w/v) skimmed milk and 3% (w/v) BSA, then probed with a monoclonal PEPC
antibody raised against PEPC from maize sequences at 1:10,000 dilution. Immunoreactive polypeptides
were visualised using horseradish peroxidase-conjugated anti-mouse IgG secondary antibody
(Sigma-Aldrich, St. Louis, MO, USA) coupled with an enhanced chemiluminescence blotting kit and
Hyperfilm ECL (GE Healthcare, Buckinghamshire, UK). To stain for whole proteins, 10 µg of protein
was analysed by SDS-PAGE and stained overnight with dark incubation using SYPRO Ruby
fluorescence stain (Invitrogen, UK), per manufacturer instructions. Gels were incubated in 10% (v/v)
methanol and 7% (v/v) acetic acid for 30 minutes to remove excess stain, then visualised using a
ChemiDock XRS+ UV transilluminator (Bio-Rad, Hertfordshire, UK).
RESULTS
Carbon isotope discrimination
Carbon isotope discrimination varied substantially among accessions of A. semialata (Table 2),
reflecting the photosynthetic diversity of the species. A previous screening of 298 herbarium samples
showed that all accessions from Asia and Australia had carbon isotopes values in the typical C4 range
-34.1 and -9.3ä) and included 18 individuals with intermediate δ13C signatures (between 23.9 and
-18.6ä; Fig. 1; Lundgren et al. 2015). This geographic pattern is confirmed here. All accessions from
Australia, Burkina Faso, and Madagascar had C4 δ13C signatures (Table 2). South African accessions
were more diverse, with populations in the C4 and non-C4 ranges in plants grown in both the field and
controlled environments (Table 2). The Tanzanian accessions had non-C4δ13C signatures in both field
and growth chamber conditions (Table 2).
Physiology
The gradient of carbon isotope discrimination values present in A. semialata is explained by its diverse
physiology, as CCP, OI, and Asat were negatively, and CE positively, associated with δ13C signatures
according to general linear model tests in R (Fig. 2a-d; version 3.1.1, R Development Core Team
2014). One-way analysis of variance (ANOVA) models performed in R show that accessions with C4
δ13C signatures had the lowest CCP (≤ 18.8 µmol mol-1) and OI (≤ 4.6 µmol mol-1), consistent with
plants that use the C4 photosynthetic pathway and are consequently referred to as such from here
onward (Fig. 2; Tables 2 and 3). Accessions with non-C4 δ13C signatures were more variable. The four
South African populations with the lowest δ13C signatures (≤ -27.8/-27.1, in growth cabinet and field
grown plants, respectively) had the highest CCP (≥ 43.1 µmol mol-1) and OI (≥ 32.1 µmol mol-1),
which is typical of plants that use the C3 pathway and, as such, are called C3 from here onward (Table
2). The Tanzanian plants, however, had intermediate values of CCP (11.6 Ð 25.6 µmol mol-1) and OI
(10.3 Ð 22.7 µmol mol-1), between those measured in C3 and C4 plants, and even overlapped in CCP
with some C4 accessions (Figs 2a-b; Tables 2 and 3). Despite these intermediate and C4-like CCPs, the
Tanzanian plants never had a greater CE than C3 plants (Figs 2d and S1; Tables 2 and 3), and
consistently showed a non-C4δ13C signature (≤ -23.1ä; Table 2).
A/Ci curves of the C3 and Tanzanian accessions were similar to each other (Fig. S1a), indicating
commonalities in basic photosynthetic metabolism, but contrasting with the steep C4 curve that quickly
saturated. At 27¡C, light response curves were similar among the C3, C4, and Tanzanian plants (Fig.
S1b) and, as such, GA, PPFD50, and ΦCO2 did not differ across the species (Table 3). The C3 and
had higher LCP and Rlight than both C3 and C4 plants, but this may result from the different soil
conditions that the Tanzanian plants were growing in at this time, compared to the C3 and C4 plants.
Farquhar et al. (1982) show that Δ13C in C3 plants shows a linear dependence on Ci/Ca (Fig. 2f),
depicting the iWUE-dependence of carbon isotope discrimination. As the stomatal limitation of gas
exchange increases, Ci/Ca decreases and diffusion becomes increasingly important relative to Rubisco
for discrimination against 13C in photosynthesis, which decreases. In modelling Δ13C against Ci/Ca, the
data for C3 and Tanzanian plants align along the theoretical line that reflects the relationship between
these two parameters in C3 plants. However, the data for Tanzanian plants show a lower discrimination
at a given Ci/Ca value than the C3 A. semialata plants (Fig. 2f), indicating that the difference in Δ13C
between these two types cannot simply be explained by differences in Ci/Ca.
Leaf anatomy
Leaf anatomy varied widely across A. semialata accessions, with between two and twelve veins per
segment (VF), a range from one to nine mesophyll cells separating these veins (IVMC), and IBS cells
that were between two-thirds smaller than, and one third larger than, OBS cells (Figs 3 and S2; Table
2). This anatomical variation can also partially explain the gradient of carbon isotope discrimination in
this species (Figs 3a-c and S2). C4 accessions had higher VF (≥ 8), fewer IVMC (≤ 2), and smaller
OBS cell widths (≤ 11.4 µm) than the other accessions (Fig. 3; Tables 2 and 3). In contrast, C3
accessions had the lowest VF (≤ 5), most IVMC (≥ 6), and largest OBS cell widths (≥ 16.0 µm; Figs
3a-c and S2; Tables 2 and 3). The Tanzanian accessions had intermediate VF (5-7), IVMC (4-5), and
OBS cell sizes between those observed in C3 and C4 plants (11.6 Ð 14.4 µm; Figs 3 and S2; Tables 2
and 3). IBS cell size, however, showed a different trend across the δ13C gradient, as the IBS cells of
Tanzanian plants were not intermediate in size but were as large as those measured in C4 plants (Figs
3d and S2; Tables 2 and 3).
Fresh hand-cut cross-sections showed that C4 A. semialata had higher concentrations of chloroplasts in
bundle sheath cells than in the mesophyll (Fig. S3e). As expected, C3 A. semialata had abundant
chloroplasts in the mesophyll; however, they also had a small number of chloroplasts present in the IBS
which is consistent with them being plants using a C2 cycle that run the Calvin cycle in both cell types.
Small numbers of chloroplasts were also observed in the OBS of C3, C4, and Tanzanian accessions
(Fig. S3).
PEPC content
The PEPC immunoblot showed that leaves of the two Tanzanian populations had PEPC in higher
abundance than C3 A. semialata and rice (Fig. 4), which suggests that the Tanzanian plants may be
capable of using a C4 cycle. In fact, the Tanzanian plants had similar PEPC content to C4 A. semialata
and maize (Fig. 4). Of the C4 A. semialata accessions, the Madagascan plant had the most PEPC, while
the Australian and South African accessions had lower PEPC content than maize.
At the time that leaves were sampled for the PEPC assay, the Tanzanian plants showed variable
physiology. While one had an intermediate CCP of 18.1 µmol mol-1, plants from the other population
had C4-like CCP values (4.3 and 1.1 µmol mol-1 in L04 replicates A and B, respectively), but CE
remained low (>0.1 mol m-2 s-1) in all three Tanzanian plants at this time. This suggests that the
Tanzanian plants have variable physiologies despite high PEPC content.
DISCUSSION
C3 and C4 variants of Alloteropsis semialata
The carbon isotope discrimination, physiology, and leaf anatomy of most A. semialata accessions were
largely consistent with those measured in typical C3 and C4 taxa, and consistent with earlier
characterizations of individuals within this species (Ellis 1981; Renvoize 1987; Ueno & Sentoku 2006;
Ibrahim 2007; Ripley et al. 2007; Osborne et al. 2008). We concluded that C3 phenotypes were only
identified in some South African populations, while accessions from Australia, Burkina Faso,
Madagascar, and others from South Africa use C4 photosynthesis (Table 2). However, typical C4 plants
have a CCP below 5 µmol mol-1 (Edwards & Ku 1987), whereas not a single C4 accession in this study
measured below this value and CCP was as high as 18.8 µmol mol-1 in one Madagascan plant. This
suggests that some C4 A. semialata populations may not be strongly optimized for C4 function, being
optimization among C4 accessions. Within the populations mentioned here, δ13C signatures consistently
fell within either C3 or C4 ranges in both field and controlled environment conditions (Table 2),
indicating that the photosynthetic metabolism of these plants is not strongly influenced by the growth
environment, and lending further weight to previous evidence that the C3 and C4 phenotypes of A.
semialata are genetically fixed and not plastic (Ibrahim et al. 2008).
Discovery of C3-C4 intermediates in Alloteropsis semialata
The Tanzanian accessions presented in this study had values of CCP, OI, VF, IVMC, and OBS cell
sizes that were intermediate between those of C3 and C4 plants, and abundant chloroplasts in both
mesophyll and bundle sheath cells, consistent with plants using a C2 cycle (Brown & Hattersley 1989;
Ku et al. 1983). There are three possible explanations for the intermediate CCP values in Tanzanian
accessions: operation of a C2 cycle alone (i.e. Type I C3-C4), operation of a limited C4 acid cycle alone,
or operation of both C2 and limited C4 acid cycles (i.e. Type II C3-C4; Edwards & Ku 1987 or Type II
C2; Sage et al., 2012). Distinguishing between these possibilities is informed by our δ13C results (Table
2) and the relationships between ∆13C and Ci/Ca in A. semialata plants (Fig. 2f). First, Fig. 2f shows
that Tanzanian plants discriminated against 13C less at a given Ci/Ca value compared with C3 plants.
Second, the δ 13C values of Tanzanian plants, in either controlled environment or field grown plants,
are almost consistently higher (less negative) than for C3 A. semialata plants (Table 2). C3-like δ13C
values are often observed in C3-C4 intermediate plants, partially as a result of the incomplete
compartmentalization of photosynthetic enzymes that increases BS leakiness (Monson et al. 1988).
However, by itself, this does not preclude the possibility that these plants have significant C4 acid cycle
activity. Hattersley & Watson (1992) note that modelling by Peisker (1986) and Monson et al. (1988)
suggests that δ13C signatures may not start to shift upward until more than 50% of CO2 is fixed by C4
acids. Together, the differences in stable isotope ratios indicate that there is less discrimination against
13C during photosynthesis in the Tanzanian plants than in C
3 plants, which is likely due to a CO2
concentrating mechanism between mesophyll and IBS cells. However, this CO2 concentrating
mechanism cannot be a C2 cycle alone. If it was, the δ13C values (Table 2) would be lower, and the
values in Fig. 2f higher, for Tanzanian plants than for C3 plants, because intermediate plants using a C2
cycle, but no C4 acid cycle, carry out double discrimination against 13C by Rubisco in mesophyll and
that (i) the photosynthetic carbon metabolism of the Tanzanian accessions is not typically C3, (ii) the
greater discrimination against 13C during photosynthesis arises from some level of direct CO2 fixation
by PEPC in the mesophyll, and (iii) there is integration of at least a weak C4 acid cycle. Despite the
intermediate CCP and OI values, CE in the C3-C4 plants never increased beyond C3 levels, a pattern
that is typical of other C3-C4 intermediate taxa (Ku et al. 1983; Dai et al. 1996). Indeed, studies in C3,
C3-C4, C4-like, and C4 Flaveria show that more than 50% of CO2 may be assimilated via a C4 system
before CE increases to values typically measured in C4 species (Fig. S4; Ku et al. 1983; Dai et al.
1996; Vogan & Sage 2011). These Flaveria studies also show a strong relationship between CCP and
the proportion of CO2 fixed by the C4 cycle (Fig. S4; Ku et al. 1991; Dai et al. 1996; Vogan & Sage
2011), indicating that the reduced CCP measured in the Tanzanian plants may result from an increase
in C4 cycle activity, which can be sustained by the high PEPC content observed in these plants.
If one accepts that a C2 cycle is always present in plants intermediate between C3 and C4, then the
Tanzanian plants have both C2 and limited C4 acid cycle activities, i.e. they are Type II C3-C4
intermediates, that probably fix a minority of CO2 via the C4 system, while the isotopically
intermediate herbarium specimens identified in the literature (Table 1) likely engage more C4 activity
than the accessions measured in this study (Fig. S4; Monson et al. 1988). Thus, populations of A.
semialata clearly exhibit a gradient of photosynthetic phenotypes, possibly encompassing C3, C3-like,
C3-C4 (including C2 cycles with various degrees of C4 cycle activity), C4-like, and C4 states, making it
the most photosynthetically diverse species known.
Evolutionary significance of C3-C4 intermediates within the species complex
Individuals with intermediate phenotypes might be interpreted as hybrids between C3 and C4
individuals. For example, hybrid crosses between C3 and C4 Atriplex congeners produce intermediate
phenotypes (Osmond et al. 1980; Oakley et al. 2014). However, a hybrid origin of C3-C4 plants is not
supported by the genetic data available for A. semialata, as all non-C4 accessions so far sampled form a
clade distinct from C4 accessions in both plastid genome and nuclear rDNA phylogenies (Fig. S5;
Lundgren et al. 2015). In the plastid phylogeny, all C3 populations from South Africa form a
monophyletic group, while the C3-C4 intermediates are placed in one of two other non-C4 groups (Fig.
pattern would suggest that the C3 photosynthetic type present in South Africa results from an
evolutionary reversal from a C3-C4 intermediate type, making the C3 plants that colonized southern
Africa the first documented case of an evolutionary loss of C3-C4 intermediate characters.
The evolutionary history of photosynthetic transitions within Alloteropsis has been discussed by
previous authors, but the data available so far has not been conclusive (Ibrahim et al. 2009; Christin et
al. 2010, 2012). However, the discovery of C3-C4 intermediates here changes this picture. If we accept
that C3 individuals arise from the loss of C3-C4 characters, one of the basal splits within A. semialata
separates C3-C4 and C4 plants, leaving two possible scenarios. Either the ancestor was C4 and some of
the descendants lost C4 characters to reach a C3-C4 state, or this ancestor was C3-C4 and one or more of
the descendants acquired more C4-like characters. These two scenarios cannot be differentiated based
on species relationships (Christin et al. 2010). However, discussion of the adaptive significance of
lateral gene transfers within Alloteropsis raised the suggestion that the genus was initially C3-C4, and
that the C4 phenotype was independently realized on multiple occasions, via the co-option of C4-like
components present in C3-C4 plants (Christin et al. 2012). The presence of C3-C4 intermediates within
the group supports this hypothesis, although comparative analyses of the genetic determinants of C4
phenotypes within the group will be needed to definitively resolve this problem.
Conclusion
By comprehensively investigating carbon isotope discrimination, physiology, and leaf anatomy in
accessions of A. semialata from across its geographic range, we demonstrate for the first time that
C3-C4 intermediates, in addition to genetically fixed C3 and C3-C4 types, exist in this taxon. These
intermediates are not the result of hybrid crosses between the analyzed C3 and C4 genotypes, but form
distinct lineages within A. semialata. The intermediates prosper in wooded savannas of Central Africa,
where the origin of the species is inferred based on phylogeographic analyses. In these deciduous
forests, conditions vary throughout the year in terms of light, temperature and nutrient availability.
These varying conditions might have provided a selective edge to C3-C4 plants (Supplementary
Methods and Results), which would then have constituted a reservoir of genes that could be co-opted to
evolve more C4 phenotypes. On the other hand, some lineages might have lost their C3-C4 characters
scenario, C3-C4 ancestors might have generated C3, C3-C4 and C4 descendants, leading to phenotypes
spanning the C3 to C4 continuum in A. semialata, which constitutes the perfect system to study the
origins of C4 photosynthesis, in terms of genetics, physiology and ecology. The existence of this
variation within a single species of grasses opens new avenues for the study of the intraspecific
dynamics that allow the emergence of new physiological adaptations within plant species of ecological
significance.
ACKNOWLEDGMENTS
This work was funded by a University of Sheffield Prize Scholarship to MRL, a Royal Society
Research Fellowship URF120119 to PAC, and an European Research Council grant
ERC-2014-STG-638333 to PAC. GB is member of the Laboratoire Evolution and DiversitŽ Biologique (EDB) part of
the LABEX entitled TULIP managed by Agence Nationale de la Recherche (ANR-10-LABX-0041).
The authors thank Maria Vorontsova and Martin Xanthos of the Royal Botanical Garden at Kew (K),
Lyn Fish, Catherine Mashau and Erich van Wyk at the South African National Biodiversity Institute
(PRE), Jonathan Gregson at the British Museum of Natural History (BM), Itambo Malombe at the East
African Herbarium (EA), Terry Trinder-Smith at the Bolus Herbarium (BOL), and Anna Monro and
Brendan Lepschi of the Centre for Australian National Biodiversity Research (CANB) for contributing
leaf samples, the Millennium Seed Bank for seed material, Heather Walker of the University of
Sheffield, Faculty of Science biOMICS facility and the lab of Prof. G. Farquhar at ANU, Australia, for
help with the carbon isotope analyses, Alex Phokas for assistance with the whole protein staining, and
Asaph Cousins, Christoph Lehmeier, and Chandra Bellasio for valuable discussions on gas exchange.
REFERENCES
Bauwe H., Hagemann M. & Fernie A.R. (2010) Photorespiration: players, partners and origin. Trends
in Plant Science 15, 330Ð336.
Bellasio C., Beerling D.J. & Griffiths H. (2015) An Excel tool for deriving key photosynthetic
parameters from combined gas exchange and chlorophyll fluorescence: theory and practice.
Plant, Cell & Environment. doi:10.1111/pce.12560.
Bradford M.M. (1976) A rapid and sensitive method for the quantitation of microgram quantities of
protein utilizing the principle of protein dye-binding. Analytical Biochemistry 72, 248Ð254.
Brown W.V. (1975) Variations in anatomy, associations, and origins of Kranz tissue. American
Journal of Botany 62, 395Ð402.
Brown R.H. & Hattersley P.W. (1989). Leaf anatomy of C3-C4 species as related to evolution of C4
photosynthesis. Plant Physiology 91, 1543Ð1550.
Chollet R. & Ogren W.L. (1975) Regulation of photorespiration in C3 and C4 species. The Botanical
Review 41, 137Ð179.
Christin P.A., Freckleton R.P. & Osborne C.P. (2010) Can phylogenetics identify C4 origins and
reversals? Trends in Ecology & Evolution 25, 403Ð409.
Christin P.A., Sage T.L., Edwards E.J., Ogburn R.M., Khoshravesh R. & Sage R.F. (2011) Complex
evolutionary transitions and the significance of C3-C4 intermediate forms of photosynthesis in
Molluginaceae. Evolution 65, 643Ð660.
Christin P.A., Edwards E.J., Besnard G., Boxall S., Gregory R., Kellogg E.A., ..., Osborne C.P. (2012)
Adaptive evolution of C4 photosynthesis through recurrent lateral gene transfer. Current
Dai Z., Ku M.S., Edwards G.E. (1996) Oxygen sensitivity of photosynthesis and
photorespiration in different photosynthetic types in the genus Flaveria. Planta
198, 563Ð571.
Edwards G.E. & Ku M.S.B. (1987) Biochemistry of C3-C4 intermediates. In The Biochemistry of
Plants: a Comprehensive Treatise (eds. M.D. Hatch & N.K. Boardman), vol. 10, pp. 275Ð325.
Academic Press, New York, USA.
Ehleringer J.R. (1978) Implications of quantum yield differences on the distributions of C3 and C4
grasses. Oecologia 31, 255Ð267.
Ellis R.P. (1974a) The significance of the occurrence of both Kranz and non-Kranz leaf anatomy in the
grass species Alloteropsis semialata. South African Journal of Science 70, 169Ð173.
Ellis R.P. (1974b) Anomalous vascular bundle sheath structure in Alloteropsis semialata leaf blades.
Bothalia 11, 273Ð275.
Ellis R.P. (1981) Relevance of comparative leaf anatomy in taxonomic and functional research on the
South African Poaceae. DSc Thesis. University of Pretoria, South Africa.
Farquhar G.D., O'leary M.H. & Berry J.A. (1982). On the relationship between carbon isotope
discrimination and the intercellular carbon dioxide concentration in leaves. Functional Plant
Biology 9 121-137.
Farquhar G.D., Ehleringer J.R. & Hubick K.T. (1989) Carbon isotope discrimination and
photosynthesis. Annual Review of Plant Biology 40, 503Ð537.
Fernie A.R., Bauwe H., Eisenhut M., Florian A., Hanson D.T., Hagemann M., É, Westhoff P. (2013)
Frean M.L., Ariovich D. & Cresswell C.F. (1983a) C3 and C4 photosynthetic and anatomical forms of
Alloteropsis semialata (R. Br.) Hitchcock. II. A comparative investigation of leaf
ultrastructure and distribution of chlorenchyma in the two forms. Annals of Botany 51, 811Ð
821.
Frean M.L., Barrett D.R., Ariovich D., Wolfson M.M. & Cresswell C.F. (1983b) Intraspecific
variability in Alloteropsis semialata (R. Br.) Hitchc. Bothalia 14, 901Ð913.
Gibbs Russell G.E. (1983) The taxonomic position of C3 and C4 Alloteropsis semialata (Poaceae) in
southern Africa. Bothalia 14, 205Ð213.
Grass Phylogeny Working Group II (GPWG II). (2012) New grass phylogeny resolves deep
evolutionary relationships and discovers C4 origins. New Phytologist 193, 304Ð312.
Hatch M.D. (1987) C4 photosynthesis: a unique blend of modified biochemistry, anatomy and
ultrastructure. Biochimica et Biophysica Acta 895, 81Ð106.
Hatch M.D. & Osmond C.B. (1976) Compartmentation and transport in C4 photosynthesis.
Encyclopedia of Plant Physiology 3, 144Ð184.
Hattersley P.W. & Watson L. (1992) Diversification of photosynthesis. In Grass Evolution and
Domestication (ed. G.P. Chapman), pp. 38Ð116. Cambridge University Press, Cambridge,
UK.
Heckmann D., Schulze S., Denton A., Gowik U., Westhoff P., Weber A.P. & Lercher M.J. (2013)
Predicting C4 photosynthesis evolution: modular, individually adaptive steps on a Mount Fuji
Hylton C.M., Rawsthorne S., Smith A.M., Jones D.A. & Woolhouse H.W. (1988) Glycine
decarboxylase is confined to the bundle-sheath cells of leaves of C3-C4 intermediate species.
Planta 175, 452Ð459.
Ibrahim D.G. (2007) The C3 and C4 subspecies of Alloteropsis semialata: phylogenetic relationship and
climatic responses. PhD thesis, University of Sheffield, Sheffield, UK.
Ibrahim D. G., Gilbert M.E., Ripley B.S., & Osborne C. P. (2008) Seasonal differences in
photosynthesis between the C3 and C4 subspecies of Alloteropsis semialata are offset by frost
and drought. Plant, Cell & Environment 31, 1038-1050.
Ibrahim D.G., Burke T., Ripley B.S. & Osborne C.P. (2009) A molecular phylogeny of the genus
Alloteropsis (Panicoideae, Poaceae) suggests an evolutionary reversion from C4 to C3
photosynthesis. Annals of Botany 103, 127Ð136.
Ku M.S., Monson R.K., Littlejohn R.O., Nakamoto H., Fisher D.B. & Edwards G.E. (1983)
Photosynthetic characteristics of C3-C4 intermediate Flaveria species I. Leaf anatomy,
photosynthetic responses to O2 and CO2, and activities of key enzymes in the C3 and C4
pathways. Plant Physiology 71, 944Ð948.
Ku M.S., Wu J., Dai Z., Scott R.A., Chu C. & Edwards G.E. (1991) Photosynthetic and
photorespiratory characteristics of Flaveria species. Plant Physiology 96, 518Ð528.
Laisk A. (1977) [Kinetics of photosynthesis and photorespiration in C3 plants] (in Russian). Nauka
Publishing, Moscow, Russia.
Llorens L., Osborne C.P. & Beerling D.J. (2009) Water-use responses of Ôliving fossilÕconifers to CO2
Lundgren M.R., Besnard G., Ripley B.S., Lehmann C.E.R., Chatelet D.S., Kynast R.G., É, Christin
P.A. (2015)Photosynthetic innovation broadens the niche within a single species.Ecology
Letters 18, 1021-1029.
Monson R.K., Teeri J.A., Ku M.S.B., Gurevitch J., Mets L.J. & Dudley S. (1988) Carbon-isotope
discrimination by leaves of Flaveria species exhibiting different amounts of C3-and C4-cycle
co-function. Planta 174, 145Ð151.
Muhaidat R., Sage T.L., Frohlich M.W., Dengler N.G. & Sage R.F. (2011) Characterization of C3-C4
intermediate species in the genus Heliotropium L. (Boraginaceae): anatomy, ultrastructure and
enzyme activity. Plant, Cell & Environment 10, 1723Ð1736.
Oakley J.C., Sultmanis S., Stinson C.R., Sage T.L. & Sage R.F. (2014) Comparative studies of C3 and
C4 Atriplex hybrids in the genomics era: physiological assessments. Journal of Experimental
Botany 65, 3637Ð3647.
Osborne C.P., Wythe E.J., Ibrahim D.G., Gilbert M.E. & Ripley B.S. (2008) Low temperature effects
on leaf physiology and survivorship in the C3 and C4 subspecies of Alloteropsis semialata.
Journal of Experimental Botany 59, 1743Ð1754.
Osmond C.B., Bjšrkman O. & Anderson D.J. (1980) Physiological Processes in Plant Ecology: Toward
a Synthesis with Atriplex. In Physiological Processes in Plant Ecology, Ecological Studies
vol. 36. Springer-Verlag, Berlin, Germany.
Peisker M. (1986) Models of carbon metabolism in C3-C4 intermediate plants as applied to the
evolution of C4 photosynthesis. Plant, Cell & Environment 9, 627Ð635.
R Development Core Team (2014) R: A Language and Environment for Statistical Computing. R
Foundation for Statistical Computing. Vienna, Austria. ISBN 3-900051-07-0. URL:
Renvoize S.A. (1987) A survey of leaf-blade anatomy in grasses XI. Paniceae. Kew Bulletin 42, 739Ð
768.
Ripley B.S., Gilbert M.E., Ibrahim D.G. & Osborne C.P. (2007) Drought constraints on C4
photosynthesis: stomatal and metabolic limitations in C3 and C4 subspecies of Alloteropsis
semialata. Journal of Experimental Botany 58, 1351Ð1363.
Sage R.F., Li M. & Monson R.K. (1999) The taxonomic distribution of C4 photosynthesis. In C4 Plant
Biology (eds. R.F. Sage & R.K. Monson), pp. 551Ð584. Academic Press, San Diego, USA.
Sage R.F., Christin P.A. & Edwards E.J. (2011) The C4 plant lineages of planet Earth. Journal of
Experimental Botany 62, 3155Ð3169.
Sage R.F., Sage T.L., & Kocacinar, F. (2012) Photorespiration and the evolution of C4 photosynthesis.
Annual Review of Plant Biology 63, 19Ð47.
Sage T.L., Busch F., Johnson D.C., Friesen P.C., Stinson C.R., Stata M., É, Sage RF. (2013) Initial
events during the evolution of C4 photosynthesis in C3 species of Flaveria. Plant Physiology
163, 1266Ð1276.
Schneider C.A., Rasband W.S. & Eliceiri K.W. (2012) NIH Image to ImageJ: 25 years of image
analysis. Nature Methods 9, 671Ð675.
Smith B.S. & Brown W.V. (1973) The Kranz syndrome in the Gramineae as indicated by carbon
isotopic ratios. American Journal of Botany 60, 505Ð513.
Ubierna N. & Farquhar G.D. (2014). Advances in measurements and models of photosynthetic carbon
Ueno O. & Sentoku N. (2006) Comparison of leaf structure and photosynthetic characteristics of C3
and C4 Alloteropsis semialata subspecies. Plant, Cell & Environment 29, 257Ð268.
Vogan P.J. & Sage R.F. (2011) Water-use efficiency and nitrogen-use efficiency of C3-C4 intermediate
species of Flaveria Juss. (Asteraceae). Plant, Cell & Environment 34, 1415Ð1430.
von Caemmerer S. (1989) A model of photosynthetic CO2 assimilation and carbon-isotope
discrimination in leaves of certain C3-C4 intermediates. Planta 178, 463Ð474.
von Caemmerer S. & Hubick K.T. (1989) Short-term carbon-isotope discrimination in C3-C4
intermediate species. Planta 178, 475Ð481.
von Caemmerer S. & Furbank R.T. (2003). The C4 pathway: an efficient CO2 pump. Photosynthesis
Research 77, 191Ð207.
Williams B.P., Johnston I.G., Covshoff S. & Hibberd J.M. (2013) Phenotypic landscape inference
FIGURE CAPTIONS
Figure 1. Photosynthetic variation across A. semialata. Frequency (A) and geographic (B) distributions
of δ13C signatures (ä) from 298 A. semialata accessions. Map points are color coded according to the
color scheme used in the histogram.
Figure 2. Physiological variation in A. semialata.For individual accessions, variations in (A) CO2
compensation point (CCP), (B) oxygen inhibition (OI), (C) CO2 saturated photosynthesis (Asat), and
(D) carboxylation efficiency (CE) are shown across the δ13C gradient. Panel E regresses stomatal
conductance (gs) against net CO2 assimilation (A400), both measured at a reference CO2 concentration
of 400 µbar, to show intrinsic water use efficiency (iWUE). Panel F shows carbon isotope
discrimination (Δ13C) against the ratio of intercellular to ambient CO2 (Ci/Ca), overlaid with the
theoretical relationship for C3 plants (see Materials and Methods). Data points are colored as C3 (blue),
C4 (red), and the Tanzanian plants (green). Linear model adjusted R2 and p-value results are shown,
where relevant.
Figure 3. Anatomical variation in A. semialata. Variation in (A) vein frequency, (B) number of
interveinal mesophyll cells (IVMC), (C) outer bundle sheath (OBS) cell size, and (D) inner bundle
sheath (IBS) cell size. Data points are colored by C3 (blue), C4 (red), and the Tanzanian plants (green).
Linear model adjusted R2 and p-value results are shown.
Figure 4. PEPC content in C3, C3-C4, and C4 A. semialata. (A) Immunoblot indicating relative PEPC
content after 10-s exposure and (B) whole protein staining across nine A. semialata accessions, with
rice (C3) and maize (C4) controls. Along the whole protein stain, PEPC is indicated at 100 kDa.
TABLES
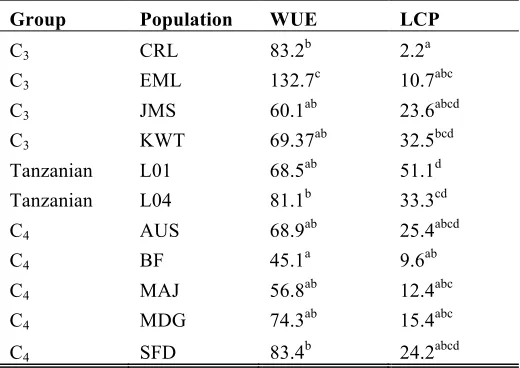
Table 1. Anomalous specimens of A. semialata in the literature.
Table 2. Details of individual accessions and corresponding stable isotope, anatomy and physiology
results.
Table 1. Alloteropsis semialata specimens with anomalous δ13C isotope signatures (I), gross
morphology (M), and/or leaf blade anatomy (A). The country, year of collection, and stable isotope
values are show, where available.
Specimen Country Year δ13C Anomaly Study1
Milne-Redhead 3021 Zambia 1937 -20.0 A -20.7D
-18.5E I
A, D, E
Eyles 1920 Zimbabwe 1919 -10.3 M B
Greenway 6290 Malawi M B
Milne-Redhead 3371 Zambia 1937 -18.6 I, M B
Milne-Redhead & Taylor 8455 Tanzania 1956 -10.7 A C
Astle 1137 Zambia A C
Norval 106 South Africa A C
Rattray 428 Zimbabwe -11.4 A C
Emson 340 Tanzania 1932 -21.4 I D,E
Stowe 495 Zambia 1940 -20.8 I D
Brzotowski 26 Tanzania 1944 -22.6 M, A D
Robinson 4744 Zambia 1961 -22.7 M, A D
Proctor 2165 Tanzania 1962 -23.0 M, A D
Mbano DSM812 Tanzania 1969 -23.9 M, A D
Proctor 2206 Zambia 1962 -23.9 M, A D
Simon 932 Tanzania 1966 -25.3 M, A D
Tanner 5076 Tanzania 1960 -26.3 M, A D
Bogdon & Williams 238 Kenya 1947 -11.8 M, A D
Symoens 14118 DRC 1971 -22.6 I E
Lundgren & Christin 4 Tanzania 2014 -23.1 M, A E
Bullock 1980 Tanzania 1949 -22.3 I E
Bullock 1979 Tanzania 1949 -19.7 I E
Ruffo & Kisena 2806 Tanzania 1987 -18.6 I E
Shaunty 488 Zambia 1919 -20.7 I E
1Studies refer to (A) Ellis (1981); (B) Gibbs Russell (1983); (C) Renvoize (1987); (D) Hattersley &
Table 2. Details of individual accessions and corresponding stable isotope, anatomy and physiology results.
Accession Pop Country Latitude Longitude δ13CF * δ13CC VF IVMC
IBS size (µ)
OBS size
(µ)
CCP
(µmol m-2 s-1)
CE
(mol m-2 s-1) OI Type
CRL-2 CRL South Africa -25.74 30.24 -27.6 -27.8 2.7 5.9 7.1 15.8 57.4 0.11 34.3 C3
CRL-4 CRL South Africa -25.74 30.24 -27.6 -28.3 4.0 7.4 10.7 19.6 54.8 0.10 48.9 C3
EML-11 EML South Africa -26.29 30.00 -27.3 -29.1 3.3 7.2 7.5 16.0 49.5 0.13 39.6 C3
JMS-201 JMS South Africa -33.32 26.44 -28.3 -30.8 4.7 8.6 7.3 18.2 52.8 0.10 37.2 C3
JMS-202 JMS South Africa -33.32 26.44 -28.3 -27.9 4.7 7.7 7.9 17.3 45.4 0.10 32.1 C3
KWT-3 KWT South Africa -32.70 27.53 -27.1 -28.7 4.0 7.8 44.7 0.11 35.2 C3
KWT-5 KWT South Africa -32.70 27.53 -27.1 -33.4 3.3 6.8 7.5 17.3 43.1 0.13 37.0 C3
L01-A L01 Tanzania -5.63 32.69 -26.3 -26.5 5.0 3.5 10.5 13.6 19.4 0.10 17.6 C3-C4
L04-A L04 Tanzania -8.51 35.17 -23.1 -25.3 5.3 5.1 11.6 14.4 24.3 0.09 22.7 C3-C4
L04-B L04 Tanzania -8.51 35.17 -23.9 -25.6 5.3 4.9 11.6 11.6 22.5 0.08 10.3 C3-C4
L04-D L04 Tanzania -8.51 35.17 -26.4 -26.9 5.3 5.4 12.5 13.2 25.6 0.13 19.3 C3-C4
L04-E L04 Tanzania -8.51 35.17 -25.0 -28.3 7.3 4.4 13.0 12.5 11.6 0.12 11.6 C3-C4
AUS-3 AUS Australia -19.62 146.96 -11.5 * -14.3 8.3 1.5 9.5 7.7 11.1 0.15 1.0 C4
AUS-4 AUS Australia -19.62 146.96 -12.5 * -15.3 11.0 1.7 9.4 7.8 5.1 0.36 -4.6 C4
BF-2 BF Burkina Faso 10.85 -4.83 -11.1 * -13.9 11.0 1.4 11.3 8.9 8.5 0.37 4.5 C4
BF-3 BF Burkina Faso 10.85 -4.83 -11.3 * -14.1 11.0 1.6 9.5 8.3 5.2 0.35 1.2 C4
MAJ-1 MAJ Madagascar -15.67 46.37 -11.4 * -14.2 11.7 1.7 9.4 9.2 12.3 0.16 -0.8 C4
MAJ-3 MAJ Madagascar -15.67 46.37 -11.9 * -14.7 9.0 1.9 11.2 11.4 18.8 0.32 2.0 C4
MDG-1 MDG South Africa -25.76 29.47 -11.1 -13.9 11.3 1.5 11.3 9.7 5.6 0.27 -0.6 C4
MDG-2 MDG South Africa -25.76 29.47 -11.1 -13.9 11.7 1.3 12.2 9.9 7.2 0.52 1.6 C4
SFD-1 SFD South Africa -28.39 29.04 -11.3 * -14.1 5.2 0.36 4.6 C4
SFD-3 SFD South Africa -28.39 29.04 -10.9 * -13.7 10.0 1.5 10.9 8.7 8.3 0.62 0.9 C4
* δ13C measured on plants grown under controlled environment (C) or (F) conditions (in ä). For accessions lacking field δ13C data (*), controlled environment values were
Table 3. Results of ANOVAs on physiological and anatomical variables. Accessions were grouped into C3, C4, and the two measurement sets of the Tanzanian plants. Trait
abbreviations can be found in the Methods section. Variables with significant group effects were subjected to post-hoc Tukey tests and groups that differed significantly are
denoted with different letters. Post-hoc Tukey tests for traits with significant population terms are presented in Table S1
Group Population C3 Tanzanian C4
DF F (p-value) F (p-value) MeanTukey
Physiology
CCP 2, 8 187.0 (3.2e-09) 1.8 (0.18) 49.69c 20.68b 8.73a
CE 2, 8 16.5 (4.9e-04) 1.2 (0.40) 0.11a 0.10a 0.35b
OI 2, 8 116.2 (4.0e-08) 0.5 (0.86) 37.73c 16.30b 0.98a
Asat 2, 8 259.4 (0.014) 29.9 (0.66) 26.56ab 32.53b 20.33a
iWUE 2, 8 504.0 (6.6e-03) 11.7 (2.2e-04) 79.72b 78.60b 65.69a
Rlight 2, 8 6.9 (0.01) 2.1 (0.12) 0.92a 2.01b 1.10a
LCP 2, 8 15.5 (6.4e-04) 4.6 (0.01) 18.20a 36.88b 17.41a
GAsat 2, 8 0.1 (0.93) 1.8 (0.19) 18.63 17.82 18.64
PPFD50 2, 8 1.0 (0.40) 1.5 (0.26) 281.42 217.27 217.87
ΦCO2 2, 8 1.0 (0.42) 1.2 (0.40) 0.05 0.06 0.06
Leaf anatomy
VF 2, 8 85.7 (5.1e-07) 0.8 (0.64) 3.81a 5.66b 10.56c
IVMC 2, 8 248.4 (3.0e-09) 1.8 (0.19) 7.34c 4.64b 1.54a
OBS width 2, 8 76.3 (2.3e-06) 0.8 (0.60) 17.34c 13.07b 9.07a
IBS width 2, 8 16.7 (9.4e-04) 1.0 (0.49) 8.00a 11.83b 10.52b
40¼S
20¼S 0¼ 20¼N
40¼N
20¼W 0¼ 20¼E 40¼E 60¼E 80¼E 100¼E 120¼E 140¼E 160¼E
13
F
re
que
nc
y
-30
-25
-20
-15
-10
0
20
40
60
80
(b)
(a)
C
40
10
20
30
40
-35
-30
-25
-20
-15
-10
A
sat(µ
mol
m
-2s
-1)
δ
13C (
0/
00
)
-5
5
15
25
35
45
-35
-30
-25
-20
-15
-10
O
I
(µ
mol
mol
-1)
δ
13C (
0/
00
)
(a)
(b)
R
2=0.78
p=3.7e-08
(c)
(d)
(e)
(f)
R
2=0.31
p=0.004
0
10
20
30
40
50
60
-35
-30
-25
-20
-15
-10
C
C
P
(µ
mol
mol
-1)
δ
13C (
0/
00
)
R
2=67
p=1.9e-06
0.0
0.1
0.2
0.3
0.4
0.5
0.6
0.7
-35
-30
-25
-20
-15
-10
C
E (mol
m
-2
s
-1)
δ
13C (
0/
00
)
R
2=0.57
p=3.2e-05
0
5
10
15
20
25
30
0
0.2
0.4
0.6
A
n et(µ
mol
m
-2s
-1)
g
s(mol m
-2s
-1)
R
2=0.22
p=0.015
0
5
10
15
20
25
30
0
0.2
0.4
0.6
0.8
Δ
13
C
(A)
(B)
(C)
(D)
0
2
4
6
8
10
12
14
-35
-30
-25
-20
-15
-10
ve
in
fr
eq
u
en
cy
0
2
4
6
8
10
-35
-30
-25
-20
-15
-10
IV
M
C
0
5
10
15
20
25
-35
-30
-25
-20
-15
-10
O
BS
w
id
th
(µ
m)
δ
13C (
0/
00
)
0
2
4
6
8
10
12
14
-35
-30
-25
-20
-15
-10
IBS
w
id
th
(µ
m)
δ
13C (
0/
00
)
R
2=0.87
p=6.2e-10
R
2=0.86
p=8.6e-10
R
2=0.80
p=1.0e-07
R
2=0.07
SUPPLEMENTARY INFORMATION
SUPPLEMENTARY METHODS AND RESULTS
Response To Environmental Conditions Rationale and Methods
While the C3 and C4 accessions in this study were grown in moderate nutrient compost (no. 2, John
Innes Manufacturers Association, Reading, England), the Tanzanian plants were initially grown in
higher nutrient potting compost (no. 3, John Innes Manufacturers Association, Reading, England) to
aid re-establishment of the cuttings once they were imported into the UK. To test whether this
difference in soil nutrients influenced the results, the Tanzanian plants were transplanted into the same
moderate soil nutrient compost (no. 2) after the initial set of measurements and re-analysed after three
months. At the end of the three months, stable isotope, physiology, and anatomy data were collected
again on youngest fully expanded leaves that developed in the new soil environment. Isotope and
anatomy methods used on these plants are identical to those described in the main text. However, only
a subset of the physiology dataset was re-measured at this time, including only the sub-ambient CO2R
portion of the A/Ci curve, such that CE and CCP were calculated as the slope (CE) and x-intercept
(CCP) of the line connecting these data points. WUE was calculated as in the main text.
Results
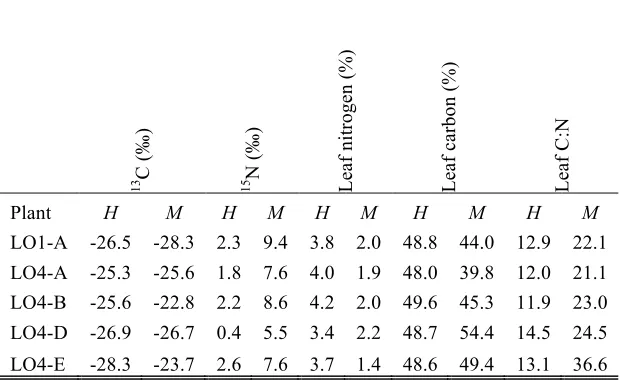
Growing the plants in higher nutrient soils did influence the leaf composition, as the percent of leaf
nitrogen and carbon were greater, and the C:N ratio lower, in the higher soil nutrients compared to the
moderate nutrient grown plants (Table S2). Despite this, the Tanzanian accessions consistently had
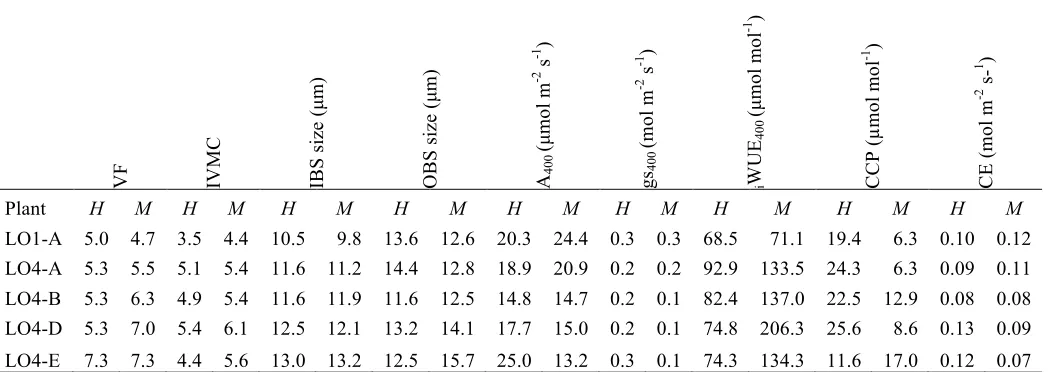
non-C4δ13C signatures (i.e. -28 to -23ä; Tables 2 and S2). It is interesting to note that CCP was no
longer intermediate in these moderate soil nutrient conditions, but instead fell entirely within the range
measure in C4A. semialata (i.e. ≤ 17.0 µmol mol-1; Figs 2a and S6; Tables 3 and S3). However, CE did
not improve under moderate soil nutrients (Fig. S6; Table S3).
DISCUSSION
There is some evidence that the degree of C4-cycle activity is plastic in C3-C4A. semialata plants,
varying temporally or with soil environment. In particular, CCP in the Tanzanian plants was initially
intermediate between C3 and C4 plants. However, when they were re-measured after being transplanted
into lower nutrient soils, their CCP dropped to values similar to those of C4 plants. In fact, CCP in
L01A was initially intermediate in the high nutrient soil (i.e. 19.3 µmol mol-1), then became C4-like in
the moderate nutrient soil (i.e. 6.3 µmol mol-1), then became intermediate again when it was
re-measured at the time of PEPC content leaf analysis (i.e. 18.1 µmol mol-1), suggesting this accession can
alternate back and forth between C3-C4 and C4-like states in response to soil or atmospheric
environments (Fig. S6). WUE also increased when these C3-C4 plants were in a C4-like state (Table
S3). Leaf anatomy, however, did not vary between these two states, suggesting that the anatomical
cell sizes and IVMC of C3-C4A. semialata fall within the range of the values measured across C4 grass
species as a whole (Lundgren et al. 2014). Thus, the observed physiological shift in CCP could result from plasticity in the underlying biochemistry, probably via enhanced C4 cycle activity (e.g. from
approximately 30 to 60%). However, follow-up pulse-chase work is needed to confirm this.
The C2 cycle has been cited as an enabler of C4 photosynthesis that may be a critical step in the
transition from C3 to C4 (Hylton et al 1988; Heckmann et al. 2013; Williams et al. 2013; Mallmann et
al. 2014; Sage et al. 2014). There are however several costs associated with running a C2 cycle. First,
this pathway inherently requires photorespiration to operate and, although photorespiratory CO2 is
recycled, the process still produces toxic by-products, consumes ATP and NADPH, and creates a
cellular imbalance in N-metabolites (Mallmann et al. 2014). Second, establishment of the C2 cycle
requires construction costs to provision bundle sheath organelles and enzymes (Schuster & Monson
1990). Finally, when plants already using a C2 cycle initiate a C4 cycle, the C4 biochemical functions
are often inefficient and increase nitrogen requirements (Monson et al. 1986). This creates nitrogen sinks that offset the advantages gained by recycling photorespired CO2 (Schuster & Monson 1990;
Mallmann et al. 2014). Despite these costs, there are examples of C3-C4 plants that have persisted for
millions of years (Christin et al. 2011), suggesting that the intermediate phenotype may be a better adaptation than the C4 state under certain environmental conditions. Our data point to plasticity for C4
cycle activity within C3-C4 genotypes, and we hypothesize that these intermediate states may maintain
an inherent degree of biochemical flexibility, which allows them to shift between physiological states.
If this is true, then phenotypic plasticity for traits important to photosynthetic efficiency may weaken
selection pressures to fix the C4 syndrome in these plants, maintaining them in an intermediate state.
This could potentially explain the long-term persistence of C3-C4 species in some lineages. Supporting
our hypothesis, high levels of physiological plasticity have been found in other C3-C4 species,
including the species Flaveria linearis, which becomes C4-like when grown in warmer conditions
(Teese 1995). This apparent flexibility to transition between C3-C4 and C4-like states (and perhaps also
between C3-C4 and C3-like states) would enable plants to acclimate their physiology to whichever
environment they are currently experiencing, an ability that would be particularly advantageous in
heterogeneous environments (West-Eberhard 1989).
The C3-C4A. semialata identified here, as well as those isotopically intermediate accessions reported in
the literature (Table 1), were all found in the densely wooded Miombo savannas of central eastern
Africa (Fig. 1; Lundgren et al. 2015). These habitats are characterized by particularly heterogeneous light, precipitation, and soil nutrients. For instance, less than 30% of incident light penetrates a mature
Miombo canopy (van der Meulen & Werger 1984), however these woodlands are dominated by
deciduous tree species that shed their leaves during the dry season (Frost 1996), thereby exposing the
perennial understory vegetation to both shady and full sunlight conditions at different times of the year.
Moreover, these woodlands occupy areas averaging over 700 mm of annual precipitation, yet more
than 95% of this occurs within the 5-7 month rainy season (Frost 1996), requiring Miombo vegetation