HPC Environments
Ole Weidner
School of Informatics University of Edinburgh Edinburgh EH8 9YL, UK [email protected]
Adam Barker
School of Computer Science University of St Andrews St Andrews KY16 9AJ, UK [email protected]
Malcolm Atkinson
School of Informatics University of Edinburgh Edinburgh EH8 9YL, UK [email protected]
ABSTRACT
A large number of2nd generationhigh-performance computing ap-plications and services rely on adaptive and dynamic architectures and execution strategies to run efficiently, resiliently, and at scale on today’s HPC infrastructures. They require information about applications and their environment to steer and optimize execution. We define this information astelemetry data.
Current HPC platforms do not provide the infrastructure, inter-faces and conceptual models to collect, store, analyze, and access such data. Today, applications depend on application and platform specific techniques for collecting telemetry data; introducing signif-icant development overheads that inhibit portability and mobility. The development and adoption of adaptive, context-aware strate-gies is thereby impaired. To facilitate2nd generationapplications, more efficient application development, and swift adoption of adap-tive applications in production, a comprehensive framework for telemetry data management must be provided by future HPC sys-tems and services.
We introduce Seastar, a conceptual model and a software frame-work to collect, store, analyze, and exploit streams of telemetry data generated by HPC systems and their applications. We show how Seastar can be integrated with HPC platform architectures and how it enables common application execution strategies.
CCS CONCEPTS
•Social and professional topics →Centralization / decen-tralization;Software selection and adaptation; •Computer systems organization→ Reliability;
KEYWORDS
HPC platform models; HPC platform APIs; telemetry data manage-ment; context awareness; adaptive applications
ACM Reference format:
Ole Weidner, Adam Barker, and Malcolm Atkinson. 2017. Seastar: A Com-prehensive Framework for Telemetry Data in HPC Environments. In Pro-ceedings of ROSS ’17, Washington, DC, USA, June 27, 2017,8 pages. https://doi.org/http://dx.doi.org/10.1145/3095770.3095775
Permission to make digital or hard copies of all or part of this work for personal or classroom use is granted without fee provided that copies are not made or distributed for profit or commercial advantage and that copies bear this notice and the full citation on the first page. Copyrights for components of this work owned by others than ACM must be honored. Abstracting with credit is permitted. To copy otherwise, or republish, to post on servers or to redistribute to lists, requires prior specific permission and/or a fee. Request permissions from [email protected].
ROSS ’17, June 27, 2017, Washington, DC, USA
© 2017 Association for Computing Machinery. ACM ISBN 978-1-4503-5086-0/17/06. . . $15.00
https://doi.org/http://dx.doi.org/10.1145/3095770.3095775
1
INTRODUCTION
With computational methods, tools and workflows becoming ubiq-uitous in more and more disciplines, the software applications and user communities on HPC platforms are rapidly growing diverse. Many of the 2nd generation HPC applications [22] have moved beyond tightly-coupled, compute-centric methods and algorithms and embrace more heterogeneous, multi-component workflows, which involve adaptive, dynamic, computation and data-centric methodologies. While diverging from the traditional HPC applica-tion profiles, many of these applicaapplica-tions still rely on the large num-ber of tightly coupled cores, cutting-edge hardware and advanced interconnect topologies provided by HPC clusters. Examples of 2nd generation applications are user-level scheduling frameworks like pilot jobs, and applications with dynamic, or hard-to-predict run-time trajectories like Kalman Filter and Adaptive Mesh Refinement (AMR) applications.
The more traditional HPC applications and frameworks like MPI have also started to explore adaptive techniques to scale up on plat-forms that are continuously growing in capacity. For these applica-tions, running at extreme scales bears a twofold risk: a statistically increased risk of hardware and software failure, and increasing costs in case of application failure. Implementing adaptivity and resilience can alleviate these risks. For example, an application that understands its performance profile with a given configuration might decide to terminate early or adjust when it detects inefficient execution, e.g., due to excessive swapping or slow I/O.
Most of these dynamic and adaptive techniques require the ap-plications to have a model about themselves (self aware) and their environment (context aware). With such a model, applications can implement mechanisms like feedback loops to validate their execu-tion parameters and trajectory, and to react and adjust according to their objectives.
Telemetry data is the continuous streams of run-time informa-tion that is generated by HPC systems, and the services and appli-cations running on them. It includes operating system metrics at the process, and thread level, metrics describing the state of I/O resources, network interconnects, and storage facilities, as well as metrics describing the state of job schedulers and other HPC services. In short, telemetry data integrates all the information that is generatedaboutplatforms and applications. It is distinct from the data that is generatedbythe applications, which we refer to as application data.
development overheads, with duplication of localized solutions that reduce portability and mobility. It impedes the development and adoption of adaptive, context aware strategies and architectures. From our perspective, a comprehensive and unifying framework for telemetry data management must be provided by future HPC plat-forms as a system service to facilitate a more efficient application development lifecycle, and a swift adoption of adaptive application research into production.
1.1
Approach and Contributions
We propose a solution to the provisioning and integration of teleme-try data on HPC platforms. This is important and timely because an increasing number of HPC applications rely on it to implement context aware, dynamic and adaptive execution strategies. We are not aware of any other solution emerging. This paper introduces Seastar, a model, API, and implementation blueprint that facili-tates the collection, management and use of telemetry data on HPC platforms, and simplifies the development of context aware HPC ap-plications. This paper makes conceptual and practical contributions to HPC platform and application design:
(1) It develops a graph-based model called Seastar that allows to capture telemetry data within a dynamic graph that represents the continuously changing application and platform structure of an HPC cluster.
(2) It defines a programming interface (API) for applications and system services to query and analyze platform and application structure and telemetry data as a core concept to simplify the development of adaptive applications (section 5).
(3) It describes an architecture blueprint for a framework that im-plements Seastar on an existing HPC cluster (section 6).
This paper is structured as follows: Section 2 discusses concepts related to telemetry data. Section 2.1 presents application use-cases and challenges. Section 4 introduces Seastar, a graph-based model that captures and organises telemetry data. Section 5 describes the API for applications and platform services to interact with teleme-try data. Section 6 lays out a blueprint for an implementation of Seastar. Section 7 presents plans to evaluate Seastar and discusses future research into telemetry data management at scale and in distributed contexts.
2
BACKGROUND
In [22] we have argued that bringing together application develop-ers with HPC-resource providdevelop-ers on both technical and cultural lev-els is a big challenge with substantialpotentialbenefits. The prevail-ing separation between the two communities is the main cause for the lack of interfaces and information flow across the application-platform divide. Similar observations can be found in [9] where Fialhoet al.point out a lack of a common frameworks for teleme-try data as many HPC performance optimization tools implement some or several aspects of the full performance optimization task but almost none are comprehensive across architectures, environ-ments, applications, and workloads. Similarly, Ábrahámet al.[1] propose methodologies to efficiently collect run-time information as a preparation for autonomic exascale applications.
2.1
Application Areas
Use-cases for telemetry data are manifold and an exhaustive survey would not be feasible in this context. Here we lay out six high-level application areas for telemetry data in HPC along with brief examples to illustrate the broad landscape of telemetry data usage.
Application Development Lifecycleis an iterative process from
concept to production. It requires profiling, collecting information about performance data, networking, and I/O patterns so that the application developer can decide between alternatives or fine-tune for a specific architecture. Profiling data is collected by instrument-ing either the program source code, its binary executable, or its run-time environment. Especially during the development of large-scale parallel code, profiling tools like e.g., Vampir/NG [4], PAPI [3], and TAU(g) [12] play a critical role in the optimization process. While all these tools collect large amounts of telemetry data, the data is not accessible outside these frameworks or programmatically during the runtime of an application.
Adaptive Applicationshave many application areas. Some of the
more prominent examples are Adaptive Mesh Refinement (AMR) and Kalman-Filters which exhibit hard-to-predict execution tra-jectories and heterogeneous computational loads. When these are ignored, the performance of these applications can suffer signif-icantly. Adaptivity is also needed to handle external factors, e.g., Eisenhaueret al.[7] have shown how one application’s massive I/O operations perturb the performance of other applications on the same system. Telemetry data is critical to implement adaptivity.
Adaptive Runtime Systemsprovide low-level load balancing and
scaling capabilities for parallel and distributed applications. Adap-tive MPI [11] for example is an alternaAdap-tive run-time for MPI appli-cations. Charm++ [14] and Parallax/HPX [13] provide their own programming models and APIs. All frameworks collect teleme-try data via operating system interfaces and evaluate them via a performance model to make (re-)scheduling decisions. However, the model and associated data is generally not easily accessible externally.
Computational Steeringallows applications to be dynamically
configured (steered) at run-time; as opposed to adaptive run-time systems where adaptivity is transparently provided by the underly-ing framework. Here the feedback loop is moved into the applica-tion space, which also requires context data available in applicaapplica-tion space. Hence steering frameworks often have a monitoring com-ponent, e.g., FALCON [10], an on-line monitoring and steering framework for large-scale parallel applications, and [6] an object-based infrastructure for program monitoring and steering.
Resource Aware Schedulingallows the (re-)scheduling of HPC
Application-Level Schedulingis a tactic to circumvent the static
constraints and granularity of HPC job schedulers. A commonly used method is to employpilot jobsor “placeholder jobs” submitted as a single job to the job scheduler. Once they are active they accept user jobs that are then executed within the placeholder job. Exam-ples of application-level scheduling frameworks are HTCondor [20] and RADICAL Pilot [16]. Most application-level scheduling systems collect telemetry data via operating-system interfaces to determine how to schedule their computational workload most efficiently and to detect errors.
2.2
Context Awareness
The term context awareness is often used in close proximity with monitoring and telemetry data. If we look again at the application areas in section 2.1, all of them require some understanding of the HPC platform context, whether it is information about other applications running, the execution environment or the state of the platform and its components. The development of context-aware applications gained significance with the emergence of grid computing in the early 1990s when application developers and scientists had access to a growing distributed ecosystem of compu-tational resources and federated HPC systems. While grids strove to unify access, job submission, and file transfer across systems, they did not provide abstractions for the different execution en-vironments. Heterogeneity across hardware architectures, cluster and network configurations, parallel run-time environments and software stacks made it very difficult to develop applications that ran well at multiple sites. Consequently, methods and mechanisms were implemented to detect properties of the system an applica-tion was running on and set applicaapplica-tion parameters accordingly. Context awareness is not used consistently in the literature. We offer our own definition to avoid ambiguity. Our definition uses the fundamental building block of the executable representation of an application: the operating system (OS)process. An HPC applica-tion consists of many, potentially communicating processes. Their composition and properties change throughout the application’s life-/run-time. Together with the related terms,self awarenessand
location awareness, our working definition of context awareness is as follows:
Self Awareness:An application islogicallyself aware if it collects
information about its application-level structure, properties, and data with the aim to use these information to control and optimize its internal processing workflows, algorithms, etc. An application isphysicallyself aware if it collects information about of its OS
process structure and properties.
Location Awareness:An application is location aware if it has a
model tounderstandof the spatial mapping of its processes within the HPC platform.
Context Awareness:An application is context aware if it is
lo-cation aware and has anunderstandingof the properties of the executing platform and can correlate these with its own properties.
2.3
HPC System Monitoring
System monitoring is at the heart of most HPC systems. It allows system administrators to have a high-level overview of the entire system and to identify potential issues and bottlenecks. A problem
with system monitoring in HPC is that it is often considered an ad-ministrative tool and not exposed to users and applications. One of the most widely used monitoring systems is Ganglia [15], a client-server system that extracts telemetry data from node operating systems and hypervisors. While data in Ganglia is internally repre-sented in XML, it is normally available only as pre-rendered graphs rather than programmatically. Ganglia does not have the notion of an application, which makes it difficult to correlate application behavior with observed metrics.
New monitoring systems and tools have evolved in the con-text of cloud computing. Naturally, cloud resources are treated as ephemeral and their performance can fluctuate due to both, internal as well as external factors. Hence, system monitoring has emerged as an important pillar for cloud applications and infrastructure. Important tools in this area are Amazon AWS CloudWatch [2] and Prometheus [18]. As opposed to the monitoring systems found on HPC platforms, these systems provide extensive APIs that can easily be consumed by applications and other system services. However, neither of the two system captures the structure of the underlying platform.
3
CHALLENGES AND MOTIVATION
As diverse as the application areas for telemetry data, as diverse are the approaches for its management. From this diversity arises a number of challenges towards a comprehensive, unified frame-work for telemetry data management in HPC environments. In this section we list the ones we consider most important along with a specific use-case that has motivated our research in this area.
3.1
Challenges
From the application areas and use-cases we have identified a set of challenges and shortcomings related to operation telemetry data management:
Data Access:Applications access operating system facilities, such
as the Linux/procfile-system, and sometimes higher-level inter-faces to extract telemetry data. None of these interinter-faces are entirely consistent across platforms and operating systems which introduces portability issues. In addition, many of the interfaces are relatively low-level which can pose additional hurdles in the development process.
Historical Data:Existing operating system interfaces only provide
ad hocdata. If HPC applications require historical telemetry data, e.g., to analyze previous or similar runs, they need to collect and store this data themselves.
Data Contextualization:Just looking at telemetry data in
Data Correlation:It is often not feasible to collect all telemetry
data that is necessary to contextualize a set of metrics in the same context. Some metrics can only be collected in an application con-text, others might be only accessible through a system service. In order to correlate data that is generated by different, independent entities, a common spatial and temporal reference system is re-quired. In order to correlate for example the I/O throughput of a specific operating-system thread with the status and load of dis-tributed file-system partition, information about the locality of the thread is required.
Data Analysis:The volume of telemetry data can become quickly
very large at scale. This makes it difficult to analyze, especially on the application-side. For example, trying to find suspicious I/O patterns in an application running across 10,000 processes is not a trivial endeavor. None of the analyzed systems provide or can make use of analytics facilities that would allow them to derive high-level signals from a high-volume stream of complex input data.
3.2
Motivating Use-Case
We use the RADICAL-Pilot [16] pilot job system to develop bioinfor-matics workflows. Many of these workflows spawn large numbers of short-running processes that can exhibit highly irregular I/O and computation patterns. Confined to the static resources allocated by HPC schedulers, we use pilot jobs to (re-)schedule workflow tasks based on their actual behavior and communication requirements. Furthermore, we want to circumvent system issues like filesystem I/O and network bottlenecks, which seem to occur in a surpris-ingly consistent frequency due to other applications running in the same vicinity. Lastly, we want to capture and catalog the execu-tion trajectories and properties of all our workflows to be able to make predication about the behavior of similar workloads. While RADICAL-Pilot provides effective mechanisms to run many jobs within a single HPC queueing system job, it does not provide any convenient mechanisms to collect the telemetry data required. We explored multiple different ways to collect this data as part of the application logic. The overhead and inefficiency encountered in the process, especially at larger scales, required us to take a step back and think about what would be required to support applications like ours. Seastar is the direct outcome of this.
4
SEASTAR MODEL
To provide a generic model to capture telemetry data on an HPC platform, we define a set of requirements from which we then derive the graph-based Seastar model. The overarching goal is not to introduce yet another platform- or application-specific framework orthogonal to already existing approaches. Instead, we strive to develop a generic framework that is (a) agnostic, i.e., applicable to a broad set of HPC applications and platforms, and can (b) incorporate existing data sources and put them into a common context. We define the following requirements:
(1) The model must capture the physical representation (the anatomy) of an application, i.e., its processes, threads, and the interdepen-dencies between them.
(2) The model must capture the layout (anatomy) of the platform, i.e., its hardware components, and the interdependencies between them.
(3) The model must capture the mapping between the application and the platform anatomies, i.e., the physical application repre-sentationwithinits platform context.
(4) Different actors are interested in different aspects of the system. The model must support structure and data at an arbitrary level of detail.
(5) Depending on the use-case, current (live) and / or previous (historic) data might be required. The model must capture both. HPC applications span a wide area of categories, ranging from tightly-coupled parallel applications to distributed workflows and service-oriented architectures. Each class of application has its own internal logical representation, concepts and building blocks. The only commonality that exists across all applications is that once they run, they have the same physical representation. The physical representation of applications and platforms, i.e., their anatomies serve as the starting point for our model definition. For the application anatomy, we assume a time-variant network of communicating processes. Each process and communication link can be split up into hierarchical networks of sub-components. We make an analogous assumption for the platform anatomy. We make the following assumptions for the Seastar model:
(1) The physical anatomy of an application can be described as nested, hierarchical networks of connected entities.
(2) The physical anatomy of an application can change during its lifetime.
(3) The anatomy of an HPC platform can also described as nested, hierarchical networks of connected entities.
(4) The anatomy of an HPC platform can change during its lifetime. (5) The context of an application is defined as its locality within an HPC platform, i.e., the mapping of an application anatomy to a platform anatomy.
(6) The context of an application can change during its lifetime. Based on these assumptions, we define a graph-based representa-tion of applicarepresenta-tions and platforms. It consists of multi-layer, directed
anatomy graphsthat represent applications and platforms. Vertices and edges of anatomy graphs can hold an arbitrary number of time-series attributes that represent observed telemetry data. A mapping of the application anatomy graphs to a platform graph, called the
context graph, represents the time-variant localities of applications within a platform (fig. 1).
4.1
Anatomy Graphs
AG=(Vд,Vd,Eд,Ena,Eea,(sourcei,tarдeti)i=1,2,3),
with graph nodesVд and data nodesVd, graph edgesEд, node attribute edgesEna, and edge attribute edgesEea, and source and target functions:
fi?!source1:Eд→Vд,source2:Ena→Vд,source3:Eea→Eд fi?!tarдet1:Eд→Vд, tarдet2 :Ena→Vd, tarдet3:Eea→Vd We amend theE-Graphsdefinition in [5] so that data nodes (Vd) can be a pointer to another (nested) anatomy graphAGn. To capture the potential changes in application and platform anatomy over time,AGis time-dependent:
[image:5.612.319.556.83.263.2]AAG(t)= (Vд(t),Vd(t),Eд(t),Ena(t),Eea(t),(sourcei,tarдeti)i=1,2,3)
Figure 1 shows and example of application and platform anatomy graphs. Anatomy graphs allow us to capture a complete picture of the changing structures of applications and HPC platform. By changing the time parametertfor anAAG(t), we can “navigate” back and forth in the evolution of an application from beginning (startup) to end (termination). The ability to track the anatomy of an evolving application is very important for the post mortem and ad-hoc analysis and optimization of dynamic applications and task scheduling frameworks.
4.2
Context Graph
Context graphs (fig. 1 r.) capture the time-varying relationship between a platform anatomy graph and application graphs.
The locality of all applicationsAGApp1..An(t)within the plat-formAGP is captured through a fixed mapping function (•). We define the resulting graph as theglobal context graph(CGGl obal) (see Figure 1 c.):
CGGl obal(App,P,t)=AGP•AGApp1..Appn(t)
Additionally, we define application-specific context graphs (CGAppn) as sub-graphs ofCGGl obal:
CGApp1(App1,P,t)=AGP•AGApp1(t)
This spatio-temporal representation creates a set of graph structures in which the individual components and their mappings can be attributed with context information.
We can think of the vertices of an application graph (VApp) as the operating system processes comprising an application and of the platform graph vertices (VP) as the physical or virtual nodes of an HPC cluster. The edges can then represent communication between processes (EA) and network links between nodes (EApp) respectively.
4.3
Time-Series Data
Telemetry data, e.g., operating system metrics, is captured as time-series data and attached to the node and edge attributes of the graphs. Currently, the Seastar model does not make assumptions about this data. Timestamps are set by the entity collecting the data.
AG(n)App1 = (VApp1, EApp1)
AG(1)App1 = (VApp1, EApp1)
v2 v3 v4 v5 v
1
. . .
v
2 v3 v4 v5
v1
v2 v3 v4 v5 v1
v
6 v7
3 1
2
2
4 5 1
3
t=0
5 4
2 4
5 1
3 7 6
t=1
t=
n
CG(0)
App1
v
1 v2
v4 v3
AG(0)App1 = (VApp1, EApp1)
CG(1)
App1
CG(n)
App1
v1 v2
v
4 v3
v 1
v
4 v3
PG(0)
PG(1)
PG(n)
Application Anatomy Context Graph Platform Anatomy
tim
e
Figure 1: A context graph maps the spatial-temporal ap-plication anatomy graphs to the spatial-temporal platform
graphs. Each instance of a context graph captures the struc-ture and properties of applications and platforms at a given instant.
On an implenentation level, this assumes that all HPC platform components (nodes) use the same, synchronized timebase.
5
SEASTAR API
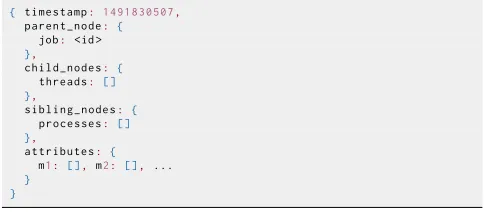
Seastar provides the structure to capture telemetry data in a graph-based model. The Seastar API allows applications, platform ser-vices and human actors to explore and interact with this model. The API uses a RESTful representation and the JSON format to describe return objects. The return object structure is that of an attributed graph or edge node. From each node, the hierarchical graph can be traversed viaparent_nodes,child_node, andsibling_nodes. A timestampfield positions the object in temporal space. Attributes describing edge connections between siblings, e.g., the communica-tion between two MPI processes follow the the same pattern.
{ timestamp: 1491830507,
parent_node: {
job: <id > },
child_nodes: {
threads: []
},
sibling_nodes: {
processes: []
},
attributes: {
m1: [], m2: [], ...
} }
Listing 1: JSON resource object structure
[image:5.612.317.560.525.635.2]5.1
Model Queries
The API usesGraphQL[8] as the query language to the context graph hierarchies. GraphQL allows the caller to extract complex structures from the model in a single API call.
{
process (id: 1) {
siblings {
processes {
memory_uses }
} } }
Listing 2: Get memory consumption of all sibling processes of a job via a GraphQL query.
5.2
Context Awareness
Context awareness requires self awareness and location awareness. Self awareness can be established via the specialselfpath element. In the current iteration of the API it can be called on a job, pro-cess, or thread resource and returns the appropriate object for the application from which it was called.
GET /job/self GET / process /self GET / thread /self
Listing 3: Self awareness viaself
Location awareness is realized via the specialcontextpath element. It allows to follow the context mapping from platform graph to application graph(s) and vice versa:
GET / thread /self/ context # on application
GET / node /42/ context # on platform
Listing 4: Location awareness viacontext.
Accessingcontextfrom a thread for example will return a processor core object, accessing it from a core will return a list of thread objects and so on. Combined with the use ofparent,selfand contextallows for comprehensive context awareness and explo-ration.
5.3
Derived Metrics
Derived metrics are a core concept of the API as they allow to define high-level metrics relevant to a specific use-case, user group, exper-iment, etc. Derived metrics are generally applied to the telemetry data on the framework side, i.e., within the Seastar service. This allows developers to push complexity out of their applications. For example, an I/O-sensitive application might want to terminate or re-configure if the overall I/O throughput is below a certain threshold. Instead of periodically querying the I/O metrics for all processes comprising an application, it is possible to register a derived metric “I/O Threshold”.
PUT / dmetrics
data {
metric_name: " i_o_threshold ",
scope: "job",
function: "..."
}
Listing 5: Adding a derived metric on job-level.
Once a metric is registered, it is available via themetrics sec-tion of the resource object(s) defined inscope. Currently the API does not come with its own language to define the custom metric function. It simply uses the query language of the backend system. For our implementation blueprint explained in more detail in the next section, it uses the functional expression language used by the Prometheus time series database.
5.4
Notifications
Together with derived metrics, notifications are another key con-cept to address the endemic pull-based data gathering process found in many applications. The notification API allows the caller to sub-scribe to one or more metrics via a callback mechanism. Whenever the metric changes (beyond a defined threshold), the callback is engaged. Notifications are user-defined HTTP callbacks, so-called webhooks. When a new notification is available, the Seastar API server makes an HTTP request to the client URI configured for the webhook.
PUT / callbacks
data {
callback_uri: " http:// host /path ...",
scope: "job",
metric: " i_o_threshold ",
}
Listing 6: Adding a derived metric on job-level.
6
IMPLEMENTATION BLUEPRINT
Seastar tries to be agnostic of applications and platform architec-tures and hence does not make many assumptions about how it should be implemented. In this section, we discuss theblueprint
for one possible implementation of Seastar within an existing HPC cluster. This blueprint has its origin in the Seastar research prototype [17] we have been building to explore various concepts around the API.
In lieu of an actual HPC cluster, our experimental environment
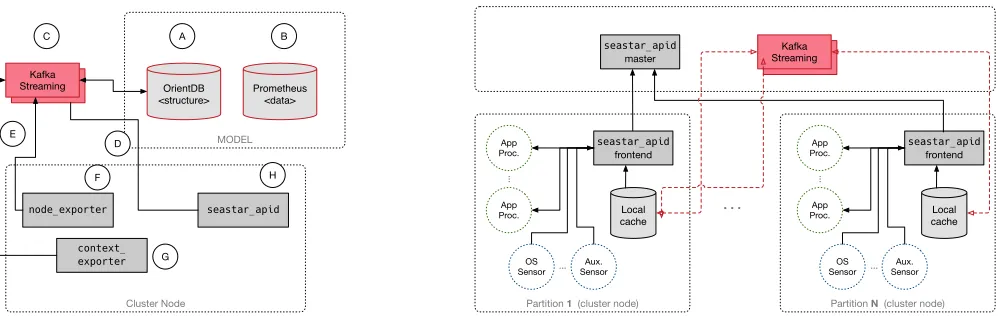
Elasticluster[21] to start up an on-demand SLURM-based Linux cluster in the AWS Cloud. This allows us to experiment in isola-tion, and also to dynamically change the scale of the cluster. Our implementation of Seastar is mostly based on existing technol-ogy, not only to minimize the implementation overhead, but also because there are a plethora of open-source tools available that provide subsets of the required functionality at a level of maturity and scalability that would be otherwise impossible to accomplish. The implementation architecture (fig. 2 l.) consists of four main components: the model server which holds a persistent copy of the context graph and metrics, the API server which provides the Seastar API, and the data sensors, which collect OS, and cluster-level metrics, and the data backbone which provides a high-throughput, scalable, and buffered data transport mechanism.
6.1
Model Database
MODEL
Cluster Node Partition 1 (cluster node)
Local cache seastar_apid
frontend
Aux. Sensor OS
Sensor App Proc. App Proc.
Partition N (cluster node) Local cache seastar_apid
frontend
Aux. Sensor OS
Sensor App Proc. App Proc.
. . . seastar_apid
master
… …
…
…
Kafka Streaming
Kafka Streaming
OrientDB <structure>
Prometheus <data>
Kafka Streaming
Kafka Streaming
seastar_apid node_exporter
context_ exporter
A B
C
H F
G E
D
Figure 2: (Left) The Seastar implementation architecture: model databases, data sensors and API services are connected via Kafka. (Right) The API service (seastar_apid) is implemented as a multi-level, partitioned caching architecture to minimize
telemetry data traffic on the platform. Frontend instances provide the API to the consumers via a local cache which is populated with data relevant to the instance’s partition.
data efficiently stores the telemetry data. The node and edge at-tributes in the graph-database representing the telemetry data are pointers to the respective entries in the time-series database. This distinction is not visible in the Seastar API where structure and data appear consistent again.
6.1.1 Context Graph Database. To store the time-variant
con-text graph, we use OrientDB, an open source multi-model, NoSQL database management system written in Java (fig. 2 l. - A). It sup-ports graph, document, key/value, and object models, with all rela-tionships managed with direct connections between records.
6.1.2 Time-Series Database.For the time-series database we
have chosen Prometheus, an open source monitoring system and time-series database (fig. 2 l. - B). Prometheus can store and process time-series data very efficiently. It has a built-in functional expres-sion language that lets the user select and aggregate time series data in real time. Furthermore, it has anAlertmanagercomponent which can trigger notifications based on predefined queries. This allows for a straight-forward implementation of the derived metrics and notification functionality of the Seastar API.
6.2
Data Transport
We use Apache Kafka, an open-source stream processing platform Kafka as the data transport layer (fig. 2 l. - C). Kafka provides a publish-subscribe-based, unified, high-throughput, low-latency platform for handling real-time data feeds. Kafka makes extensive use of memory channels, and uses disks as buffers if communication channels are congested or streaming targets are temporarily not available. This feature adds the necessary resilience to a distributed system like Seastar. Kafka can furthermore be scaled out easily by adding additional nodes. Kafka is responsible for streaming data in two directions: from the graph- and time-series- databases to the local API services on the individual cluster nodes (fig. 2 l. - D) and from the data sensors to the graph- and time-series- databases (fig. 2 l. - E).
6.3
Data Sensors
Data sensors need to capture both, telemetry data as well as the data that is required to maintain the global context graph, i.e., the relationship between platform and application. They consist of two components: thenode_exporterand thecontext_exporter. The node_exporter(fig. 2 l. - F) is part of the Prometheus ecosystem and exports operating-system metrics to the Prometheus server. Thecontext_exportergathers process, job and queueing system information and sends them to the model database server (fig. 2 l. -G).
6.4
API Service
The API serviceseastar_apid(fig. 2 l. - H) is implemented as a partitioned caching architecture to minimize network traffic. (fig. 2 r.)The service can be instantiated in three different modes: master-mode,forwarder-modeandfrontend-mode. The frontend instances provide the Seastar API described in Section 5. Frontend instances do not have a direct connection to the database, but they maintain a local data cache which is fed either by an upstream master instance (2-tier setup) or a forwarder instance (n-tier setup). If a frontend or forwarder instance cannot serve an API request (cache miss), it sends a request to its upstream service to provide the missing data set.seastar_apidis implemented in Python and uses Python’s
FLASKHTTP framework. A Python API wrapper provides a more convenient, programmatic client access to the API service. Espe-cially the well-defined data types free the user from the burden of parsing JSON return values by hand.
from seastar i m p o r t PlatformAPI
p = PlatformAPI ( endpoint ='localhost ')
rObj = p.self. context . parent
print rObj. kind # dhcp . type_cpu print.rObj . metrics # [' memory_total ', ... ]
rObj . register_callback (cb_func , ...)
[image:7.612.60.561.81.239.2]The Python API wrapper is only one example of a language-specific wrapper for the API. Any language for which an HTTP client library exists can interface with the Seastar service endpoints. Programming language independence and the use of standard, well documented protocols fosters adoption of Seastar across many different application communities.
7
CONCLUSION AND F UTURE WORK
In this paper we have picked up the telemetry data management challenge which we have identified in our previous work [22] as one of the current challenges in today’s HPC ecosystems. We have outlined a solution, Seastar, that provides a conceptual framework, and coherent programming interface for the provisioning and inte-gration of telemetry data on HPC platforms. We have furthermore sketched out how such a system can be implemented and integrated with existing HPC platforms. A first prototype implementation of the model database and API service has the potential to simplify application development significantly. However, further investiga-tion, specifically a larger real-world use-case, study still needs to be conducted.
The work presented in this paper is exploratory and the focus has been on finding the right concepts and abstractions. Future work will focus on the evaluation of Seastar and the implementation of application uses cases.
In-Depth Evaluation:we will evaluate Seastar along two axes:
applicability at scale and applicability across different systems. This will include extensive performance measurements of the suggested architecture blueprint. The implementation of an adaptive user-level scheduling framework based on Seastar as a driving applica-tion use-case is already under development.
Distributed Systems:many distributed applications strive to run
not just on a single HPC platform but to spread their workload and components across multiple platforms concurrently. We will extend the Seastar model to distributed systems and explore architectural alternatives for a distributed implementation.
Extreme Scales and Big (Telemetry) Data:derived metrics are
one of the important concepts in Seastar to provide telemetry data to multiple different audiences at different level of abstraction. While easy enough to manage at small scale, at large scales process-ing derived metrics in real time would require a significant amount of computational resources.
8
ACKNOWLEDGMENTS
This research is supported by anAWS in Education Researchgrant from Amazon Web Services, Inc.
REFERENCES
[1] E. Ábrahám, C. Bekas, I. Brandic, S. Genaim, E. B. Johnsen, I. Kondov, S. Pllana, and A. Streit. Preparing HPC applications for exascale: Challenges and recommen-dations. In Proceedings of the 18th International Conference on Network-Based Information Systems, pages 401–406. IEEE, 2015.
[2] Amazon Web Services, Inc. AWS CloudWatch website: http://aws.amazon.com/ cloudwatch/.
[3] S. Browne, J. Dongarra, N. Garner, G. Ho, and P. Mucci. A portable programming interface for performance evaluation on modern processors. International Journal of High Performance Computing Applications, 14(3):189–204, 2000.
[4] H. Brunst, W. E. Nagel, and A. D. Malony. A distributed performance analysis architecture for clusters. In Proceedings of the IEEE International Conference on Cluster Computing, pages 73–81. IEEE, 2003.
[5] H. Ehrig, U. Prange, and G. Taentzer. Fundamental theory for typed attributed graph transformation. In Proceedings of the International Conference on Graph Transformation, pages 161–177. Springer, 2004.
[6] G. Eisenhauer and K. Schwan. An object-based infrastructure for program monitoring and steering. In Proceedings of the SIGMETRICS Symposium on Parallel and Distributed Tools, pages 10–20. ACM, 1998.
[7] G. Eisenhauer, M. Wolf, H. Abbasi, and K. Schwan. Event-based systems: Opportu-nities and challenges at exascale. In Proceedings of the Third ACM International Conference on Distributed Event-Based Systems, page 2. ACM, 2009. [8] Facebook Inc. GraphQL website: https://github.com/facebook/graphql. [9] L. Fialho and J. Browne. Framework and modular infrastructure for automation
of architectural adaptation and performance optimization for hpc systems. In Proceedings of the International Supercomputing Conference, pages 261–277. Springer, 2014.
[10] W. Gu, G. Eisenhauer, E. Kraemer, K. Schwan, J. Stasko, J. Vetter, and N. Mallavarupu. Falcon: On-line monitoring and steering of large-scale parallel programs. In Proceedings of the Fifth Symposium on the Frontiers of Massively Parallel Computation, pages 422–429. IEEE, 1995.
[11] C. Huang, O. Lawlor, and L. Kale. Adaptive MPI. Languages and Compilers for Parallel Computing, pages 306–322, 2004.
[12] K. A. Huck, A. D. Malony, S. Shende, and A. Morris. TAUg: Runtime global per-formance data access using MPI. In European Parallel Virtual Machine/Message Passing Interface User Group Meeting, pages 313–321. Springer, 2006. [13] H. Kaiser, M. Brodowicz, and T. Sterling. Parallex an advanced parallel execution
model for scaling-impaired applications. In Proceedings of the International Conference on Parallel Processing Workshops, pages 394–401. IEEE, 2009. [14] L. V. Kale and S. Krishnan. Charm++: A portable concurrent object oriented
system based on C++. In ACM Sigplan Notices, volume 28, pages 91–108. ACM, 1993.
[15] M. L. Massie, B. N. Chun, and D. E. Culler. The Ganglia distributed monitoring system: Design, implementation, and experience. Parallel Computing, 30(7):817– 840, 2004.
[16] A. Merzky, M. Santcroos, M. Turilli, and S. Jha. RADICAL-Pilot: Scalable execu-tion of heterogeneous and dynamic workloads on supercomputers. Computer Research Repository (CoRR), abs/1512.08194, 2015.
[17] Ole Weidner. SEASTAR website: https://github.com/oweidner/seastar. [18] Prometheus Authors. Prometheus website: https://prometheus.io.
[19] W. Tang, N. Desai, D. Buettner, and Z. Lan. Analyzing and adjusting user runtime estimates to improve job scheduling on the blue gene/p. In Proceedings of the IEEE International Symposium on Parallel & Distributed Processing, pages 1–11. IEEE, 2010.
[20] D. Thain, T. Tannenbaum, and M. Livny. Distributed computing in practice: the Condor experience. Concurrency and Computation: Practice and Experience, 17(2-4):323–356, 2005.
[21] University of Zurich. Elasticluster website: http://gc3-uzh-ch.github.io/ elasticluster/.
[22] O. Weidner, M. Atkinson, A. Barker, and R. Filgueira Vicente. Rethinking high performance computing platforms: Challenges, opportunities and recommen-dations. In Proceedings of the ACM International Workshop on Data-Intensive Distributed Computing, pages 19–26. ACM, 2016.