University of Southern Queensland
An Analysis of the Use of Market Intelligence Data by Senior Business Leaders – The Development of a New Model (ICSAR) For the Identification and Implementation of
Specifically Focused Data
A Dissertation submitted by
Christopher James Dowsett (MA, BSocSc) For the award of Doctor of Professional Studies
Abstract
Big data, analytics and data science are terms that have come to represent a growing focus on decision making built on the foundation of market intelligence data. The enthusiasm for this form of evidence-based decision making has grown with the ability for businesses to better track their customers, competitors and market. Strategy firms such as McKinsey and company have also added to the discussion by highlighting the potential for data to improve business efficiency. News headlines such as “Big data: The next frontier for innovation, competition, and productivity” (McKinsey and Company, 2011) and “Data Scientist: The Sexiest Job of the 21st Century” (Harvard Business Review, 2012) are two examples illustrating the optimism for data use in business activities.
The ability to better track customer and markets has resulted from the development of technology and the transition to more digital services. For example, a growing number of businesses offer their services and products based on a subscription model through the internet. Software-as-a-Service is one example of this. With many products now available in the digital space, there has been a corresponding increase in the volume and variety of data sources available to business leaders. For example, software services hosted in the digital space mean enhanced customer behaviour insights because digital forms and ‘clicks’ can be monitored and analysed. Marketing departments now have an enhanced ability to conduct rapid testing of video marketing content through social media that is faster and cheaper than testing two different television commercials.
These points raised questions about how business leaders were selecting from the growing variety of data sources and what factors influenced that selection process. From there, the question was raised about how data was being used in decision making.
Answering these questions holds significant potential for businesses. Understanding limitations to data use and applying this knowledge in a structured way has the potential to ensure data is used objectively and holistically in decision making. The result is that businesses are better able to take advantage of market intelligence and extract the greatest value from its organisational knowledge.
This research studied what data sources were used by business leaders, how the data was used in their day-to-day projects and what factors led to the selection of a data source over another in the decision making process. The research was an exploratory approach using a mixed methodology that included in-depth interviews, a survey and a case study. The research deliberately focused on senior business leaders to ensure the research participants were at the level that was most likely to be in a position to make decisions.
The research found that there was a varied approach to data use with multiple factors being involved in how data was used. The first finding was that most business leaders used a variety of data sources. However, data sources were selected based on a hierarchy that was specific to each individual business leader and data sources were not used consistently. The hierarchy was subjective and was based on several factors shown in the second finding. There was not a standardised approach to the use of any single data source meaning a data source like surveys could be used for behavioural tracking by one business leader and for logo feedback by another, for example. This highlighted the need for organisations to educate business leaders on the best data source for answering different business questions and to put structure around how data sources were used.
selection of data by business leaders. For example, a business leader was more likely to use a familiar data source even if there was a non-familiar data source that would have been more accurate. Additionally, business leaders were found to forgo accuracy in favour of a data source that was available more quickly. This highlighted the need for a framework that minimised the subjectivity involved in choosing a data source and encouraged objective data use.
The third finding was that there was mix of data maturity levels and that most organisations did not have an integrated approach to data use. The possible cause of this was that many organisations lacked data leadership to ensure that data use in decision making was structured and holistic across the business. Instead, this study found silos between teams that resulted in duplicated or contradictory use of data and individual data sources used inconsistently. This highlighted the gap between the potential of market intelligence and the lack of organisational structures to support effective data use. It also showed the need for organisations to invest in data use structures and frameworks to complement data collection investments.
These findings showed that businesses seeking to capitalise on the growing number of data sources needed to examine whether business leaders were using data effectively. The finding that there was a degree of subjectivity in the selection of a data source suggests businesses needed to invest in a decision making framework that ensured a data source was used objectively and based on its ability to meet the project needs.
Certification of Dissertation
This is to certify that the work contained in the thesis is the bona fide work of the researcher, that the work has not been previously submitted for an award, and that, to the best of the researcher’s knowledge and belief, the dissertation contains no material previously published or written by another person except where due acknowledgement and reference is made in the dissertation to that work.
____________________________ Christopher James Dowsett
Researcher and Doctoral Candidate University of Southern Queensland
____________________________ Dr. Luke Van Der Laan
Supervisor
Acknowledgements
Dr. James Kable
Dr. Luke Van Der Laan Dr. Ralph Clark
Kathryn Bishop The Bishop family Meryl Cook
Ken Wach and Intuit
Table of Contents
Abstract ... 2
Certification of Dissertation ... 5
Acknowledgements ... 6
Table of Contents ... 7
1.0 Study Introduction ... 10
1.1 Introduction ... 10
1.2 Background ... 10
1.3 Context ... 13
1.3.1 Practice Context ... 13
1.3.2 Professional Context ... 14
1.3.3 Personal Context ... 14
1.4 Practice Project ... 15
1.5 Purpose... 16
1.6 Research Questions ... 16
1.7 Research Methodology Overview ... 17
1.8 Epistemology and Knowledge Paradigm Overview ... 17
1.8.1 Pragmatism ... 18
1.8.2 Action Learning and Action Research (ALAR) ... 20
1.8.3 Similarities between Pragmatism and Action Learning and Action Research ... 22
1.8.4 Design Thinking ... 23
1.9 Outline of the Report ... 24
1.10 Definitions ... 25
2.0 Literature Review ... 28
2.1 The Size of the Market Intelligence Industry ... 29
2.2 Open Market Intelligence Industry Created by Technology Shifts ... 32
2.3 Pressure to Show ROI and Value ... 36
2.4 Organisational Demographics and Their Impact on Data Source Selection ... 41
2.5 Complex Landscape of Data Sources and Confusion of Roles... 45
2.6 Big Data and Information Overload ... 50
2.7 Social Networks as a New Market Intelligence Data Source ... 53
2.8 Data Use Missing a Structured Approach ... 59
2.10 Summary of Overall Lessons Learned ... 65
3.0 Methodology ... 69
3.1 Methodology Introduction ... 69
3.2 Project Methodologies ... 70
3.2.1 Project One Methodology: Interviews with Senior Business Leaders ... 70
3.2.2 Project Two Methodology: Online Survey with Senior Business Leaders ... 74
3.2.3 Project Three Methodology: Case Study on the Use of Data from Social Networks ... 78
3.2.4 Project Four: Development of the ICSAR Model for Data Use ... 82
3.3 Ethical Considerations ... 82
4.0 Qualitative Analysis on the Use and Value of Data Sources in Business Decisions ... 84
4.1 Introduction ... 84
4.2 Analysis of Data ... 85
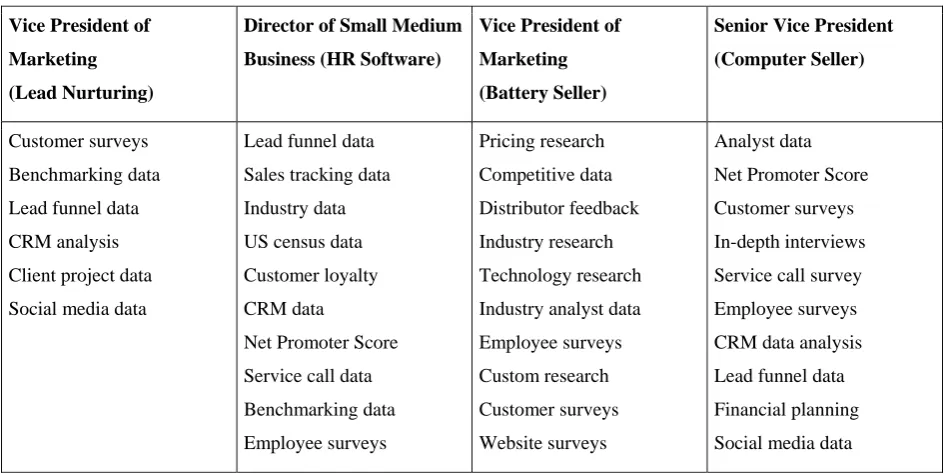
4.2.1 Types of Data Used in Day-to-Day Business Decisions ... 85
4.2.2 How Business Leaders Use Data ... 89
4.2.3 Data Sharing Within the Organisation ... 94
4.2.4 Lack of Data Leadership ... 96
4.2.5 Data Delivery Formats ... 99
4.2.6 Level of Data Detail ... 101
5.0 Survey of Senior Business Leaders on Data Use in Business Decisions ... 104
5.1 Introduction ... 104
5.2 Analysis of Data ... 105
5.2.1 Question 1 to 5 – Demographic Data ... 105
5.2.2 Question 6 – Data Sources Used in Decision Making ... 109
5.2.3 Question 7 – Most Valuable Data Source for Decision Making ... 112
5.2.4 Question 8 – Number of Data Sources Used in Typical Project Decisions ... 114
5.2.5 Question 9 – Most Important Factors When Considering Data Sources ... 116
5.2.6 Question 10 – Frequency of Meeting with Research and Analytics Professionals ... 118
5.2.7 Question 11 – Frequency that Research or Analytics Was Involved as a Key Partner in Project Business Decisions (Last 12 Months) ... 120
5.2.8 Question 12 – Formal Plans or Frameworks In-place ... 122
5.2.9 Question 13 – Agree to Disagree Rating of Statements Exploring Data Use ... 124
5.2.10 Objectivity in Data Use Correlates with Increased Sophistication of Data Use ... 129
6.1 Introduction ... 135
6.2 Analysis ... 136
6.2.1 Social Media Data Use is Still in Early Stages ... 136
6.2.2 Fractured Impact of Social Media Data Insights ... 138
6.2.3 Limited Collaboration around Social Media Data Insights ... 140
6.2.4 Social Media Data Use has a lot of Unrealised Potential ... 142
7.0 Proposed ICSAR Model of Enhancing Data Use in Organisational Settings ... 144
7.1 Introduction ... 144
7.2 The ICSAR Model Framework for Data Use ... 144
7.2.1 Introducing the ICSAR Model Framework ... 144
7.2.2 ICSAR Model – Steps and Overview ... 150
7.2.3 ICSAR Model – Detailed Breakdown ... 151
8.0 Conclusion ... 163
8.1 Summary Research Findings ... 163
8.1.1 Qualitative Interviews Findings ... 163
8.1.2 Survey Research Findings ... 168
8.1.3 Case Study Research Findings ... 176
8.1.4 Overall Research Findings ... 181
8.2 Anticipated Contributions of the Research ... 189
8.3 Research Limitations ... 189
8.4 Future Research Recommendations ... 191
9.0 References ... 193
1.0 Study Introduction
1.1 Introduction
Market research, business intelligence, analytics and data science are business areas that have quickly expanded over the last three decades. This has been due to more services moving online and the digitisation of services across all industries. The digitisation of services has allowed for tracking developments and enhanced measurement of online customer behaviour. Recent prominent examples include web analytics, online surveys and social media analytics enabling businesses to access large amounts of data on their industry and customers.
There has been a lot of focus on investments in the technologies and storage centres for these new sources of data. However, there has not been the same level of emphasis on how business leaders incorporate these different and emerging data sources into their decision making.
Past academic research in this area has been specific to the use of market research, targeted manager-level respondents or focused on business intelligence platforms. The following research sought to expand past studies by focusing on how data is used by a more senior respondent base.
This research concentrated on gathering insights about the influences and factors that were involved when a business leader selected and used data in the decision making process. By exposing those influences and factors, the research sought to learn how data use could be improved. The study took an exploratory approach by combining different methods across both qualitative and quantitative feedback as a means to strengthen the relative weaknesses of each method. Themes and insights from the research were correlated across each section of the study to validate findings.
1.2 Background
consumer insights, marketing research and analytics have all featured prominently in articles that discussed the benefits of applying data to various business areas such as marketing, sales, customer service, finance and human resources.
Analysts, such as Hofmeister and Bockemühl (2014) from the Boston Consulting Group, and many other commentators have noted that the application of data and customer insights represents a significant competitive advantage and a source of potentially large cost savings to organisations. McKinsey (2011) wrote that the use of data was a key part of business growth and competition across all industries, meaning that all companies would need to take data use seriously. They went on to say that market intelligence use would “underpin new waves of productivity growth and consumer surplus” and they estimated that a retailor using data has the potential to increase operating margins by 60% or more. Often, these discussions then urged business leaders to use data to inform their business activities.
However, applying customer and market data insights requires navigating a complex landscape of data sources. There are a number of suppliers, services and tools that can be used to collect data and generate insights for business leaders. For example, market research (also known as marketing research) has become both a functional area within businesses as well as a large industry sector comprised of market research supplier companies. New research and data collection technologies are also offered by companies that were not traditional research businesses. For example, Google started as a search engine technology company but expanded by developing a tool called Google Consumer Surveys allowing marketers to deploy surveys across Google’s publisher network and collect responses.
in-product analytics. These analytical functions were in addition to market researchers and finance analysts at the organisation, all of whom generated market and customer insights.
Some businesses have also created functional areas for specialised, intensive research programs as a long-term business strategy to maintain a competitive advantage. For example, Intel advertised an internal group called Intel Labs. The Intel Labs website listed various research areas like Immersive Experience, where Intel “researchers and ethnographers study people’s everyday routines to develop computing experiences that simplify, enhance, and enrich our daily lives.” (Intel Research Labs, 2013)
The ongoing development of new tools, new emerging functions within businesses and multiple industry sectors supporting market intelligence means that there is a complex and growing array of data sources. Business leaders now have a large number of data sources and ways to get business insights on their customers and broader market activity. This high prevalence of information and variety of business intelligence can be confusing and make it difficult to apply the most appropriate data measurement for a business need. (Chen, Chiang and Story, 2012; pp. 1165 – 1188)
In a 2013 survey, McKinsey Group (2014) found that 29% of Chief Marketing Officers (CMOs) said they used marketing analytics to make decisions. The survey also found only 3% of the CMOs said that data use contributed “very highly” to their company’s performance. Court writes “many executives … remain unsure about how to proceed. They are not certain their organisations are prepared for the required changes, and a lot of companies have yet to fully exploit the data or analytics capabilities they currently possess.” (Court, 2012)
place but also structure workflows and incentives to optimize the use of data. Access to data is critical – companies will increasingly need to integrate information from multiple data sources, often from third parties, and the incentives have to be in place to enable this.” (McKinsey, 2015)
This is an important area for investigation both academically and in practice because technology does not derive value from data, business leaders do. Therefore, the following research focused on data use to understand how data sources were being leveraged by the senior business leaders to make decisions. Namely, the research asked questions about how business leaders were selecting from the growing variety of data sources, how data sources were being used in business activities and what factors were influencing those decisions. The goal of this research was to identify limitations and ascertain ways to improve the effectiveness of data use.
1.3 Context
It is important to consider the various contexts of the following research. The following sections outline the practice, professional and personal contexts of the research.
1.3.1 Practice Context
The practice context was an important consideration for this research because it informed the research design and methods chosen to collect data.
Respondent seniority was a critical element of this research. Senior business leaders were considered likely to have the opportunity to use data in decision making as well as the authority to direct how data was used for projects managed within their team. This level of authority was considered necessary to understand what factors influence how data is used in decision making and subsequently provide the appropriate feedback for designing methods to improve data use.
Additionally, other academic and industry studies on data use were observed to have focused on manager-level respondents or research and intelligence professionals. This research adds to those studies and existing bodies of knowledge by targeting a more senior group of business respondents.
1.3.2 Professional Context
This research was conducted as part of a professional studies degree. Therefore, the professional context of the research is within the market research, analytics and business intelligence environments.
The goal of the research was to contribute both theory and practice developments to the market research, analytics and business intelligence professional areas. It was formulated at the intersection of pragmatic, Action Research and design thinking knowledge paradigms. More information on the epistemological background can be found in a following section. This means the research was informed by this professional practice area rather than a specific academic context.
1.3.3 Personal Context
The researcher’s experience covered all aspects of research and analytics project management. This included designing measurement frameworks according to a business need, analysing results, presenting to business leaders and working with business leaders to incorporate insights into business activities. The researcher’s experience also included working with all levels of business leaders from junior managers through to C-level executives.
The study topic was chosen because the researcher wanted to understand data use in more depth and work within an Action Research context to contribute to the analytics professional practice by using the research insights to develop a model framework for improved data use. The proposed ICSAR model framework created by the author was the end result of this exercise. Further information is in following practice project section.
1.4 Practice Project
The goal of this research was to produce a practical application that uses the insights from the research to support business leaders to use data more effectively. This was considered a critical component of this study in line with the aims Action Research and pragmatism to provide a practical outcome from a research project.
In this study, the research provided insights into the factors that influence and limit holistic data use in decision making. For example, one of the insights showed that senior business leaders used more familiar data sources over other data sources that were potentially more accurate. The research also found data silos and a lack of integrated approach to data use. This limited data sharing across the organisation and resulted in duplicated efforts.
objective data use in decision making. Each of the five steps in the framework has been included to address one or more of the influencing factors highlighted in this study. The framework represents a professional contribution by the author to the practice of market intelligence and data use in business.
Additionally, the ICSAR model has been made available online at http://www.designingdata.co as an open source tool for any business leader to use and adapt to their specific business context. The ICSAR model was designed such that business leaders have some flexibility to adapt the framework to their industry or business context while retaining the intended benefits of the framework. Business leaders, analytics professionals and others are able to freely download the ICSAR model framework and information about the research findings.
This study has attempted to provide a practical contribution to the practice of business data use by making both the ICSAR model and the summary findings available online to business professionals.
1.5 Purpose
The purpose of this study was to uncover the specific factors that influence and determine the way data sources were used by business leaders. By understanding the limitations on data use, businesses can invest in structures that enhance data use by business leaders. The study also focused on using those findings to design the proposed ICSAR model for data use. The ICSAR model was developed by the research author to provide a practical outcome in order to support businesses overcome limiting factors of effective data use.
1.6 Research Questions
This research study focused on three questions:
1. How do business leaders select from a growing variety of data sources?
1.7 Research Methodology Overview
This study employed a mixed methodology approach in order to approach the research questions from different contexts and support the relative weaknesses of each method. The study included three research projects that were conducted sequentially so that each project’s insights informed the next project.
The first research project was qualitative and included 10 semi-structured interviews with
senior business leaders exploring their use of different data sources in business
The second project was an online survey of 111 senior business leaders that provided
quantitative feedback about data use in decision making
The third piece of research was a case study that examined how social media data was
used in Intuit’s Small Business Group
The research methodologies for each project are discussed in greater detail in the methodology chapter. This includes notes on sampling, method options considered and the methodology notes.
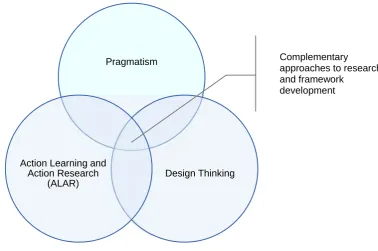
1.8 Epistemology and Knowledge Paradigm Overview
complementary foundations in the development of this research study. Their relationship is shown in the Figure 1 below and each is further explored in the following sections.
Figure 1 - Combining Pragmatism, Action Learning and Action Research, and Design Thinking
1.8.1 Pragmatism
Creswell (2013) provided a simple introduction to the assumptions and viewpoints of pragmatism. Creswell noted that pragmatism focuses on actions, situations and consequences, using all available research methods to find a solution to a particular problem. Pragmatism sees the world, and therefore organisations as continually evolving entities because “research always occurs in social, historical, political, and other contexts.” (Creswell, 2013; p. 11) This means that research and the role of knowledge discovery is to solve current, temporary problems. (Strübing, 2007)
Cherryholmes (1992) noted that Pierce was the first explicit declaration and definition of pragmatism to look at the practical consequences. From there, Cherryholmes wrote that James and Dewey built on the notions set by Pierce by putting attention on the consequences of action.
Pragmatism
Design Thinking Action Learning and
Action Research (ALAR)
Complementary approaches to research and framework
“Many research traditions from positivist/empiricist (quantitative) to phenomenological/interpretivist (qualitative) to versions of critical research aim at getting things right.” (Cherryholmes, 1992; p. 13) Cherryholmes commented that these views place theories and descriptions before action and practice. For pragmatists it is the opposite. Action and interaction precede values and theories.
Friedrichs and Kratochwil (2009) noted that the social world is constituted by inter-subjectivity and that the world is not independent from the observer. Given this inter-subjectivity, Friedrichs and Kratochwil argued that pragmatism provides an instrument to conduct research with “an appropriate degree of epistemological and methodological awareness” (Friedrichs and Kratochwil, 2009; p. 707) that provides practical outcomes. In contrast, positivism is an example of an epistemological view where there is an objective truth and the goal of research is to prove or disprove a pre-defined theory. (Cornish and Gillespie, 2009)
In terms of methodology, pragmatism argues there is no absolute best method. Instead, it focuses on the method that will solve the problem at hand because problems are transitory. Cornish and Gillespie (2009) used the example of health psychologists who apply a range of knowledge-discovery practices including: randomised controlled trials (RCTs), surveys, narrative analysis, discourse analysis, Action Research and theoretical work, for example.
Tashakkori and Teddlie (2002) wrote that pragmatism supports “both qualitative and quantitative methods in the same research study and within multistage research programs.” (Tashakkori and Teddlie, 2002; p. 21) They commented that pragmatism considers the research question to be more important than the methods used. This means that the appropriateness of the method or series of methods chosen for the research should be judged by the research question rather than an underlying epistemological position, supporting mixed method approaches. (Denscombe, 2009; Sandberg, 2005)
of work or other grouping. Further, the research design allowed for the development of a practice framework that is supported by validated evidence as derived from the multiple projects.
1.8.2 Action Learning and Action Research (ALAR)
This research project was also designed as part of an Action Learning and Action Research (ALAR) approach while adopting a pragmatic position. At a basic level, Action Learning involves learning from a specific example or experience and then taking action and applying that learning. Action Research “is a cyclical iterative process of action and reflection on and in action.” (Zuber-Skerritt, 2001; p. 2) Action Research is systematic, verifiable and the results are always made public.
Action Research was formed in order to provide highly applicable research insights to transitory, complex social settings. Zuber-Skerritt (2001) wrote that ALAR emerged in the 1920s in response to rapid change caused by World War I, World War II and wide-reaching geopolitical changes. The field continues to develop in recent years due to “rapid technological and socio-economic change.” (Zuber-Skerritt, 2001; p. 1)
Blichfeldt and Andersen (2006) linked Action Research with Lewin’s work in the late 1940s. They noted that Lewin was not content with studying complex social events in the laboratory. Blichfeldt and Andersen argued that Lewin “sought to develop theories appropriate for real world problem solving.” (Blichfeldt and Andersen, 2006; p. 2)
Action Research is also agnostic. The methods chosen in Action Research are based on the research question and are subject to re-examination with any new research question. This implies there is not any one, universal best method for conducting research.
Finally, Susman and Evered (1978) noted that Action Research implied system development. The system in this case refers to a cycle of development starting with diagnosis, evaluation and learning in an ongoing circle of development. Action Research provides the capacity for generating problem-solving procedures through research insights related to real-world procedures.
This cycle of action and research followed by new action and subsequent research is a core tenet of how Action Research enables organisational development. In theory, Action Research provides an enduring cycle of development and improvement for organisations to take advantage of the rapid technological and socio-economic change that Zuber-Skerritt (2001) discussed. Market intelligence is one example where there has been significant technological change. Zuber-Skerritt, Blichfeldt and Andersen (2006) highlighted that ALAR is ideally suited to a situation like this, where the research can look at the change taking place and offer recommended action. Zuber-Skerritt highlighted that ALAR has proven to be an effective approach in organisational learning, innovation in a business setting and professional development.
Action Research has been applied to many research questions, including applying a mixed method approach. Braccini, Spagnoletti and D’Atri (2012) used Action Research when defining cooperative business models for inter-organisational cooperation across local governments in the European Union. They used a participatory Action Research approach including interviews, text analysis of business documents and direct observations. Action Research was chosen in this instance because the research could provide practical research-based insights.
development, communication) and critical issues (e.g. cultural relevancy, hidden curriculum, gender),” (Manfra, 2009; p. 32) arguing that these are messy and interwoven. Action Research helps knowledge and learning cross the divide of practical and critical issues by enabling teachers to engage in decision making and theorising, making them responsible for both theory and practice.
Kirwan and Conboy (2009) noted that there were some limitations to Action Research that needed to be addressed. The first limitation they raised was that “like most qualitative research methodologies, Action Research was difficult to do well and easier to do atrociously.” (Kirwan and Conboy, 2009; p. 49) It can be argued that this limitation is not restricted to Action Research. Their comment implies that Action Research leans heavily on the qualitative side of research. This may be true for certain individual studies but Action Research incorporates qualitative and quantitative methods. By its very definition, Action Research is open to all methodologies and the focus is on the most applicable research method to the question, much like pragmatism.
Another limitation noted is that Action Research “involves heavy involvement in the research situation, with the opportunity for good learning, but at the potential cost of objectivity.” (Kirwan and Conboy, 2009; p. 50) This limitation was followed by the recommendation that the way to overcome this limitation is to include “multiple Action Research cycles during the collection of the results.” (Kirwan and Conboy, 2009; p. 55) They referred to Susman and Evered (1978) as leading authors in this field who advocate the use of multiple Action Research data collection efforts in one project in order to show objectivity.
1.8.3 Similarities between Pragmatism and Action Learning and Action Research
Methodology agnostic – both approaches are methodology agnostic, meaning the method
is chosen according to the question and/or context. There is no one single best method.
Support of mixed method approach – linked with the above point, both pragmatism and
ALAR show support for a mixed method approach as a means of triangulating results and validating findings.
Knowledge is contained within a specific context – both pragmatism and ALAR support
the view that social science knowledge is always contained within a specific context.
Focused on practical outcomes – both pragmatism and ALAR focus on using research to
deliver practical outcomes.
The following research program used these core tenants of pragmatism and ALAR as a foundation for exploring data use in business decision making. Specifically, a mixed method approach was used to validate findings across quantitative and qualitative measures. The goal of the mixed method approach was to triangulate and validate findings via multiple methods. The mixed methodology approach also ensures that the relative weaknesses of each method are addressed by other methods. For example, the lack of a large sample in the qualitative interviews was addressed by the survey of senior business leaders. The use of the case study was to focus on one particular data source, in this case social media, and gather specific insights in a way that the qualitative interviews and the survey were not able to do. This program was also focused on providing a practical outcome from the studies, using the factors found to influence data use to build a model framework for improved data use in decision making.
1.8.4 Design Thinking
“Design is characterised by its emphasis on solution finding, guided by broader purposes and ideal target systems.” (Romme, 2003; p. 598) As Romme argued, organisational research and thinking could benefit from adding design as a role model in addition to science and humanities. Design is grounded in a pragmatic approach to organisational development and, therefore, complements ALAR methods. Design thinking is considered as part of the final project in line with the principle that the purpose of this research is to provide a practical outcome that “changes existing organisational systems and situations into desired ones.” (Romme, 2003; p. 559) That is to say, the insights from this research program were used to help business leaders by providing a flexible framework that can be used to improve data use in an organisation.
There are clear similarities with pragmatic principles and direct references to the fact that pragmatism is a fundamental part of design thinking. “Design assumes each situation is unique and it draws on purposes and ideal solutions, systems thinking, and limited information. Moreover, it emphasises participation, discourse as medium for intervention, and pragmatic experimentation.” (Romme, 2003; p. 599)
1.9 Outline of the Report
This research report has been comprised of nine chapters corresponding to different phases in the study:
Chapter one – Outline of the research report and epistemological background
Chapter two – Literature review highlighting issues related to data use
Chapter three – Methodology introduction
Chapter four – Qualitative research with senior business leaders and initial themes
Chapter five – Survey of senior business leaders including emerging themes
Chapter six – Analysis of growth of social media data use and case study with Intuit
Chapter seven – Proposed ICSAR model for data use overview and example use case
Chapter eight – Conclusion including a summary and future research recommendations
1.10 Definitions
There are a number of terms used in this document that reflect broader industry terms. Some have been used interchangeably in industry articles and references so the following definitions and explanations have been provided to give clarity and outline how those terms have been used in this document.
Marketing research has also been known as market research and more recently consumer insights. Industry definitions varied but typically involved the application of research methods to a business question. Common projects in this area included customer satisfaction studies, focus groups or market sizing exercises. Methods used were quantitative, qualitative or a combination of both. (GRIT, 2014)
Analytics and data science have been defined as the application of statistics or quantitative methods to business areas, often using computational programs. Examples show analytics or data science projects implemented as stand-alone functions or embedded within other business functions. (Gartner, 2015b)
Business intelligence (BI) was an “umbrella term that referred to a variety of software applications used to analyse an organisation's raw data. BI as a discipline has been made up of several related activities, including data mining, online analytical processing, querying and reporting.” (Mulcahy, 2007)
Big data has been defined in a variety of ways by different authors. For the purposes of this research, it has been referred to as the phenomenon of an increasing volume of data often in large data sets, an increasing variety of data sources and an increasing velocity of data being collected from the rapid growth of new technologies. (Gartner, 2015a)
Social media and social networks have been defined as websites or online platforms that enable users to communicate with other users by posting messages, images, sharing content, and maintain a profile. (Ellison and Boyd, 2007)
More specifically, Ellison and Boyd (2007) defined social networking sites as “web-based services that allow individuals to (1) construct a public or semi-public profile within a bounded system, (2) articulate a list of other users with whom they share a connection, and (3) view and traverse their list of connections and those made by others within the system. The nature and nomenclature of these connections may vary from site to site.” (Ellison and Boyd, 2007; p. 211) In other words, social networking technologies allows individuals to connect online, often by creating a public profile and allowing people to express comments and join discussions around a topic. Businesses are also able to create profiles, join conversations and share content via social networking sites.
Chui, Drewhurst and Pollack (2012) argued that social is a feature, not a product, and therefore the potential the use of social networking technologies to business was varied with the potential for economic benefits. Social technology can also be applied to many different platforms because it is a technology enabling social interactions between people. For example, many IT-enabled tools, such as online banking, can incorporate social technologies such as the ability to comment on features or by including the Facebook ‘Like’ buttons to allow users to share information with their social circles. Social technology can also be used internally at a business to help connect employees with colleagues across the organisation.
2.0 Literature Review
Market intelligence, research and analytics have been developing areas for businesses. Therefore this literature was the first step in identifying how market intelligence data was being used by business leaders. The goal of the literature review was to form initial ideas that were then tested with business leaders through qualitative interviews, survey research and a case study.
This literature review examined academic and industry articles related the use of market intelligence and consumer insights data in business activity. The role of this literature review was to begin understanding the breadth of growing sources of data available to business leaders per research question one. The second goal was to begin isolating the factors that influenced how a business leader selected a data source in their decision making process. Influence was studied by looking closely at literature that discussed the value perception of different data sources. Identifying the influencing factors provided insight into how data was used in business activities which was outlined as a goal per research question three.
As the market intelligence industry grapples with new methods and new technologies, it is important to understand how business leaders perceive the value of market intelligence and consumer insights data. It is also important to understand how market intelligence data is used in a wider business context to ensure it is being utilised effectively and in a way that maximises its potential. In doing so, the market intelligence industry can continue moving towards a solution that meets the needs of businesses. This ensures that market intelligence data services are mutually beneficial to the industry as well as businesses.
market research agencies and it is also a feature within tools such as analysis components to sales programs. As such, the role of market intelligence varies by the activity being measured and by the department sponsoring the research. This means that market intelligence can be deployed in a wide variety of scenarios and to different degrees of impact on the organisation’s activities. For example, an external research project may be initiated to gain competitive information and influence product development. In another scenario, market intelligence may support a decision that has already been made, offering confirmatory evidence from internal sources.
Due to the growing application of use of different sources of market intelligence, industry practitioners and businesses have sought to understand the value of data analysis and ask questions about the most effective application of data insights in business. That is not to say that market intelligence is not valuable, but as technology and business activities change, there is a need to clarify the role and application different data sources in business decision making.
2.1 The Size of the Market Intelligence Industry
To set a baseline for understanding the market intelligence industry at a macro level, this paper considered the revenue change of the research industry for insight into financial viability, the growth of analytics technologies and references to spending on market intelligence. There is a body of literature across various industries that linked value perception to profitability and revenue. (Hallowell, 1996; Claessen et. al., 2003)
Spending on various market intelligence technologies has been predicted to grow rapidly by various authors and industry analysts. The market research industry was arguably one of the earliest industries to formalise around offering market intelligence services to businesses. Therefore, this paper first considered the growth of market research industry.
recorded revenue of $10.9 Billion USD. In 2007, ‘Marketing Research and Public Opinion Polling’ businesses recorded industry revenue of $15.5 Billion USD. Between 1997 and 2007, that represents a compound annual growth rate (CAGR) of 7%.
The number of establishments (a single physical place of business where the services are conducted) grew from 4,030 in 1997 to 5,823 in 2007 at a CAGR of 4%. The ‘Marketing Research and Opinion Polling’ industry also employed nearly 118,000 people in 2007 according to the US Census Bureau.
By comparison, the Market Research Society (MRS) in the UK undertakes a survey of UK market research each year. This showed the industry revenue grew 2.8% in 2010 after inflation after a 3.7% decline in 2009. (Bain, Tarran and Verrinder, 2011) The European Society for Opinion and Marketing Research (ESOMAR) showed that market research recovered well from the global financial crisis in 2009. ESOMAR’s Global Market Research report (2011) pointed to a net growth rate of 2.8% (adjusted for inflation) for the global market research economy in 2010. Regionally, North American market research firms regained ground by growing 3.1% in 2010; the Asia Pacific market research industry grew 3.5% over the same time period and Latin America, despite being a smaller market, grew a staggering 13.9%. ESOMAR’s 2010 report showed that the global market research economy contracted -4.6% in 2009 so a 2.8% gain the following year is a positive sign for the industry that registered consistent growth rates up until the financial crisis period.
Discounting the macro-economic financial crisis of 2009, these figures were a positive indicator for the market intelligence industry. Data indicates that each year has provided consistent revenue growth, suggesting that market research is an intrinsic component of commercial economies in markets like the US, Europe and others.
companies were “winning work away from bigger competitors as another fortunate by-product of the recession.” (Bain, Tarran and Verrinder, 2011) This example points to the dynamic and changing nature of the market intelligence industry.
Expanding the literature to cover other market intelligence sectors beyond market research, Columbus (2014) provided a round-up of some global spending predictions for analytics, big data and business intelligence areas. He noted that these market intelligence areas had attracted increasing investment and attention from businesses. Columbus argued that “analytics was now essential for any business looking to stay competitive.” (Columbus, 2014) He goes on to comment that analytics and market intelligence more broadly had generated a high level of awareness and hype, this had led to departmental transformations such as marketing divisions moving away from traditional tactics to more data-driven methods. All of which have driven spending on market intelligence data generation and businesses seeking access to an increasing number of data sources.
For example, “the advanced and predictive analytics (APA) software market was projected from grow from $2.2 Billion USD in 2013 to $3.4 Billion USD in 2018, attaining a 9.9% compound annual growth rate (CAGR) in the forecast period.” (Columbus, 2014) Additionally, the cloud-based business intelligence sector was projected to grow from just $0.75 Billion USD in 2013 to $2.94 Billion USD in 2018, representing a compound annual growth rate of 31%. IDC supported these forecasts with their own high growth figures, predicting the “Global Big Data technology and services revenue will grow from $14.26B in 2014 to $23.76B in 2016, attaining a compound annual growth rate of 18.55%.” (IDC, 2014; p. 6)
time-to-market and increasing product quality to financial services firms seeking to [use new data sources] to upsell clients.” (Columbus, 2014)
Understanding the size of spending on market intelligence as well as the growth of this industry sector was important background context. These sources showed that market intelligence had become a large economic sector with high levels of growth predicted by various industry analysts. These figures showed that businesses had placed an increased level of importance on market intelligence, reflecting this with a large and growing financial investment in this area. The references also highlighted a changing landscape of market intelligence with newer technologies available to businesses. These changes in the market intelligence sector ultimately impacted how data was used in decision making.
2.2 Open Market Intelligence Industry Created by Technology Shifts
Technology has had a profound impact on data use in business, changing almost every component of the analysis process including methodologies, data delivery and data analysis. In some cases, technology has helped streamline the research process. For example, software tools were now used to calculate results like statistical significance in seconds and some had built-in analysis functions such as margin of error calculations or mean survey scores. CRM platforms now included data dashboards and tools for running basic business analysis such as simple forecasting. Traditionally, these calculations were done manually by researchers or analysts. In other areas, such as the survey market, technology has put pressure on the market intelligence industry by making research tools open to a broader market.
opened up market research services to a wider user-base and the impact has been significant, with companies like SurveyMonkey showing success in disrupting the market research industry.
TechCrunch, a news site for technology, wrote that SurveyMonkey was “growing like a weed” (TechCrunch, 2009) and that SurveyMonkey’s revenue was on the rise. In 2008, revenue numbers for SurveyMonkey were in the region of $30 million (USD). Shortly after, TechCrunch noted that SurveyMonkey would likely reach $45 million in 2009. Bloomberg (2011) more recently reported that SurveyMonkey has some 8 million users with 35 million surveys created monthly.
The success of SurveyMonkey and similar do-it-yourself (DIY) survey building companies has drawn criticism from the research community who voiced concerns about poor quality questionnaires, commoditised data collection and a detrimental impact on the value of research services.
Quirks Marketing Research Review (2011) interviewed several researchers about the development of market research over the past 25 years in their October 2011 edition. The issue of DIY surveys was a central focus and, in the article, several veteran researchers discussed the impact of DIY tools on market research:
“As a discipline, it is [market intelligence] on the decline. DIY, low-budget data collection that takes serious shortcuts and wanna-be [sic] moderators are all examples of where the discipline itself has fallen on hard times – anyone can write and program a questionnaire, pay $4 a person for crappy [sic], no-quality-control online sample and generate research.” (Sellers, 2011)
Poynter (2011) also mentioned DIY research tools in his paper entitled “What is next in online and social media research?” as one of the factors that had impacted market intelligence. Poynter noted a growing number of organisations were conducting research using internal resources meaning that there was less exclusivity on surveys and analysts were now competing with their clients. Today, organisations have a choice on ways to meet their research needs including the option to run the survey internally through a low cost tool such as SurveyMonkey. This open research industry has forced the issue of value and puts pressure on the market intelligence industry to justify its premium cost over using DIY tools.
Poynter also commented that more and more businesses in related industries were offering self-serve research and analysis options that have increased the prevalence of DIY market intelligence. He noted that mainstream research panel supplier companies were looking to capitalise on the DIY trend by offering self-serve options to businesses. Other non-research companies, like customer relationship management (CRM) system providers, were also offering market intelligence tools as an add-on to their software, including surveys add-ons, analysis tools and forecasting features – showing a convergence between research and other business areas.
Market intelligence deployed in larger software packages, like CRM systems, has shown a growing convergence and positions market intelligence as one component of a wider service product. Similar to DIY survey tools, this has removed the exclusivity of market intelligence methods and analysis is no longer the exclusive domain of agencies offering market intelligence services. Other professionals who may not have any formal research training, such as a CRM system manager, are able easily deploy market intelligence tools (such as surveys) that previously were under the sole-ownership of trained market intelligence professionals. This detracts from the need to use a third party to conduct surveys or market intelligence projects and shifts the value to an internal function.
researchers have been disintermediated from the research process by cheaper tools based on modern technology platforms.
In the Quirks Marketing Research magazine article that asked some market research commentators to review the past 25 years, Mace was quoted as saying “[we blew it by] not making the transition [to the web] as an industry sooner. We allowed technology-based companies, not research companies, to take the lead in our backyard. This caused innumerable quality assurance issues and the need for end users to question the value of our reporting.” (Quirks Marketing Research, 2011; p. 27)
Poynter (2011) wrote that the impact of DIY research and analysis on the market intelligence industry has yet to be fully understood but suggests that it could lead to one of several possibilities. One option was that businesses will realise the need for higher quality research and analysts will shift from market research agencies to going in-house. Another option was that DIY research will continue to grow and that businesses will trade quality for cost-savings, settle for simpler studies and potentially more analysis errors. The final option from Poynter was that DIY research will plateau and then decline as businesses take on “more work than most of them can handle and as problems start to occur.” (Poytner, 2011; p. 7)
Korostoff (2010) suggested that DIY research tools could benefit the market intelligence community. She wrote that there was an opportunity in DIY platforms for researchers to support businesses and that DIY market intelligence was evidence that customer feedback was important and was becoming an essential part of many job roles. Korostoff made the point that DIY tools had become a ‘scapegoat’ of the market intelligence industry but relates this to a time when online surveys first appeared. “A lot of CATI-centric [computer aided telephone interviews] researchers balked and online panels repulsed many researchers but both online research and panels were now a huge part of the industry” (Korostoff, 2010) and had become a staple tool for many research agencies.
This included understanding why businesses used DIY tools, how they framed business questions and how they approached the DIY research exercise in order to understand how the market intelligence industry might better meet their needs to complement DIY research tools.
However, as the DIY market progresses, there has been a clear impact from these developments on the wider market intelligence industry. Research companies were previously the only organisations able to execute surveys and other data gathering methods. Technology developments and market shifts have changed that. New vendors have emerged that not only move the ability to execute survey-based research to a wider audience but they have created new competitors such as internal business functions that were once the research clients. These businesses now have the option to run their own research and analysis, diminishing the need and value of the traditional research agency. Businesses have also invested in internal analytics and business intelligence technologies.
This section showed that business leaders were confronted with a market intelligence industry that has changed rapidly and the variety of data sources had changed along with it. Previously, market intelligence was exclusively provided by market research firms. However, technology had increased both the volume of data and the availability of different forms of market intelligence. Business leaders can now access market intelligence from external agencies, internal analytics teams or run their own intelligence-gathering projects through technology platforms like CRM systems that incorporate analysis and survey tools. This has had the effect of eroding the premium of market intelligence data collection and analysis. At the same time, it increased the importance of businesses to monitor how data was used in decision making. The complex array of data sources has increased the difficulty for business leaders to know what data source was best suited to a business problem.
2.3 Pressure to Show ROI and Value
fell to $28.9 billion in 2009 representing “a year-on-year decline of -3.7% and -4.6% after adjustment for inflation; a significant drop but in line with expectations given the economic downturn.” (ESOMAR, 2010; p.1)
Phillips (2011) noted that the economic downturn increased scrutiny and pressure to market intelligence costs. This change meant the need to prove their value like other cost centres such as marketing and advertising. The GFC created a new focus on measuring value and returns and Phillips (2011) quoted one company that said “if it cannot be measured now [after the downturn], it is cut.” This was part of what Phillips labels as the perfect storm for market research with three external factors contributing to increased measurement and focus on value. The first was that businesses are being measured as a result of financial crisis and more services are expected to contribute to the bottom line. The second factor was that other elements of marketing can now be measured in much more detail – digital marketing for example is heavily tracked and analysed. The third factor was that the insights were becoming a competitive advantage for businesses when linked with business objectives.
The financial crisis and external financial pressures led to clients expecting more value from their intelligence for less money. In the 2012 Greenbook Industry Trends (GRIT) Report, 79% of research buyers noted cost as being the driving factor in choosing a research method. (GRIT, 2012)
Verrinder (2010) also commented that there was an increased focus on research costs at many firms. He cited Jacobs, author of a guidebook for the advertising industry on commissioning market research, who noted that procurement departments want to know what differentiates market research from buying a fleet of vans and they wanted to know what benefits were being brought in, with more expected from limited budgets.
Whether this practice of off-shoring research did have the expected impact remains to be seen but was an indication of the pressure put on market intelligence due to financial circumstances and clients wanting more for less. As the industry worked to handle the economic pressure, these comments showed that business enthusiasm for market intelligence was tempered by the requirement for marketing intelligence to justify the benefits through showing ROI and business value.
Murphy (2007) provided a good summary on the economic pressures and their impact on research. He noted that “tight client budgets and procurement in RFPs (request for purchase) have led to increased low-cost bidding.” (Murphy, 2007; p. 70) Murphy argued that a casualty of cost management has been rigorous sample design with “fewer business executives recognize or demand rigorous research.” (Murphy, 2007; p. 70)
This was supported by Kirch (2007) who wrote, “price has become such a driving factor on who wins a job that it is increasingly difficult for firms that are truly quality-driven to be competitive, unless they implement cost-cutting and/or corner-cutting procedures.” (Kirch, 2007)
Phillips (2011) noted that buyers and suppliers of market research were struggling to define the business impact of research and that time may be running out as there is increased competitive pressure from technology platforms, DIY sources and other data sources. However, it was difficult for market intelligence to quantify ROI because of the mixed use-case and wide-reaching impact of data analysis. For example, it was difficult to quantify the ROI where a company decided to stop the development on a product because research showed that the product would not do well commercially. In this instance, there could be considerable cost savings from a failed product launch but the extent of those financial savings and the associated value of the research exercise were hard to measure.
More than half expected this to be the case in 2012 as well, with an emphasis on showing how they are improving key performance indicators and return on investment.” (Reitsma, 2011)
Duke (2004) argued that creating economic value from market intelligence required four activities: selecting a strategy for accomplishing the goal, creating potentially valuable new knowledge and intellectual property, connecting the knowledge to a market demand with a complete value chain (profitable business decision), and orchestrating the flows of money and customer service to make a profit. Duke ultimately linked the economic value of the knowledge to a competitive advantage whether that advantage was creating a new product or by moving into a more profitable space. He linked this entire process closely with a business plan that accounts for all expenses including the investment.
The example Duke used is that of Xerox who introduced a plain paper copier in 1959 but found, through market intelligence, that they needed to invent a new business model that involved renting the copier under contract. This was different to the standard model at the time, which was to sell the copier, service and supplies separately. Research showed that a few thousand copiers could be sold at a fixed profit, however, exponentially more could be rented out at a greater profit due to re-renting machines and upgraded contracts. This example showed one way to demonstrate the ROI of research might be to look at competing scenarios and the additional profit the research enabled by helping Xerox discover a new business model and profit generation scheme.
Hagins (2010) noted that most organisations did not measure market intelligence ROI because it was hard to do. He hypothesised that “failure to demonstrate the economic value of research has led to the commoditisation of the research function in many departments where the focus is on cost savings.” (Hagins, 2010)
Bain (2011a) reported that researchers were encouraged to learn the language of the Chief Executive Officer (CEO) and Chief Financial Officer (CFO) at the ESOMAR conference in 2011. That meant “translating percentages and margins of error into Pounds, Euros and Dollars” (Bain, 2011a) with more effort put into demonstrating the ROI to the CFO.
Defining exactly what the return might include also compounds the complexity of showing ROI and value on research. In a paper about evaluating research and development, Hauser and Zettelmeyer (1996) categorised research into three tiers with different metrics defining success and return at each tier level. Tier 1 was basic research that was broad and applicable to many business units, such as general brand association research. Tier 2 was research matched to the core competencies of the organisation, such as a technology company running competitive analysis on functionality. Tier 3 was defined as specific projects focused on the immediate needs of a business unit, such as measurement of a recent social media campaign. Hauser and Zetterlmeyer found that the research tier affects the key performance indicators used by a business.
They also commented that the way research was funded had an impact on how the research was valued. They noted that business units were better able to judge research and development projects if they had not paid the full cost and were asked to pay only a proportion. They also found that there was a bias toward short-term, narrow projects with predictable outcomes that made it difficult for broader research, such as Tier 1 projects, to define and demonstrate ROI value.
was “proportional to the manager’s uncertainty about which way to go, not to the uncertainty about the future.” (Andreasen, 1983)
Hagins (2010) argued that showing ROI for research needs to be linked to one or more business impacts with many ways to calculate research value. Some of the examples given included:
Cost Reduction – research driving cost savings resulting from the elimination of an
unnecessary feature or service element
Customer Retention – quantifying the revenue associated with saving high-risk customers
or high-risk customer segments through improvement
Sales Promotion – quantifying the economic value of inclusion of research in sales
presentations, white papers or helping support sales meetings
Hagins (2010) suggested taking a conservative approach to ROI projections a way to maintain credibility and that it was worthwhile starting the ROI evaluation process even if the methodology was not perfect. “Organisations that made the attempt [at ROI] were given respect even though the methodology was not perfect because they made the effort.” (Hagins, 2010; p. 52)
This section showed that the perceived cost of a data source was an important consideration with respect to data use. The literature also highlighted that the perception of market intelligence had possibly changed from rigorous, lengthy research projects toward fast, analytical projects that provide quicker and cheaper data insights. This had potential implications around data selection in decisions. For example, business leaders may select digital analytics to answer business questions over a qualitative market research project based on cost perceptions. The result being that a data source was chosen based on cost instead of merit, and therefore may not provide the most accurate data insights.
Organisational structure has been shown to significantly affect what data sources were selected and how market intelligence is used in business activities. Bednall and Valos (2005) conducted research into how structure and resource allocation impacted the perceived effectiveness of market intelligence. Their results found “market research effectiveness cannot be judged merely on the basis of the technical qualities of the project or the innovativeness of the design ... strategic intent also needs to be taken into consideration.” (Bednall and Valos, 2005; pp. 25 – 26)
Bednall and Valos (2005) found that having a dedicated group contributed to the value placed on market intelligence efforts. “Those with no dedicated market research people or those with part-time staff were less likely to see market research as being valuable.” (Bednall and Valos, 2005; p. 22) Bednall and Valos linked this with the dedicated group’s ability to gain marketing knowledge and “in assisting the marketing group and the marketing manager to promote their business cases within their organisation.” (Bednall and Valos, 2005; p. 25) An important implication of this finding was that the perception of research effectiveness has a considerable impact on strategic decision-making.
When looking at organisational type, Bednall and Valos (2005) found that entrepreneurial Prospector organisations were most likely to see market intelligence as effective at gaining useful insight, providing value to other data sets and in supporting business decisions. Entrepreneurial Prospector organisations were described as businesses that achieve competitive advantage by “being first into new markets with new products.” (Bednall and Valos, 2005; p. 12) Defender organisations, in contrast, looked to achieve competitive advantage by being more efficient in existing markets with current products. Bednall and Valos noted that Defender organisations were more likely to use confirmatory research or to use it as political support to bolster a position within the company.
dynamic and competitive environment require research for immediate action and look for data insights that drive decisions.
Furthermore, the research buying role title at an organisational also had an observed impact on the judged effectiveness of research projects. “More modern titles like analytics manager or consumer insights manager were related to higher levels of effectiveness” (Bednall and Valos, 2005; p. 25) suggesting the need for market intelligence to be continually reassessed so that the research department did not take on a defensive role.
A paper on the effect of organisational demographics and structure on the use of consumer insight by the Boston Consulting Group supported these findings. Boston Consulting Group’s research (2009) found four stages that described how the consumer insights team was used within the organisation. Stage one was a traditional market intelligence function where a research insights team had little access to senior executives and was mainly used by the marketing function. The use of research by sales and product teams was limited and research did not have much impact beyond marketing. Stage two was the business contribution team where there was collaboration at a senior level but the focus was still on individual research and data was not correlated with profit drivers and competitive knowledge, for example. This limited the impact of consumer insights. Boston Consulting Group (2009) found that 90% of companies were in stage one or two.
Stage three was characterised by a stronger consumer insight focus by executives, significant influence beyond marketing and a growing knowledge base that allowed the company to get much closer to market trends and their customers. Stage four was an enhanced version of stage three where consumer insights were a strong focus for the most senior business leaders and data use was involved in every aspect of the business including business planning and product development. Data was synthesised not only for reactionary projects but also long term planning and leapfrogging the competition.
four “suffer from the curse of low expectations from line management.” (Boston Consulting Group, 2009; p. 15) The Boston Consulting Group study also pointed a gap in the perception of the insights function at an organisation between line managers and research insights professionals. This perception gap potentially prevented the insights team from being involved more widely in the organisation because research insights professionals were not meeting the needs of business managers. As an example, 73% of research insights personnel felt that they “consistently answer the question ‘so what?’ about the data they provide” whereas only 34% of Business Line personnel agreed – showing a gap of 39 percentage points. Boston Consulting Group noted a number of common themes from their interviews with Business Line personnel and Insights personnel, including:
“I am so tired of getting reams of data from the research work…I need to know the one or two key learning’s that affect my brand, and a high level recommendation on what I should do next. Brand manager in the travel industry.” (Boston Consulting Group, 2009)
“We talk about customer preference, choice, satisfaction, and needs, but those things take a back-seat position to things that we are more comfortable with, such as profitability; to win, we have to address the consumer head-on. Business-unit leader in the financial services industry.” (Boston Consulting Group, 2009)
Yaman (2004) summarised the impact of the organisation dynamic saying, “the organisation’s resources and skills influence the types of research techniques used and ultimately affect the acquisition and utilisation of marketing research projects. The most sophisticated techniques recognized and/or adopted by decision-makers may be indicative of the innovativeness [and structure] of the organisation.” (Yaman, 2004; p. 14)
These reference