ePrints Soton
Copyright © and Moral Rights for this thesis are retained by the author and/or other
copyright owners. A copy can be downloaded for personal non-commercial
research or study, without prior permission or charge. This thesis cannot be
reproduced or quoted extensively from without first obtaining permission in writing
from the copyright holder/s. The content must not be changed in any way or sold
commercially in any format or medium without the formal permission of the
copyright holders.
When referring to this work, full bibliographic details including the author, title,
awarding institution and date of the thesis must be given e.g.
AUTHOR (year of submission) "Full thesis title", University of Southampton, name
of the University School or Department, PhD Thesis, pagination
The Structure and Behaviour of
the Continuous Double Auction
by
Perukrishnen Vytelingum
A thesis submitted in partial fulfillment for the degree of Doctor of Philosophy
in the
Faculty of Engineering, Science and Mathematics School of Electronics and Computer Science
Intelligence, Agents, Multimedia Group
ABSTRACT
FACULTY OF ENGINEERING, SCIENCE AND MATHEMATICS SCHOOL OF ELECTRONICS AND COMPUTER SCIENCE
Doctor of Philosophy
by Perukrishnen Vytelingum
The last decade has seen a shift in emphasis from centralised to decentralised systems to meet the demanding coordination requirements of today’s complex computer sys-tems. In such systems, the aim is to achieve effective decentralised control through autonomous software agents that perform local decision-making based on incomplete and imperfect information. Specifically, when the various agents interact, the system behaves as a computational ecology with no single agent coordinating their actions. In this thesis, we focus on one specific type of computational ecology, the Continuous Double Auction (CDA), and investigate market-oriented approaches to decentralised control. In particular, the CDA is a fixed-duration auction mechanism where multiple buyers and sellers compete to buy and sell goods, respectively, in the market, and where transactions can occur at any time whenever an offer to buy and an offer to sell match. Now, in such a market mechanism, the decentralised control is achieved through the de-centralised allocation of resources, which, in turn, is an emergent behaviour of buyers and sellers trading in the market. The CDA was chosen, among the plenitude of auction formats available, because it allows efficient resource allocation without the need of a centralised auctioneer.
Against this background, we look at both the structure and the behaviour of the CDA in our attempt to build an efficient and robust mechanism for decentralised control. We seek to do this for both stable environments, in which the market demand and supply do not change and dynamic ones in which there are sporadic changes (known as market shocks). While the structure of the CDA defines the agents’ interactions in the market, the behaviour of the CDA is determined by what emerges when the buyers and sellers compete to maximise their individual profits.
market efficiency, fairness of profit distribution among agents and market stability). Second, we use this modified protocol to efficiently solve a complex decentralised task allocation problem with limited-capacity suppliers that have start-up production costs and consumers with inelastic demand. Furthermore, we demonstrate that the structure of this CDA variant is very efficient (an average of 80% and upto 90%) by evaluating the mechanism with very simple agent behaviours. In so doing, we emphasise the effect of the structure, rather than the behaviour, on efficiency.
List of Figures xi
List of Tables xii
Nomenclature xii
Acknowledgements xv
1 Introduction 1
1.1 The Continuous Double Auction . . . 3
1.2 Research Aims . . . 6
1.3 Research Contributions . . . 8
1.4 Thesis Structure . . . 11
2 Literature Review 13 2.1 Background on the Microeconomics of Markets . . . 13
2.2 The Structural Aspect of the CDA . . . 17
2.2.1 Designing Pricing Rules . . . 19
2.2.2 Improving Pricing and Shout Improvement Rules . . . 21
2.3 The Behavioural Aspect of the CDA . . . 24
2.3.1 Agent-Human Strategic Interaction . . . 25
2.3.2 Methodologies for Designing Bidding Strategies . . . 26
2.3.3 Categorising Bidding Strategies . . . 26
2.3.4 Examples of Bidding Strategies . . . 28
2.3.4.1 Kaplan . . . 28
2.3.4.2 Zero-Intelligence . . . 28
2.3.4.3 Zero-Intelligence Plus . . . 31
2.3.4.4 Gjerstad-Dickhaut . . . 35
2.3.4.5 Fuzzy Logic . . . 42
2.3.5 Evaluating Strategies . . . 49
2.3.5.1 Homogeneous Populations . . . 49
2.3.5.2 Heterogeneous Populations . . . 50
2.4 Summary . . . 56
I
THE STRUCTURAL PERSPECTIVE
59
3 Designing a CDA Mechanism for Limited-Capacity Suppliers 61
3.1 The Market Allocation Problem . . . 62
3.2 The Centralised Allocation Mechanism . . . 63
3.3 The Decentralised CDA-Based Allocation Mechanism . . . 65
3.4 Evaluating the Decentralised Mechanism . . . 68
3.4.1 The ZI2 Bidding Strategy . . . 69
3.4.2 The Experimental Setup . . . 71
3.4.3 The Empirical Study . . . 72
3.5 Summary . . . 75
II
THE BEHAVIOURAL PERSPECTIVE
77
4 A Framework for Designing Bidding Strategies 79 4.1 The IKB Model . . . 804.1.1 The Information Layer . . . 83
4.1.2 The Knowledge Layer . . . 84
4.1.3 The Behavioral Layer . . . 84
4.2 Applying the Model to the CDA . . . 86
4.3 Designing a Trading Strategy for TAC . . . 90
4.3.1 The Behavioural Layer . . . 91
4.3.2 The Knowledge Layer . . . 93
4.3.3 The Information Layer . . . 93
4.4 Summary . . . 94
5 An Adaptive-Aggressiveness Bidding Strategy 95 5.1 Bidding Aggressiveness . . . 96
5.2 The Bidding Strategy . . . 98
5.2.1 The Equilibrium Estimator . . . 100
5.2.2 The Aggressiveness Model . . . 100
5.2.3 The Adaptive Component . . . 104
5.2.3.1 Short-Term Learning . . . 104
5.2.3.2 Long-Term Learning . . . 106
5.2.4 The Bidding Component . . . 107
5.3 Summary . . . 110
6 A Framework for Analysing Strategic Behaviours 112 6.1 A Two-Population EGT Model . . . 113
6.1.1 Computing the Heuristic Payoff Table . . . 114
6.1.2 The Equilibrium Analysis . . . 115
6.1.3 The Dynamics Analysis . . . 116
6.2 Applying the Model to the CDA . . . 116
6.2.2 Comparison with the One-Population EGT Model . . . 118
6.3 Summary . . . 120
7 Analysing the Effectiveness of the AA Strategy 122 7.1 The Experimental Setup . . . 122
7.2 Homogeneous Populations . . . 126
7.2.1 The Static Scenario . . . 126
7.2.2 The Dynamic Scenario . . . 128
7.3 Heterogeneous Populations . . . 131
7.3.1 The Static Scenario . . . 131
7.3.2 The Dynamic Scenario . . . 134
7.4 Summary . . . 136
8 Conclusions 138 8.1 Research Achievements . . . 138
8.2 Future Work . . . 140
A Examplar Strategy Profile for EGT Analysis 142
B Evaluating Strategies within Heterogeneous Populations 145
2.1 Demand and supply curve. . . 14 2.2 Demand and supply curve. p∗ lies betweenp∗sandp∗b. . . 15 2.3 Example of a market shock. The red full line represents the transaction
prices, while the dashed and black line represents the competitive mar-ket equilibrium price. p∗ increases from 2.0 to 3.0 as from transaction 62. . . 17 2.4 FitnessV (with standard deviation) plotted against k for a market of 12
traders (taken from (Phelps et al., 2003)). . . 20 2.5 Transaction prices, plotted as 10 different runs, for the KPricingPolicy
(in (a) and (b)) and for the NPricingPolicy (in (c) and (d)) (taken from (Parsons et al., 2006)). . . 22 2.6 Metrics for KCDAs, nCDAs and nCDAEEs measured over 10
trad-ing days. Bold face indicates the correspondtrad-ing market outperforms or equals its kCDA counterpart. Bold italic points out the best results in the ZI-C and GD markets (taken from (Parsons et al., 2006)). . . 22 2.7 Result from one of Gode and Sunder’s experiments (taken from (Gode
and Sunder, 1993)). Results from ZI-U (top), from ZI-C (middle) and from human traders (bottom). Plots on the left-hand side show the de-mand and supply used in the experiments and those on the right-hand side are the history of transaction prices for the different populations. . . 29 2.8 The ZIP Trading Strategy. . . 32 2.9 The right panel shows the results from simulations with ZIP traders
(taken from (Cliff and Bruten, 1997)). The left panel illustrates the demand and supply used for the first 11 trading periods. Thereon, the competitive equilibrium price is increased to 225. . . 34 2.10 A typical belief function of a buyer (function q(b)on the right) and a
seller (functionp(a)on the left). . . 37 2.11 Left panel illustrates demand and supply of the market. Note the change
in demand and supply (after 5 trading days). D denotes the demand curve, S the supply curve, P price and Q quantity. Results from market simulations with GD traders are shown in the right panel. The x-axis is divided into the different trading days, with the x-axis values corre-sponding to transacted quantities for each period (taken from (Gjerstad and Dickhaut, 1998)). . . 39 2.12 Calculating V(m, n) using a dynamic programming algorithm (taken
from (Tesauro and Bredin, 2002)). . . 40
2.13 An example of a GDX bid price based on the number of bidding oppor-tunities (taken from (Tesauro and Bredin, 2002)). . . 40 2.14 The average profit difference between GD and GDX in a balanced
het-erogeneous population, over 1000 runs. Each agent has a single unit to trade and the theoretical population surplus is 1500.0 (taken from (Tesauro and Bredin, 2002)). . . 41 2.15 The average difference between GD and GDX in a balanced
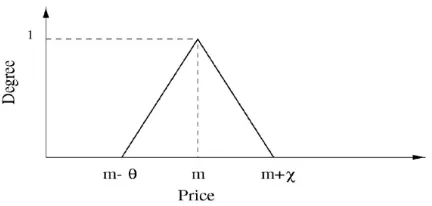
heteroge-neous population, over 1000 runs. Each agent has 10 units to trade and the theoretical population surplus is 1500.0 (taken from (Tesauro and Bredin, 2002)). . . 42 2.16 Triangular fuzzy numberz = (m, θ, χ)(taken from (He et al., 2003)). . 43 2.17 Fuzzy heuristic rules for the FL buyer (BR1andBR2) and the FL seller
(SR1andSR2). . . 44 2.18 Fuzzy sets in heuristic rules (taken from (He et al., 2003)). (a)
Out-standing bid is much bigger than PR (SR1). (b) Outstanding ask is
much smaller thanPR(SR2). (c) Outstanding ask is much smaller than
PR (BR1). (d) Outstanding bid is much bigger thanPR (BR2) (taken
from (He et al., 2003)). . . 45 2.19 Fuzzy Rule Base for FL buyers. . . 45 2.20 Fuzzy Rule Base for FL sellers. . . 46 2.21 Fuzzy sets used in fuzzy reasoning (taken from (He et al., 2003)). . . . 46 2.22 Utility functions of FL agents with different risk attitudes: risk-neutral
(N), risk-seeking (S) and risk-averse (A) (taken from (He et al., 2003)). 47 2.23 Two fuzzy sets for transaction rate. This rate is calculated by the
num-ber of transactions made by an agent divided by the total transaction numbers in the market after the latest change of the FL agents attitude towards risk (taken from (He et al., 2003)). . . 47 2.24 Learning rule of the FL agent. A(attitudei) denotes the attitude of agenti,
ris the learning rate, andδis the minimum change in the risk attitude. . 47 2.25 Performance of agents with different strategies (taken from (He et al.,
2003)). The horizontal axis represents the demand and supply of the market and the vertical axis represents the total profit of the correspond-ing agent uscorrespond-ing a specific strategy in one session. Panel (a) shown buy-ers’ total profits and panel (b), sellbuy-ers’ total profits. . . 48 2.26 (a) The replicator dynamics of a 20-agent CDA. Here, there are two
attractors: A and C and a saddle point: B. (b) Replicator dynamics if the payoffs were perturbed such that 5% of the payoffs of Kaplan and ZIP were transferred to GD (taken from (Walsh et al., 2002)). . . 54 3.1 Pseudo-code representing the dynamic programming solution to find
the optimum centralised solution in pseudo-polynomial time. . . 65 3.2 Panel A shows the demand and supply (curves) of the order book, with
3.4 Optimal and CDA production cost for 3 buyers and 3 sellers in (a) and 15 buyers and 15 sellers in (b). . . 73 3.5 Average market efficiency for 3 buyers and 3 sellers in (a) and 15 buyers
and 15 sellers in (b). . . 73 3.6 Performance of the decentralised mechanism in markets with different
numbers of buyers and sellers. . . 74 3.7 The profit distribution among buyers and sellers in markets A and B. . . 75 4.1 Structure of the IKB Model. . . 82 4.2 Structure of the WhiteDolphin Strategy for the TAC Travel Game. . . . 91 5.1 The AA bidding strategy. . . 99 5.2 Aggressiveness for the intra-marginal trader for differentθ. Solid lines
represent the buyer’s function, and the dashed lines, the seller’s function. 101 5.3 Aggressiveness for the extra-marginal traders for differentθ. Solid lines
represent the buyer’s function, and the dashed lines, the seller’s function. 103 5.4 Short-Term Learning Rules. . . 105 5.5 Functionθ∗(α)gives the desiredθ∗. . . 107 5.6 The history of transaction prices andpˆ∗ (top plot), the short-term
learn-ing of r (middle plot) and the long-term learning of θ (bottom plot). Note that we have a market shock after transaction 54, withθ updated to match the change in price volatility. . . 108 5.7 Bidding Rules. . . 109 6.1 The replicator dynamics for a dynamic market with AA and GDX
buy-ers and sellbuy-ers. Here, we have three attractors: A at (1,1), B at (0,0) and C at (0,1) and two saddle points: D at (0.19,1) and E at (0,0.40). The dotted line denotes the boundary between the basins of attraction. . . . 119 6.2 The magnitude of the buyer’s and seller’s dynamics. . . 119 6.3 A one-population EGT analysis. We have two attractors: A0 at 1 and B0
at 0 and a saddle point: C0at 0.30. . . 120 7.1 Demand and supply of Markets M1, M2, M3 and M4. . . 124 7.2 Example of a transaction history with scenario MS14. . . 125 7.3 Scenario MS14. The market efficiency of AA is 0.992, of ZIP, 0.979
and of GDX, 0.988. If we consider the static scenario for Market M1, the market efficiency of AA is 0.997, of ZIP 0.982, and of GDX 0.990. . 128 7.4 Scenario MS21. The market efficiency of AA is 0.993, of ZIP 0.974,
and of GDX 0.987. If we consider the static scenario for Market M2, the market efficiency of AA is 0.992, of ZIP 0.971, and of GDX, 0.981. 128 7.5 Scenario MS31. The market efficiency of AA is 0.996, of ZIP 0.968,
and of GDX 0.987. If we consider the static scenario for Market M3, the market efficiency of AA is 0.996, of ZIP 0.960, and of GDX 0.981. . 129 7.6 Scenario MS23. The market efficiency of AA is 0.994, of ZIP 0.968,
7.7 Scenario M1 with AA and ZIP agents. Here, we have a single dominant strategy at (0,0). The magnitudes of the buyer’s and seller’s dynamics are of comparable magnitude. . . 132 7.8 Scenario M1 with AA and GDX agents. The replicators converge
to-wards the single mixed-Nash equilibrium A at (0.96,0.79). Thus, buyers and sellers are more likely to adopt the AA strategy, with a relatively small proportion adopting the GDX strategy. The magnitudes of the buyer’s and seller’s dynamics are comparable. . . 132 7.9 Scenario M2 with AA and ZIP agents. Here, we have a dominant
strat-egy at (0,0). All buyers and sellers eventually adopt the AA stratstrat-egy. The magnitude of the seller’s dynamics is considerable smaller than that of the buyer’s. . . 133 7.10 Scenario M2 with AA and GDX agents. Here, we have two attractors:
A at (1,1) and B at (0.92,0), and a saddle point C at (0.93,0.10). The area of the basin of attraction for A is 0.884, and for B is 0.116. The magnitude of the seller’s dynamics is higher when GDX buyers are in majority, and considerably lower as AA buyers are represented more. . . 133 7.11 Scenario MS14 with AA and ZIP agents. Here, we have two attractors:
A at (0,0), B at (1,1) and a saddle point, C at (1,0.78). The area of the basin of attraction of A is 0.978, and that of B is 0.022. . . 135 7.12 Scenario MS14 with AA and GDX agents. Here, we have two
attrac-tors: A at (1,1), B at (0,0) and a saddle point, C at (0.0.34). The area of the basin of attraction for A is 0.935 and that of B is 0.065. . . 135 7.13 Scenario MS21 with AA and ZIP agents. Here, we have two attractors:
A at (0,0), B at (1,1) and a saddle point, C at (0.68,1). The area of the basin of attraction of A is 0.961, and that of B is 0.039. . . 136 7.14 Scenario MS21 with AA and GDX agents. Here, we have two
attrac-tors: A at (1,1) and B (0,0), and two saddle points: C at (0.55,0) and D at (0.33,0.11). The area of the basin of attraction of A is 0.869, and that of B is 0.136. . . 136 B.1 Scenario M1 with ZIP and GDX agents given a symmetric demand and
supply. The replicators converge towards the single mixed-Nash equi-librium A at (0,0). The magnitudes of the buyer’s and seller’s dynamics are comparable. . . 145 B.2 Scenario M2 with ZIP and GDX agents given a flat supply. Here, we
have a single attractor: A at (0,0). All buyers and sellers eventually adopt the GDX strategy. The magnitude of the seller’s dynamics is smaller than that of the buyer’s, though the different when compared to M1 (where the magnitude of buyer’s dynamics is smaller than that of seller’s) is fairly significant. . . 146 B.3 Scenario M3 with AA and ZIP agents. Here, we have one attractor: A
B.4 Scenario M3 with AA and GDX agents. Here, we have one attractor: A at (1,1) and one saddle point: B at (0,0.81). AA is a dominant strategy that will eventually be adopted in the market. . . 146 B.5 Scenario M3 with ZIP and GDX agents given a flat demand. Here,
we have a dominant strategy A at (0,0). The magnitude of the seller’s dynamics is considerable larger than that of the buyer’s because of the flat demand. . . 147 B.6 Scenario MS14 with ZIP and GDX agents. Here, we have two
attrac-tors: A at (0,0), B at (1,1) and two saddle points: C at (1,0.78) and D at (0.71,1). The area of the basin of attraction for A is 0.967 and that of B is 0.033. . . 147 B.7 Scenario MS21 with ZIP and GDX agents. Here, we have two
attrac-tors: A at (0,0) and B (1,1), and saddle points: C at (1,0.69), D at (0.70,1) and E which is a continuous line of equilibria represented by the dark line. The dotted line is the boundary between the basins of attraction of A and B. The area of the basin of A is 0.948, and that of B is 0.052. . . 147 B.8 Scenario MS31 with AA and ZIP agents. Here, we have two attractors:
A at (0,0) and B at (1,1) and a saddle point: C at (1,0.80). The proba-bility that mixed-Nash equilibrium A will be adopted is 0.952 and that B will be adopted is 0.048. . . 148 B.9 Scenario MS31 with AA and GDX agents. Here, we have three
attrac-tors: A at (1,1), B at (0,0) and C at (0,1) and two saddle points: D at (0.19,1) and E at (0,0.40). The probability that mixed-Nash equilibrium A will be adopted is 0.776, that B will be adopted is 0.125 and that C will be adopted is 0.099. . . 148 B.10 Scenario MS31 with ZIP and GDX agents. Here, we have three
attrac-tors: A at (0,0) and B at (1,1) and two saddle points: C at (1,0.76) and D at (0.71,1). The probability that mixed-Nash equilibrium A will be adopted is 0.962 and that B will be adopted is 0.038. . . 148 B.11 Scenario MS23 with AA and ZIP agents. Here, we have two attractors:
A at (0,0) and B at (1,1) and a saddle point: C at (0.80, 0.95). The probability that mixed-Nash equilibrium A will be adopted is 0.965 and that B will be adopted is 0.035. . . 149 B.12 Scenario MS23 with AA and GDX agents. Here, we have three
attrac-tors: A at (0,0), B at (1,1) and C at (0.32.0) and two saddle points: D at (0.37,0.04) and E at (0.03,0). The probability that mixed-Nash equi-librium A will be adopted is 0.010, that B will be adopted is 0.902 and that C will be adopted is 0.088. . . 149 B.13 Scenario MS23 with ZIP and GDX agents. Here, we have two
2.1 The average surplus difference when GD and GDX (γ = 0.9) compete against ZIP in a balanced heterogeneous population. The theoretical
population surplus is 2612.0. . . 42
3.1 Multi-unit CDA Order Book before clearing. . . 68
3.2 Multi-unit CDA Order Book after clearing. . . 68
3.3 A set of three producers bidding to satisfy a demand of 200 units. . . 71
4.1 Analysis of four CDA strategies under the IKB model. . . 88
7.1 Efficiency of strategies in homogeneous environments (over all trading days). . . 127
Chapter 2
I set of buyers
J set of sellers
I set of intra-marginal buyers J set of intra-marginal sellers p∗ competitive equilibrium price q∗ competitive equilibrium quantity
˜
p transaction price
k weight in k-pricing rule
α Smith’s coefficient of convergence or price volatility obid outstanding bid
oask outstanding ask
∆ minimum bid or ask increment
pmax maximum bid or ask allowed in the market
`i limit price of buyeri
cj limit (or cost) price of sellerj
Chapter 3
Cj cost function of supplierj
fj start-up cost of supplierj
xj quantity of production allocated to supplierj
uj marginal cost of supplierj
capj production capacity of supplierj
b bid price
a ask price
qb bid quantity
qa ask quantity
bid(qb, b, i) bid of buyeri
ask(qa, a, j) ask of sellerj
C[n, D] minimum total production cost given n suppliers and a total demand ofD qi demand of buyeri
Chapter 4
M the market
I the set of trading agents
A the set of actions of trading agents
g the good
B the set of buyers S the set of sellers
stateM(t) state of MarketMat timet exti external informationi
H(.) history
T(.) state transfer function
price(t) market price of good at timet bid(t) bid at timet
ask(t) ask at timet
ni(t) number of items to be bought or sold by trading agenti
vi set of limit prices of trading agenti
budgeti(t) budget available to agenti
compi(t) computational resources currently available to agenti
TCDA(.) state transfer function of CDA
Chapter 5
ˆ
p∗ estimate of competitive equilibrium price r degree of aggressiveness
τ target price
θ property of aggressiveness model
β1 learning rate of short-term learning mechanism
β2 learning rate of long-term learning mechanism
η rate of increase (or decrease) of bid or ask price
Chapter 6
As number of sellers
Ss number of strategies available to sellers
Sb number of strategies available to buyers
p buyer’s mixed strategy or buyers’ population mix q seller’s mixed strategy or sellers’ population mix
˙
p buyer’s dynamics
˙
q seller’s dynamics
I would first like to express my sincere thanks and gratitude to my supervisor Professor Nick Jennings for his encouragement, insightful advice and discussions, and for always encouraging me to look at the bigger picture. I also appreciate his impressive editorial effort and incisive comments which made the papers and this thesis so much clearer and concise. Over the past three years, his patient supervision has undoubtedly helped me develop my research skills.
I would also like to take the opportunity to acknowledge the people who have assisted me during the course of my PhD. Professor Dave Cliff has acted as a second supervisor over the past year, with some stimulating and insightful comments. The collaboration resulted in a number of co-authored papers. I would also like to thank my colleagues Raj Dash and Minghua He, with whom I co-authored different papers, and, who, with Adam Sykulski, were part of the WhiteDolphin team in the Trading Agent Competi-tion (Travel) 2006. Furthermore, I would also like to thank Alex Rogers and Gopal Ramchurn with whom I participated in the IPD competition.
I would also like to thank the DIF-DTC Project 8.6 for funding my PhD over the past three years. The agent-theme meetings of the project meant that I was able to interact with other research groups working on agent-based computing, while I also had the opportunity to engage with people from the industry and the Ministry of Defence. This allowed me to gain a better insight into the research from an industrial perspective. I also thank my friends Andrew, Ash, Gopal, Khalid, Niki, Raj and Vanessa, for their moral support and for making the past three years an enjoyable and enriching experi-ence, not to mention the LCU group and the IAM Social group for their social initiatives.
Last, but not least, I am most grateful to my mum and dad, my sisters Iovana and Ruby, as well as my aunts Rajamanee and Selvom and my uncle Bala for their love, affection and infallible support during my studies and, in particular, during the course of this thesis.
Introduction
Over the last decade, there has been a shift in emphasis from centralised to decen-tralised computer systems, to meet the increasingly demanding requirements of com-plex systems and the need to be more flexible and robust in dynamic environments. Now, in many of these cases, an agent-oriented approach, with its emphasis on au-tonomous actions and flexible interactions (Jennings, 2001), is an appropriate compu-tational model. Specifically, in such systems, the constituent agents are typically ca-pable of local decision-making based on incomplete and imperfect knowledge about the system, and, when placed together, the overall system behaves as acomputational ecologyin which the agents interact and strategically compete for resources. However, because there is no centralised system-wide control, it is a major challenge to coordi-nate behaviour in the system. Against this background, this thesis is concerned with developing techniques for the decentralised control of such complex computer systems. In many computational ecologies, decentralised control can be achieved by the alloca-tion of (scarce) resources in a decentralised manner. Moreover, decentralised resource allocation is a subject that has long been studied in economics (Mas-Collel et al., 1995). Given this, this work is specifically concerned with using economic metaphors and tools to achieve decentralised control. Broadly speaking, such work can be non-price-based (employing a mechanism that does not involve price or payment for resources) or price-based (using price as an economic motivator). In the former, resource allocation can be based on techniques involving game-theoretic models (with selfish agents that seek to maximise their individual return) (Yemini, 1981) or techniques based on decentralised algorithms (with non-selfish agents that cooperate and have the individual aim of max-imising the social welfare) (Kurose and Simha, 1989). The latter is a market-oriented approachand is the one we focus on in this thesis. We adopt such an approach because of its ability to facilitate resource allocation based on very little information (i.e. it just
works based on price), its flexibility through its distributed nature and its reliance on lo-cal decision-making and its ability to be robust in dynamic environments (by adapting effectively to changes).
In more detail, markets are price mechanisms1 that allowselfish andprofit-motivated2
agents to buy and/or sell resources. In so doing, the interaction of these self-interested, profit-motivated agents in a free market3 can result in a close to optimal allocation of
resources (Smith, 1962). Thus, efficient resource allocation in markets is anemergent behaviour from the interaction of these self-interested agents. Now, market mecha-nisms can exist in a multitude of forms including fixed-price markets in which a center or central agent arbitrarily sets a fixed price, dynamic-price markets where a center ar-bitrarily changes the price of goods, and auctions where the price is dynamically set in a decentralised manner. Each of these has its own particular properties and characteris-tics. However, probably the most popular is theauction, here defined as a mechanism that establishes prices based on participants’ offers to buy or sell resources (Wurman, 2001). Auctions can be categorised as being single-sided (Krishna, 2002) (such as the first-price open-cry auction commonly known as the English Auction or the online auc-tion eBay (http://www.ebay.com) in which there is a single buyer (or seller) and multiple sellers (or buyers), or double-sided (Friedman and Rust, 1992) (such as the clearing-house double auction or the Stock Exchange) in which there are multiple buy-ers and multiple sellbuy-ers. Here, our focus is on the double-sided variety as it perfectly addresses our aim to develop decentralised resource allocation solutions in systems with multiple consumers and suppliers. Within this context, probably the most prominent mechanism is the Continuous Double Auction (CDA) (Friedman and Rust, 1992). In this, multiple buyers and sellers compete for resources that are allocated whenever buy-ers and sellbuy-ers reach an agreement to trade. Given our focus and objectives, the CDA is particularly interesting in that it allows resource allocation among multiple consumers and suppliers and it is decentralised in nature (no center computes the allocation) and yet very efficient in terms of solving the resource allocation problem (Davis and Holt, 1993). Thus, we focus on the CDA as our exemplar economically-inspired mechanism for decentralised control.
1A mechanism defines how traders interact in the market, and how their actions lead to an allocation
of resources. In a price mechanism, price is used as an indicator of the resource’s value.
2The objective of a motivated agent is profit, whether it cooperates or not. Thus, a selfish profit-motivated agent is after profit, but never cooperates to meet its objective. In a market mechanism, we consider such agents, with buyer and seller agents competing for profit.
Within this context, there are two aspects to the CDA that need to be considered. The first is thestructuralone, that defines the framework within which traders operate. This covers issues such as what market information should be revealed to which agents, the format of the offers to buy and to sell, when a transaction occurs and the price of that transaction. The second is thebehavioural one that is concerned with the strategic in-teractions of the traders that determine the behaviour of the CDA. This covers issues such as the strategies that buyers and sellers should adopt and how efficient these strate-gies are with respect to how efficient the market is. Given this, in Section 1.1, we first investigate the structure and the behaviour of the CDA in more detail. Then, in Section 1.2, we discuss the research aims of this work, and list our contributions to advance the state of the art in Section 1.3. Finally, Section 1.4 gives the structure of this thesis.
1.1
The Continuous Double Auction
Market trading is governed by a market mechanism. Such mechanisms are designed to define the exchange process between buyers and sellers, by specifying the set of messages that can be exchanged (e.g. the traders’ actions such as submitting a bid or an ask, or agreeing to a transaction) and by specifying the resource allocation process given the received messages (e.g. when transactions occur given the exchanged messages and at what price these transactions occur). In the CDA, there is usually a fixed-duration trading period (typically referred to as atrading day), and buyers and sellers can submit bids and asks, respectively, at any time during the trading day and the market clears continuously. Specifically, the market clears whenever there is a match between open bids and asks (i.e. a transaction is possible). In a single-unit, single-attribute CDA, the market clears (with a single trade) whenever the outstanding bid is at least as high as the outstanding ask. All messages submitted by traders are usually public and announced to all the participants in the market.
CDAs are important and popular because they are highly efficient market institutions:
‘Markets organised under double-auction trading rules appear to generate competitive outcomes more quickly and reliably than markets organised under any alternative set of trading rules.’ (Davis and Holt, 1993)
the NASDAQ and the New York Stock Exchange - NYSE) use variants of it. Indeed, today, the total value of trades on the NYSE stands at around 12.4 trillion dollars4 of
yearly transactions while foreign exchanges are worth in excess of 1.9 trillion dollars5
of daily transactions. Thus, while decentralised resource allocation is the main motiva-tion for our work on the CDA, its possible applicamotiva-tion in CDA-based financial markets is an important additional facet. Specifically, preliminary evidence already exists that software agents can outperform their human counterparts in such settings (see Subsec-tion 2.3.1) and we believe that future marketplaces will increasingly involve ever larger numbers of such agents.
Now, whether we consider decentralised control or electronic trading scenarios, there are two aspects that characterise the CDA; namely the structural and the behavioural (as discussed above). Each of these will now be dealt with in turn.
First, we consider the structural perspective. This is determined by the market protocol which is a set of interaction rules and a set of clearing and pricing rules. The interaction rules define how participants interact through a set of actions. There are usually many interaction rules in a mechanism, ranging from specifying whether a trader can be a buyer and seller to specifying that a bid or an ask that can be submitted in the market must have a particular format. The clearing and pricing rules determine when and at what price a transaction occurs. The clearing rule only determines when a transaction occurs, while the pricing rule only determines the price of that transaction.
When taken together, it is these rules that allow the CDA to be an efficient market mech-anism. Specifically, in a CDA populated by selfish profit-motivated agents, there is an equilibration of transaction prices towards anequilibrium pricewhereby the demand is equal to the supply and the allocation of resources is optimal. This equilibration occurs because if the demand is greater than the supply, the price of the resources rises which, in turn, reduces demand (because a segment of the population can no longer afford it) and increases supply (since more suppliers are willing to trade at the higher price). Sim-ilarly, when supply exceeds demand, prices fall, which reduces supply and increases demand. Thus, according to the micro-economics of markets, the price approaches a
market equilibrium, where the demand equals the supply. How that equilibration is brought about during the trading day is known as thedynamicsof the mechanism. The importance of how this dynamics aggregates privately held information (about prefer-ences) to drive the market towards a solution for the resource allocation problem was described by Hayek:
4
http://www.nyse.com/pdfs/movolume0505.pdf
5
‘The problem (of how information that is held privately is accurately co-ordinated through the trading process to reach an equilibrium) is in no way solved if we can show that all facts(complete market information), if they were known to a single mind, would uniquely determine the solution; instead we must show how a solution is produced by the interactions of people each of whom possesses only partial knowledge. To assume all the knowledge to be given to a single mind in the same manner in which we assume it to be given to us as the explaining economists, is to assume the problem away and to disregard everything that is important and significant in the real world’. (Hayek, 1945)
It is to this dynamics of the CDA that its high efficiency is attributed, and it is this high efficiency as a decentralised resource allocation solution that motivates our work on the CDA mechanism. Now, though the CDA is already very efficient, when we consider the volume of trade in CDA-based financial markets with trillions of dollars worth of trans-actions, an improvement in efficiency, even of the order of 0.1%, is highly desirable and worthwhile. Thus, the emphasis of our work on the structure of the CDA is on how the market rules can be modified to improve certain desirable properties of the CDA such as price volatility, or fairness of profit distribution among buyers and sellers, as well as efficiency. In particular, to analyse how changing the market protocol really influences these properties of the mechanism, researchers have considered markets populated by very basic strategies, such that the properties of the mechanism can be attributed to the structure, rather than the behaviour, of the market. To date, however, most of this work has been about solving a standard resource allocation problem that is defined by a fixed demand and supply. Thus, research on the structure of the CDA has tended to overlook more complex problems and, specifically, when the demand and supply is complex and a market equilibrium does not exist. Thus, we believe it is important to investigate whether the CDA can still be used to solve the more complex allocation problems in a decentralised manner. If we can show this, then, we will augment the space of re-source allocation problems for which the CDA can be considered as a viable solution mechanism.
that is not amenable to a game-theoretic analysis (Gode and Sunder, 1992)6, there is no
known dominant strategy which produces the highest profit in the auction, regardless of what strategies it is playing against. Thus, over the past decade, there has been considerable research endeavour in developing trading strategies that define how agents should behave based on a variety of heuristic approaches (see Section 2.3 for more details). Moreover, these strategies have generally been targeted at static environments in which the market demand and supply does not change. However, we believe there is still significant scope for better strategies and, in particular, for strategies that perform well in both static environments and dynamic environments in which the market demand and supply changes sporadically. Given this, one of our lines of research considers the design of strategies for the CDA and its variants (to complement our work on the structure of the CDA). Moreover, because we are looking at the CDA mechanism for decentralised control, we require the interactions of the participating agents to result in a system that displays certain desirable properties such as efficiency and robustness in a wide variety of situations. To this end, we need to analyse how the strategies adopted by agents bring about these properties in bothhomogeneouspopulations (where all agents adopt the same strategy) and heterogeneouspopulations (where agents adopt different strategies). Furthermore, because we require our decentralised resource allocation to be robust in dynamic environments and efficiently adapt to changes in the demand and the supply, we need to analyse the behaviour of the CDA in both static and dynamic environments. Unfortunately, the current techniques for performing such analyses and for predicting system behaviour have a number of shortcomings (detailed in Subsection 2.3.5) and, so, work is needed to devise appropriate means of doing this. Work on this aspect therefore also represents an important research strand of this thesis.
1.2
Research Aims
The motivation for our research on the CDA is its widespread application and its gen-eral effectiveness as a decentralised solution to resource allocation. Now, given such motivations, our research needs to contribute to both the structural and the behavioural aspects. More specifically, we will now discuss the research aims of this thesis that deal with a number of issues in these two areas:
6As a consequence of the large space of actions and the continuous nature of the CDA game, and
1) to improve certain desirable properties of the CDA. This refers to properties such as market efficiency, price volatility and fairness of profit distribution among buyers and sellers that are attributable to the CDA’s structure. The reasons for wanting to do this are two-fold: (i) so that the CDA is more widely adopted as a market-based mechanism for resource allocation and (ii) to incentivise more buyers and sellers to join a market governed by such a mechanism.
2) to modify the structure of the CDA so that it can solve complex allocation prob-lems. While the standard version of the CDA solves a relatively simple resource allocation problem, we want to observe how efficient a CDA can be in more com-plex situations. The motivation here is to demonstrate the feasibility of applying the CDA to a wider range of problems than has been considered.
3) to design a more efficient strategy for the CDA. As there is no known dominant strategy for the CDA, a multitude of heuristic-based strategies have been developed. However, these are typically developed for static environments. Thus, we believe that a more efficient strategy can be designed and, furthermore, that equal emphasis should be placed on designing such a strategy for both static and dynamic environ-ments. The motivation here is to improve the behaviour of the CDA as a decen-tralised allocation system in both types of environments.
4) to develop methodologies for evaluating strategies in the CDA.Such methodologies should be able to analyse the CDA in homogeneous and heterogeneous populations, within static and dynamic environments, and for different (symmetric and asymmet-ric) demand and supply. In particular, we need to be able to evaluate properties, including the efficiency of the strategies, and the price volatility and the fairness of profit distribution among buyers and sellers. Moreover, for heterogeneous popula-tions, because strategies can be adopted by buyers and sellers in different proportions in the market, we need to be able to analyse the evolution of these proportions and identify those which are most likely to be adopted. The motivation here is to obtain a better understanding of the complex interplay of the agents’ behaviours and to make better predictions about what will happen in various circumstances.
1.3
Research Contributions
Given the research aims outlined above, we now highlight the following specific contri-butions to the state of the art made by the research contained in this thesis:
1) We develop an efficient CDA-based mechanism for a complex decentralised re-source allocation problem. To address researchaim (2), we develop a CDA variant that solves a more complex allocation problem than the standard CDA. Specifically, this is the first work that modifies the CDA protocol to cope with multiple suppliers with limited production capacities and a cost structure composed of a fixed over-head cost and a constant marginal cost, and multiple buyers that have an inelastic demand7. We then go on to empirically evaluate the structure of our CDA variant by
using a zero-intelligence behaviour8, to emphasise the effect of the structure, rather
than behaviour, on the efficiency of the mechanism. Despite such simple behaviour, we showed that our mechanism is efficient (which is an average of 80% and up to 90%). Furthermore, to addressaim (1) for desirable properties, we demonstrate how our modified protocol allows an equal distribution of profits among buyers and sellers.
2) We develop a multi-layered framework for designing strategies. This work ad-dresses the issues in aim (3)where we observe that a multitude of strategies have been developed for the CDA and, because there is no known dominant one, we can always expect the design of new strategies. Because there is no current frame-work for designing strategies for the CDA, we develop such a frameframe-work in order to provide a blueprint that will assist the strategy designer with the different aspects involved in this process. Specifically, it will help the designer to identify the issues such as gathering information, processing information and using that processed in-formation to strategise in the market. At present, bidding strategies are typically designed in an ad hoc and intuitive manner with little regard for discerning best practice or attaining reuseability in the design process, and our framework puts the development on a more systematic footing.
7A trader with an inelastic demand does not vary its demand according to price and has a positive utility for their requirement, and a utility of 0 for anything else. This contrasts with the standard assump-tion of elastic demand in which price is more responsive to changes in demand and the trader varies its demand according to price.
8A zero-intelligence behaviour is given by a strategy that ignores all market information and makes
3) We develop a bidding strategy for the CDA that is more effective than any previous strategy. This work addressesaim (3) for a more efficient strategy. Our Adaptive-Aggressiveness (AA) strategy is based onaggressivenessin the market. Specifically, it has both short and a long-term learning that allows such agents to adapt their bid-ding behaviour to be efficient in a wide variety of environments. For the short-term learning, the agent updates the aggressiveness of its bidding behaviour (more ag-gressive means that it will trade off profit to improve its chance of transacting, less aggressive that it targets more profitable transactions and is willing to trade off its chance of transacting to achieve them) based on market information observed after every bid or ask appears in the market. The long-term learning then determines how this aggressiveness factor influences an agent’s choice of which bids or asks to sub-mit in the market, and is based on market information observed after every transac-tion (successfully matched bid and ask). The principal motivatransac-tion for the short-term learning is to update the agent’s aggressiveness to immediately respond to short-term market fluctuations, while for the long-short-term learning it is to adapt to long-short-term changes in market conditions and to enable the agent to perform efficiently in dy-namic environments. Our strategy addresses the issue that strategies have previously not been explicitly designed for dynamic environments and, in our approach, we identify the market shocks in the market and explicitly adapt the agent’s behaviour in response to them.
4) We develop a framework for analysing strategic interactions in the CDA.This work addressesaim (4)of evaluating strategies in heterogeneous populations. In particu-lar, the standard model is predicated upon the assumption that buyers and sellers have to adopt the same strategies. This is a serious simplification and shortcoming and, so, to address it, we develop a new model that separately analyses the strategic be-haviour of buyers and sellers in the market. Specifically, we adopt a two-population evolutionary game theoretic approach, where we consider buyers and sellers as sep-arate populations in the market. In so doing, our model offers new insights into how the choices of strategies affect the buyers’ and sellers’ economic efficiency and, so, we can better evaluate strategies in heterogeneous populations.
as the strategies learn over the different trading days and because it identifies the drastic decrease in efficiency after a market shock. In terms of our methodology to evaluate strategies in heterogeneous populations, we use our novel two-population evolutionary game theoretic framework to analyse the buyers’ and sellers’ strategic behaviours in the CDA. Specifically, we use our methodologies to benchmark AA against the state of the art CDA strategies in static and dynamic environments under different market settings and, indeed, our evaluation provides insights that were not possible with previous methodologies. In so doing, we also empirically demonstrate the superiority of our AA strategy. In the homogeneous scenario, it outperformed the state of the art by up to 3.6% in the static case and 2.8% in the dynamic case. In the heterogeneous scenario, we identified that there is a probability above 85% that the AA strategy will eventually be adopted by buyers and sellers in all the settings we investigate.
The following papers have been published in support of these contributions:
• R. K. Dash, P. Vytelingum, A. Rogers, E. David and N. R. JenningsMarket-based task allocation mechanisms for limited capacity suppliers. IEEE Trans on Sys-tems, Man and Cybernetics (Part A), 2007.This deals withcontribution 1. • P. Vytelingum, R. K. Dash, M. He, and N. R. Jennings.A framework for designing
strategies for trading agents. Proc. IJCAI Workshop on Trading Agent Design and Analysis, pages 7-13, 2005.This deals withcontribution 2.
• P. Vytelingum, R. K. Dash, M. He, A. Sykulski and N. R. Jennings. Trading strate-gies for markets: A design framework and its applications. Lecture Notes in Artificial Intelligence, pages 171-186, 2006. This deals withcontribution 2. • P. Vytelingum, D. Cliff and N. R. Jennings. Strategic Bidding in Continuous
Dou-ble Auctions. Submitted to the Artificial Intelligence Journal, 2006 (paper se-lected at ECAI 2004 for fast track revision). This deals with contributions 3, 4
and5.
• P. Vytelingum, R. K. Dash, E. David, and N. R. Jennings. A risk-based bidding strategy for continuous double auctions. Proc. 16th European Conference on Artificial Intelligence, pages 79-83, 2004.This deals withcontribution 3.
• P. Vytelingum, D. Cliff, and N. R. Jennings.Evolutionary stability of behavioural types in the continuous double auction. Proc. AAMAS Joint Workshop on Trading Agent Design and Analysis and Agent Mediated Electronic Commerce VIII, pages
1.4
Thesis Structure
This thesis contributes to the two main avenues of research on the CDA, namely on its structure and its behaviour. In this section, we outline the structure of this thesis and its focus on these two areas.
We begin with a literature review of the CDA. In Chapter 2, we provide an overview of the micro-economics of markets, and on the structural and behavioural aspects of the CDA. First, we look at the work on the structure of the CDA. Specifically, we review existing research on modifying the market protocol to improve market efficiency or to reduce the price volatility in the CDA. Second, we review the work on the behaviour of the CDA. Here, we begin by looking at the software agent-human interaction in the CDA. Thereon, we focus on bidding strategies for software agents and, in particular, we look at frameworks for designing strategies and at how to categorise strategies. We then detail the common CDA strategies and, finally, we describe the standard one-population evolutionary game theoretic approach to analyse the behaviour of the CDA.
Next, we look at the structural and the behavioural perspective of this thesis. Part I. The Structural Perspective
We describe, in Chapter 3, our novel CDA-based mechanism for decentralised task allo-cation, where sellers have limited capacity and have a start-up production cost and buy-ers have inelastic demand. We first describe the resource allocation problem which is to minimise the total production cost of suppliers. We then detail a centralised mechanism to solve the problem and the market protocol of our novel decentralised mechanism, including the pricing and clearing rules. Given the optimal centralised solution, we are then able to calculate the efficiency of our decentralised mechanism as the ratio of the total production cost of the decentralised case to that of the centralised case. Then, we describe in detail the structure of our novel mechanism (i.e. its market protocol). Given the centralised and decentralised solution, we then evaluate the latter mechanism. To this end, we develop a zero-intelligence behaviour for our mechanism, such that structure, rather than behaviour, affects the efficiency of the system. Given this simple behaviour and the structure of our mechanism, we evaluate our CDA variant for different numbers of market participants.
Part II. The Behavioural Perspective
in the CDA and, in particular, describe its application in designing a strategy that we entered into the International Trading Agent Competition.
In Chapter 5, we describe ourAAbidding strategy, designed using our IKB framework. We describe, in detail, the different components of the strategy, including the short-term and the long-term learning mechanisms.
In Chapter 6, we describe our two-population evolutionary game theoretic model to analyse the behaviour of both buyers and sellers in the market. We then describe the application of our model in analysing the CDA given a particular scenario, and compare this analysis to that with the standard one-population EGT model to identify the insights that are overlooked by the latter model.
In Chapter 7, we first develop our methodologies to evaluate the main state of the art strategies in homogeneous and heterogeneous populations. Using these methodologies, we benchmark AA against the state of the art within static and dynamic settings and with symmetric and asymmetric demand and supply. We demonstrate that AA outperforms the current state of the art in all these situations.
Literature Review
In this chapter, we begin by introducing the classical micro-economic theory of demand and supply of markets, which is generally used to explain the high efficiency of the allocation in the CDA (Section 2.1). Next, we introduce the CDA mechanism, and describe the structure that is typically considered in the literature and that we will be using in our work to be consistent with this body of work. We then review the main related work on the structural and behavioural aspects of the CDA (sections 2.2 and 2.3 respectively). Finally, in Section 2.4, we summarise the reviewed work and, given our research aims, we analyse to what extent the related work on the structure and behaviour of the CDA satisfies these aims and identify the issues that require subsequent research.
2.1
Background on the Microeconomics of Markets
In a market, it is generally accepted that the higher the price of the commodity (good or service), the lower the demand and, conversely, the lower the price, the lower the supply. This demand and supply characteristic can be represented by a demand and supply curve, which is a function of the demand and the supply with respect to price (see Figure 2.1). The demand and supply curves meet at thecompetitive market equilibrium: Definition 2.1. The competitive market equilibriumis when demand meets supply in a free market populated by profit-motivated and selfish agents. According to the classi-cal micro-economic theory, the transaction prices in the CDA are expected to converge towards that competitive equilibrium price p∗. Asp∗ can only be calculated if the de-mand and supply are available, which is not the case here because of the decentralised nature of the CDA and the fact that no single agent knows all the agents’ preferences,
p∗ cannot be known a priori. The equilibrium is referred to as competitive because it is the competition among buyers and sellers that drive transaction prices top∗.
At the competitive market equilibrium price, p∗ the social welfare of the system (i.e. the benefit of the system as a whole) is maximised (i.e. the profit of all traders is max-imised). The market equilibrium quantity, q∗, also known as the clearing quantity, is the optimal number of trades to maximise the profit of all traders. Now, in Figure 2.1, because the demand and supply curves intersect over a range of quantities and we are dealing with discrete quantities, we have avolume tunnel, where the equilibrium quan-tity can beq∗−1orq∗. However, since we assume goods are desirable, an allocation takes place even though there is no profit involved and, thus, the equilibrium quantity is at q∗. In cases when the demand and supply curves do not intersect over a single price (see Figure 2.2), we have aprice tunnelbetweenp∗sandp∗b andp∗lies somewhere within this range.
FIGURE2.1: Demand and supply curve.
FIGURE2.2: Demand and supply curve.p∗lies betweenp∗sandp∗b.
at the margin), as we assume that goods are desirable. The other participants are the
extra-marginal sellerswhose cost prices are too high andextra-marginal buyerswhose limit prices are too low to trade in the market.
Definition 2.2. The limit priceis the maximum bid a buyer is currently willing to offer, and the minimum ask a seller is willing to offer.
Definition 2.3. `i, is the limit price of buyeri.
Definition 2.4. cj, is the limit price of sellerj.
The centralised approach to the resource allocation problem (in such situations), be-tween a setI of buyers and a setJ of sellers, is an optimisation problem. Specifically, it is a maximisation of the objective function which is the profit from all traders. The solution is given in Equation 2.1 wherecj is the cost price of sellerj ∈J, `i ∈ Iis the
limit price of buyerias the equilibrium price,p∗, and the setIof intra-marginal buyers and the set J of intra-marginal sellers that transact. Here, p∗ can lie over a range of values when we have a price tunnel (see Figure 2.2). Given the solution to the resource allocation problem, themarket efficiencyis said to be maximised.
p∗ = arg max
p
( X
i∈I
max(0, p−`i) +
X
j∈J
max(0, cj −p)
)
I = {x⊂I|`i ≥p∗ ∀i∈x}
Definition 2.5. The market efficiencyis the ratio of all agents’ surpluses in the market to the maximum possible surplus that would be obtained in an allocation where the profits of all buyers and sellers are maximised.
In a centralised market mechanism, market efficiency is optimal. While the objective of a decentralised system is also to maximise social welfare, an efficient allocation cannot be computed since there is no single agent that has the complete and perfect information that is needed to compute such an allocation. Rather, in the case of a CDA, it is the emergent behaviour of the market mechanism that computes the allocation and this is therefore non-optimal. Now, in many practical situations, it is often better to trade-off some of this efficiency for the desirable properties of a decentralised mechanism (as outlined at the beginning of Chapter 1). Given this, in this thesis we consider the CDA as such a decentralised market mechanism.
In his seminal work, Vernon Smith demonstrates that markets governed by the CDA mechanism and populated by selfish and profit-motivated (human) traders, can achieve a close to optimal market efficiency (Smith, 1962). Moreover, there is an equilibration of transaction prices to the competitive market equilibrium price, p∗, that is predicted by the micro-economics of free markets. Thus, despite the selfish nature of participants and the decentralised nature of information, it is shown that a close to optimal market efficiency can be reached in a CDA institution. He also demonstrated that if there was a market shock(a sudden change in demand and supply at the beginning of a trading day), transaction prices would converge to the new competitive equilibrium price (if it changes). An example of such a market shock is given in Figure 2.3 wherep∗increases from 2.0 to 3.0.
Definition 2.6. A market shock1 is a sudden change in the agents’ preferences (their limit prices) and, hence, in the market demand and supply. Note that changing the demand and supply does not necessarily mean a change in the competitive market librium as the new demand and supply curves could still meet at the same market equi-librium.
Smith also introduced acoefficient of convergence,α, given the history ofntransaction prices,p˜i, i∈ {1..n}(see Equation 2.2). Here,αis proportional to the standard
devia-tion of transacdevia-tion prices around the theoretical equilibrium price and it can be evaluated
FIGURE 2.3: Example of a market shock. The red full line represents the transaction prices, while the dashed and black line represents the competitive market equilibrium
price.p∗ increases from 2.0 to 3.0 as from transaction 62.
over different periods in the history of transaction prices to estimate their trend of con-vergence. This coefficient of convergence can also be considered as the price volatility in the market:
α=
q 1
n
Pn
i=1(˜pi−p∗)2
p∗ (2.2)
Having looked at the micro-economics of demand and supply of markets and how it can be used to predict the efficient outcome in markets governed by the CDA institution, we now describe the CDA in more detail (looking at the structural element in the next section and the behavioural element in the subsequent one).
2.2
The Structural Aspect of the CDA
the CDA includes things like the fact that a commission is charged for placing a bid or an ask, and that some traders have different levels of privilege with better access to other traders’ messages than is available to unprivileged traders (usually to improve the overall efficiency of the system). Dashet al. (2007), on the other hand, describe a variant of the CDA for market-based control applications, where the clearing rules ensure that partial clearing2of multi-unit bids is not allowed (see Section 3.3).
However, these examples of the CDA are highly domain specific and are, therefore, difficult to generalise from. Thus, most research in this area (e.g. (Gode and Sunder, 1993; Cliff and Bruten, 1997; Tesauro and Das, 2001)) has generally been structured around the market protocol initially proposed in (Smith, 1962). In this, multiple buyers and sellers are allowed to submit shouts (bids and asks) in a market for homogeneous, single-attribute goods, and the market clears (with a single trade) whenever a bid and an ask match (hence, the continuous nature of the CDA), and clears at a price between (and including) the matched bid and ask. Thek-pricingrule is usually adopted where the market clears at a weighted average of the bid and the ask as given in the following equation:
˜
p=k.pb+ (1−k)pa (2.3)
wherep˜is the transaction price,pbis the matched bid andpais the matched asked. The
parameterkis typically set to 0.5 in the CDA.
Furthermore, the protocol includes the NYSE spread-improvement and the no order queuing rules. The former requires that a submitted bid or ask improves on the out-standing bid (the highest unmatched bid) or the outout-standing ask (the lowest unmatched ask) respectively, while the latter specifies that offers are single-unit, are not queued in the system, and are simply erased when a better offer is submitted. The CDA lasts several trading days, with a trading day itself lasting several trading rounds which is the period during which bids and asks are submitted (with the bid-ask spread decreasing) until the market clears. To more formally analyse the CDA, we now explore some of these basic notions in more detail:
Definition 2.7. A trading dayis the period (with a deadline) during which traders are allowed to submit bids and asks (resulting in transactions whenever these match), at the end of which the market closes. In Smith’s model of the CDA, at the beginning of a
trading day, traders are endowed with a set of goods to buy or sell (that determine the market demand and supply).
Definition 2.8. A bid is an offer to buy submitted in the market. The bid is published as a quote that is viewable by the other participants.
Definition 2.9. An askis an offer to sell submitted in the market. The ask is published as a quote that is viewable by the other participants.
Definition 2.10. A shoutis a generic term for a bid or an ask.
Definition 2.11. An outstanding bid or an outstanding best bid, obid, is the current
maximum (uncleared) bid submitted in the market.
Definition 2.12. An outstanding ask or an outstanding best ask, oask, is the current
minimum (uncleared) ask submitted in the market.
Definition 2.13. The bid-ask spreadis the difference betweenobid andoask.
Definition 2.14. The minimum increment,∆is the minimum bid or ask increment in the market.
Definition 2.15. The maximum price,pmaxis the maximum bid or ask allowed in the
market (to prevent unreasonably high asks and speed up the trading process).
Definition 2.16. A trading roundis the period during which bids and asks are submit-ted until there is a match and a transaction occurs. There are typically several trading rounds in a trading day. At the beginning of the trading round,obid = 0andoask =pmax.
Given the standard structure of the CDA, we now review the work on modifying that structure to improve on its desirable properties, specifically by changing the pricing and shout improvement rules.
2.2.1
Designing Pricing Rules
We now review the work by Phelps et al. (2003) where they consider optimising the pricing rule for the CDA. Here, the objective is to find the pricing rule that maximises some objective fitness,V, that combines the market efficiency and the buyers’ and the sellers’ efficiencies (also referred to as buyer and seller market power respectively):
V = market efficiency 2 +
buyers’ efficiency+sellers’ efficiency
They propose two approaches to designing the pricing rule, which we now describe in detail.
First, the authors propose to optimise the k parameter in the CDA pricing rule (see Equation 2.3). This is a simple enough operation that can be achieved by using brute force and calculating the fitness, V, over the spacek ∈ [0,1]. Having done this, their simulation results showed that the best value fork is shown to be 0.5 (see Figure 2.4), validating the use ofk = 0.5in the traditional CDA.
FIGURE 2.4: FitnessV (with standard deviation) plotted against k for a market of 12 traders (taken from (Phelps et al., 2003)).
Second and, perhaps more interestingly, the authors do not limit their approach to the typical pricing rule given in Equation 2.3, but rather consider the space of all arithmetic combinations of pb and pa. The pricing rule was then allowed to evolve over such a
space using genetic programming. The evolved (and automatically acquired) pricing rule was an extremely complex function (see (Phelps et al., 2003) for more details), which, however, was shown to be approximately equal to0.5pb + 0.5pa, apart from a
small variation when the ask is small or when the difference between the bid and ask is marginal.
In summary, this line of work can be seen to address our first aim of improving the properties of the CDA and, specifically, it shows how the structure of the CDA can be evolved (by evolving its protocol) for this purpose. Furthermore, it indicates that the
0.5pb + 0.5papricing rule is the most efficient and, thus, we shall adopt such a pricing
2.2.2
Improving Pricing and Shout Improvement Rules
Having seen an automated approach to designing pricing rules, we now consider an-other notable work on the structural aspect of the CDA where the objective is to reduce price fluctuations. In particular, (Parsons et al., 2006) investigate how modifying the traditionalk-pricing rule and the NYSE shout improvement rule can meet their objec-tive. The motivation for such work is that with reduced fluctuations, participants would then be guaranteed transaction prices close to the competitive equilibrium price, and such guarantees for fair transaction prices would incentivise more participants to join the market.
First, the authors look at thepricing policyin the CDA. In particular, they modify the traditional policy, referred to as KPricingPolicy (given in Equation 2.3) to the NPricing-Policy commonly used in the Clearing-House double auction (where the market only clears at the end of the auction) (Friedman and Rust, 1992). The NPricingPolicy keeps a sliding window of size N of matching pairs of bids and asks used to set the trans-action prices. It is important to understand that though this policy might reduce the price fluctuation in the market, it would not change the market efficiency, but would simply redistribute the profits among the participants and thus change the efficiency of the buyers and sellers. Equation 2.5 describes the policy exactly:
pT =
1 2N
T
X
i=T−N+1
(pai+pbi) s.t. paT ≤pT ≤pbT (2.5)
where pbi and pai are the accepted bid and ask corresponding to the ith transaction
respectively, T is the latest transaction andpT is the price at which the transaction is
set using the KPricingPolicy. Here, p˜is bounded betweenpbT, the maximum a buyer
is willing to offer, and paT the minimum a seller is willing to offer. Note that the
NPricingPolicy becomes the KPricingPolicy when n = 1, and the auction is then a traditional CDA. On the other hand, whenN is equal to the total number of transactions, the auction is then a traditional Clearing-House Double Auction. Thus,N ranges over a continuous space of double auctions, with the Continuous Double Auction and the Clearing-House Double Auction at either end.
in both markets, with the better improvement in the ZI-C markets (as indicated by the relatively larger decrease inα). This is because ZI-C agents randomly submit bids and asks, and the spread of matching bids and asks is typically quite high. On the other hand, the more intelligent GD agents submit bids and asks that tend to converge towards the competitive equilibrium price, such that the spread is then greatly reduced, and the new pricing policy is then only marginally more effective.
FIGURE 2.5: Transaction prices, plotted as 10 different runs, for the KPricingPolicy (in (a) and (b)) and for the NPricingPolicy (in (c) and (d)) (taken from (Parsons et al.,
2006)).
FIGURE 2.6: Metrics for KCDAs, nCDAs and nCDAEEs measured over 10 trading days. Bold face indicates the corresponding market outperforms or equals its kCDA counterpart. Bold italic points out the best results in the ZI-C and GD markets (taken
from (Parsons et al., 2006)).
ˆ
p∗ = 1 m
T
X
i=T−m+1
pt,i (2.6)
wherept,i is the transaction price as calculated in Equation 2.5.
Thus, rather than improving on bids and asks as in the NYSE rule, the buyers have to bid above( ˆp∗−δ), and the sellers below( ˆp∗ +δ). Here,δ is some parameter to relax the range of bids and asks allowed, and was introduced because the transaction prices typically deviate greatly from the competitive equilibrium price at the beginning of the auction. The efficiency and price fluctuations with the new shout improvement rule (de-noted by CDAEEδ∗) are given in Figure 2.6. First, the authors considerδ= 0. Clearly, α is then considerably smaller for nCDAEE-ZI-C (i.e. the CDA with NPricingPolicy and EE withδ = 0and populated by ZI-C agents), though the new shout improvement rule decreases efficiency in that case. However, with GD agents, the performance is even worse, with price fluctuations actually increasing and the market efficiency de-creasing. The authors conjectured that the GD agent adapts its bids or asks even though it is on the wrong side of the estimate and got rejected, and they have insufficient time to adapt sufficiently to be efficient. This led the authors to consider relaxing the shout improvement rules and consider different values forδ, and the results using such rules are given in Figure 2.6. As can be seen, the markets with δ ≥ 5 were indeed more efficient with either ZI-C or GD agents, than withδ= 0, though when they increasedδ, the price fluctuations decreased with GD agents, but increased with ZI-C agents.