THE EARLY IMPACT OF THE REVISED
LEAVING CERTIFICATE GRADING
SCHEME ON STUDENT PERCEPTIONS
AND BEHAVIOUR
SELINA MCCOY
,
D
E
LMA BYRNE
,
JESSICA O'SULLIVAN A
ND
EMER SMYTH
NUMBER
85
January 201
9
THE EARLY IMPACT OF THE REVISED LEAVING
CERTIFICATE GRADING SCHEME ON STUDENT
PERCEPTIONS AND BEHAVIOUR
Selina McCoy
Delma Byrne
Jessica O’Sullivan
Emer Smyth
January
201
9
Economic and Social Research Institute;
Available to download from www.esri.ie
Copyright:The Economic and Social Research Institute Whitaker Square, Sir John Rogerson’s Quay, Dublin 2 ESRI Research Series No. 85
DOI: https://doi.org/10.26504/rs85
ISBN: 978-0-7070-0478-5
The mission of the Economic and Social Research Institute is to advance evidence-based policymaking that supports economic sustainability and social progress in Ireland. ESRI researchers apply the highest standards of academic excellence to challenges facing policymakers, focusing on 12 areas of critical importance to 21st
Century Ireland.
The Institute was founded in 1960 by a group of senior civil servants led by Dr T.K. Whitaker, who identified the need for independent and in-depth research analysis to provide a robust evidence base for policymaking in Ireland.
Since then, the Institute has remained committed to independent research and its work is free of any expressed ideology or political position. The Institute publishes all research reaching the appropriate academic standard, irrespective of its findings or who funds the research.
The quality of its research output is guaranteed by a rigorous peer review process. ESRI researchers are experts in their fields and are committed to producing work that meets the highest academic standards and practices.
The work of the Institute is disseminated widely in books, journal articles and reports. ESRI publications are available to download, free of charge, from its website. Additionally, ESRI staff communicate research findings at regular conferences and seminars.
The ESRI is a company limited by guarantee, answerable to its members and governed by a Council, comprising 14 members who represent a cross-section of ESRI members from academia, civil services, state agencies, businesses and civil society. The Institute receives an annual grant-in-aid from the Department of Public Expenditure and Reform to support the scientific and public interest elements of the Institute’s activities; the grant accounted for an average of 30 per cent of the Institute’s income over the lifetime of the last Research Strategy. The remaining funding comes from research programmes supported by government departments and agencies, public bodies and competitive research programmes.
THE AUTHORS
Selina McCoy is an Associate Research Professor at the ESRI and an Adjunct Professor at Trinity College Dublin. Delma Byrne is a Lecturer at the National University of Ireland Maynooth. Jessica O’Sullivan was a Research Assistant at the ESRI. Finally, Emer Smyth is a Research Professor at the ESRI and an Adjunct Professor at Trinity College Dublin.
ACKNOWLEDGEMENTS
We would like to thank Barry Slattery and John Hammond from the NCCA and members of both the Council and Senior Cycle Board of the NCCA for their engagement with the project. We are also grateful to the Transitions Reform Steering Group and the Research Sub-Group for their helpful feedback. The timely provision of the Leaving Certificate examination data by the State Examinations Commission was hugely important to the completion of the study. We are also grateful to Lewis Purser from the Irish Universities Association for the provision of data on the prevalence of random allocation. We are especially appreciative to the staff, students and parents in the ten case-study schools who engaged so positively with the research. Finally, we would like to thank Alan Barrett, Helen Russell, an external referee and two internal ESRI referees for their suggestions and contributions to this report.
TABLE OF CONTENTS
EXECUTIVE SUMMARY ... i
Introduction ... i
The Leaving Certificate grading reforms ... i
Key findings ... ii
Policy implications ... iii
CHAPTER 1 Introduction and context ... 1
1.1 Introduction ... 1
1.2 Changes to grading bands 1969–2017 ... 1
The period 1969–1991 2 The period 1992–2016 3 The period 2017–the present 5 1.3 Development of a common points system ... 8
The period 1969–1991 8 The period 1992–2016 11 2017–the present 17 1.4 Research on the Leaving Certificate ... 18
1.5 Structure of the report ... 20
CHAPTER 2 Research methodology ... 1
2.1 Introduction ... 1
2.2 Research design ... 1
2.2.1 Analysis of State Examinations Commission data 1 2.2.2 Case-study research 3 2.3 Research ethics ... 6
2.4 Summary... 7
CHAPTER 3 Analysis of Leaving Certificate examination data ... 1
3.1 Introduction ... 1
3.2 Take-up of higher-level subjects ... 1
3.2.1 Descriptive analyses 1 3.2.2 Multilevel analysis 3 3.3 Examination grades achieved ... 12
CHAPTER 4 Student, teacher and parental perceptions of changes in the grading system ... 27
4.1 Framing student decision-making ... 27
4.1.1 Higher-level subject access 27 4.1.2 Changes to the grading system 29 4.1.2 Some students benefit more than others 32 4.2 Difference between higher- and ordinary-level points ... 34
4.3 Rewarding perceived failure ... 36
4.4 Instrumentality and the points race ... 38
4.5 Bonus points for higher-level mathematics ... 41
4.6 Random selection ... 43
4.7 Summary... 45
CHAPTER 5 Broader issues in relation to the Leaving Certificate ... 47
5.1 Student preparedness for senior cycle ... 47
5.2 The role of grinds ... 51
5.3 Preparedness for life after school ... 54
5.4 Student stress levels in the Leaving Certificate year ... 57
5.6 Summary... 59
CHAPTER 6 Summary of key findings and policy implications ... 61
6.1 Introduction ... 61
6.2 Context of the study ... 62
6.3 Methodology ... 63
6.4 Main findings ... 64
6.5 Policy implications ... 67
APPENDIX Sensitivity analyses ... 71
LIST OF TABLES
Table 1.1 Grading scheme for Leaving Certificate examination, 1969–1991 ... 3
Table 1.2 Grading scheme for Leaving Certificate examination, 1992–2016 ... 4
Table 1.3 Grading scheme for Leaving Certificate examination, 2017 ... 6
Table 1.4 Scoring scheme for Leaving Certificate performance, 1980 ... 10
Table 1.5 Changes to grading structure and points scheme for leaving certificate ... 12
Table 1.6 Higher education matriculation requirements, pre- and post-2017 ... 18
Table 2.1 Details on the case-study schools ... 4
Table 3.1 Candidate profile by school sector... 4
Table 3.2 Multilevel logistic regression model of likelihood of taking higher-level English ... 5
Table 3.3 Multilevel logistic regression model of likelihood of taking higher-level Irish ... 7
Table 3.4 Multilevel logistic regression model of likelihood of taking higher-level mathematics 8 Table 3.5 Multilevel OLS regression model of number of higher-level subjects taken ... 10
Table 3.6 Multilevel OLS regression models of number of higher-level subjects taken across different groups of schools (2016 and 2017) ... 12
Table 3.7 Grade equivalents and points according to the CAO common points scale ... 13
Table 3.8 Multilevel OLS regression model of examination grades in English ... 18
Table 3.9 Multilevel OLS regression model of examination grades in mathematics ... 19
Table 3.10 Multilevel OLS regression model of examination grades in Irish ... 20
Table 3.11 Multilevel OLS regression model of total points achieved ... 22
Table 3.12 Multilevel OLS regression models of total points achieved across different groups of schools (2016 and 2017) ... 23
Table 4.1 Number of courses with random allocation and number of applicants not offered places on basis of random allocation ... 44
Table A3.1 Multilevel linear probability models of taking higher-level English, irish and mathematics ... 71
LIST OF FIGURES
Figure 1.1 Percentage of teachers using LC grading bands for assessment ... 8
Figure 3.1 Take-up of higher-level English, Irish and mathematics 2001–2015 ... 2
Figure 3.2 Take-up of higher-level English, Irish and mathematics 2015–2017 ... 2
Figure 3.3 Total number of higher-level subjects taken 2015–2017 ... 3
Figure 3.3a Grades in higher-level English 2015–2017 ... 13
Figure 3.3b Grades in ordinary-level English 2015–2017 ... 14
Figure 3.4a Grades in higher-level Irish 2015–2017 ... 14
Figure 3.4b Grades in ordinary-level Irish 2015–2017 ... 15
Figure 3.5a Grades in higher-level mathematics 2015–2017 ... 15
EXECUTIVE SUMMARY
INTRODUCTION
This report examines the early effects, on student perceptions and behaviour, of a change in the grading structure for the Leaving Certificate (LC) examination, which took place in 2017. Potential change in LC outcomes is an important policy issue, given the crucial role played by upper secondary grades in access to higher education (HE) and in (higher quality) employment in Ireland (Hannan et al., 1998; McCoy et al., 2010a; Smyth and McCoy, 2009). In Ireland, the terminal, externally assessed system, with its high-stakes character, has been found to profoundly influence the nature of learning and skills development experienced by young people (McCoy et al., 2014b; Burns et al., 2018; Smyth et al., 2011). This report assesses whether an adjustment in the grading system has had an impact on the perceptions and behaviour of the first cohort of students experiencing the new scheme, in their final year of school.
THE LEAVING CERTIFICATE GRADING REFORMS
The rationale for the reform of the grading bands was:
• to fairly reward scholastic achievement;
• to minimise the use of random selection to allocate HE places;
• to preserve the relative value of ordinary and higher level in the current points scale;
• to encourage the take-up of higher-level subjects, by awarding points for
the new H7 (30–39 per cent) grade.
KEY FINDINGS
For the most part, students adopted the new grading scheme without much difficulty, although a smooth transition to the new grading scheme was often based on schools providing information to students and their parents in advance, ideally early in fifth year. Analyses of the anonymised examination data show the growing proportion of students sitting higher-level papers, particularly for Irish, English and mathematics. It is clear that the grading changes, and the awarding of points for 30– 39 per cent on higher-level papers, achieved the stated aim of promoting the take-up of higher-level subjects. However, DEIS schools (Delivering Equality of Opportunity in Schools) in low- and medium-points bands lost out somewhat, with a widening gap between DEIS and non-DEIS schools in higher-level take-up. The results also highlight the constraints posed by small school size in terms of level subject provision, with a clear gradient between school size bands and higher-level subject take-up. Students spoke about the incentives offered for persevering with higher-level courses, particularly for mathematics (which they linked explicitly with the availability of bonus points), as well as the challenges this created in terms of workload and stress. They were also conscious of the dilemma in staying with a level for which they felt ill-equipped, but in a system where 30 per cent is considered a ‘pass’.
Executive Summary| iii
changes, the maximum number of points awarded for ordinary-level papers was reduced, as was the maximum number of points awarded for the Leaving Certificate Vocational Programme (LCVP). Students spoke about the impact of the perceived low number of points for achieving at ordinary level in terms of their motivation, engagement and academic self-image. The negative self-image of lower-performing students was further reinforced by the dominance of the ‘points race’ and the perceived excessive emphasis on maximising achievement in the exams. The normalisation of grinds (private tuition) was further reflective of the emphasis on points, with grinds being prevalent across all case-study schools. Staff also spoke about the fixation of students on marking schemes and the value of rote learning in maximising their performance.
Finally, the results showed a reduction in the numbers of courses and applicants with random allocation in higher-education entry. Although expressed as a proportion of all applicants to HE, random allocation impacted on few students before or after the reform.
POLICY IMPLICATIONS
CHAPTER 1
Introduction and context
1.1
INTRODUCTION
In 2017 new Leaving Certificate (LC) grading bands and a new common points scale (CPS) for entry to higher education (HE) were introduced by the Department of Education and Skills (DES). The key objectives were:1
• to fairly reward scholastic achievement;
• to minimise the use of random selection to allocate HE places;
• to preserve the relative value of ordinary level and higher level in the
current points scale;
• to encourage the take-up of higher-level subjects, by awarding points for
the new H7 grade.
Reform of the grading bands reflected broader concern about the quality of the transition from second-level to HE (DES, 2015) and was accompanied by a range of proposals, including those relating to the organisation of undergraduate courses in HE. Such concerns about the nature of the LC and its role as a key mechanism for HE are not recent, dating back to 1978 and, later by the Commission on the Points System, in the late 1990s. The prominence of the LC in the Irish educational landscape makes it all the more important to assess any early impact of the reform on young people’s outcomes, and to analyse whether certain groups of young people, in terms of gender or socio-economic background, are more affected than others. This report draws on systematic analyses of examination data and in-depth case studies of second-level schools, to examine the early effects on student perceptions and behaviour of a change in the grading structure for the LC examination. In doing so, the research also highlights broader issues relating to senior-cycle education and the approach to assessment. The remainder of this chapter provides important context for the study findings by tracing the historical evolution of LC grading and its role as a selection mechanism for HE.
1.2
CHANGES TO GRADING BANDS 1969–2017
Much of the academic literature pertaining to the LC has focused on LC achievement and the associated ‘points system’ as a mechanism for selection into HE (see for example McCoy et al., 2010a; McCoy et al., 2010b; Smyth, 2016). Surprisingly, in this
1
literature, less attention has been paid to how grading bands for LC or academic standards have changed over time. A key feature of the Irish education system, as with many other European and international examples, is its system of external curriculum-based assessment, whereby achievement is defined according to an external standard, as opposed to a standard of students in a classroom or a school. Such systems seek to signal academic standards through the examination and assessment system, and the latter is often used as a mechanism to harmonise/standardise educational standards across schools, or to raise academic standards nationally. However, it is also well established that external curriculum-based assessment systems often result in high stakes for the student (Bishop 1997; Adnett, et al., 2002; Smyth, et al., 2011; Baird, et al., 2014). Furthermore, as we know from other institutional contexts, the redefinition of standards through the assessment system can lead to confusion (Pring, 2018).
In the Irish context, the LC grading bands have experienced a number of inceptions that are documented in various sources. In the following section, three main time phases of grading band reform have been distinguished and will be discussed. These include the periods: 1969–1991; 1992–2016; and 2017–the present.
The period 1969–1991
Chapter 1 | 3
TABLE 1.1 GRADING SCHEME FOR LEAVING CERTIFICATE EXAMINATION, 1969–1991
Leaving Certificate grade Percentage
A 85–100
B 70–84
C 55–69
D 40–54
E 25–39
F 10–24
NG <10
Source: Coolahan (1981).
The period 1992–2016
In 1992, a decision was taken to increase the number of grading bands used to award performance in the LC examination (see Table 1.2). The reform was pragmatic, driven by a rationale to reduce the amount of random allocation for selection to HE. It is documented by the Transitions Reform Steering Group that this change in grading bands took place ‘at the request of the higher education institutions’. Furthermore, it was stated that:
this change to a 14-point grading scale for reporting Leaving Certificate achievement was made, not to improve the quality of reporting, but to improve the means by which the results of the examination could be used for selection for third-level education. There was no press for this change from within the school system
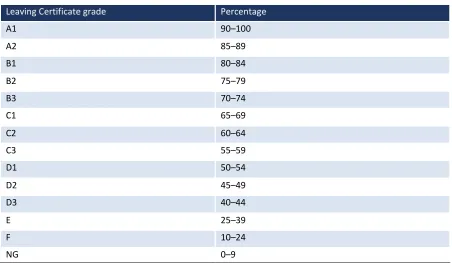
TABLE 1.2 GRADING SCHEME FOR LEAVING CERTIFICATE EXAMINATION, 1992–2016
Leaving Certificate grade Percentage
A1 90–100
A2 85–89
B1 80–84
B2 75–79
B3 70–74
C1 65–69
C2 60–64
C3 55–59
D1 50–54
D2 45–49
D3 40–44
E 25–39
F 10–24
NG 0–9
Source: CAO, various reports.
The reform meant that 14 grading bands were now used. What has attracted less attention in the Irish context is that the new grading system redefined the standards of academic achievement, creating a new award for high achievers in higher and ordinary papers – the new A1 band. While previously, an ‘A’ grade was applied to students who achieved between 85 and 100 per cent, an ‘A1’ grade was now applied to those who achieved between 90 and 100 per cent and an ‘A2’ grade to those who achieved the narrow band of 85–89 per cent. While an expanded granularity was applied to each of the existing grades, with the use of 5 percentage point grade intervals, the value of the pre-existing grades was generally maintained. That is, where the previous ‘B’ grade captured those within the 70–84 per cent range, three B grades (B1, B2, B3) were now used; the previous ‘C’ grade, which captured those within the 55–65 per cent range, was now replaced with three C grades (C1, C2, C3) and the previous ‘D’ grade, which captured those within the 40–54 per cent range, was now replaced with three D grades (D1, D2, D3). ‘E’ and ‘F’ grades remained the same. The new grading scheme maintained an ‘NG’ grade for those achieving between 0 and 9 per cent.
It would appear that little research regarding the reform was conducted at the time. However, there are reports of an increase in the number of requests from LC candidates for remarking scripts (Government of Ireland, 1999, p. 66). It was also at this time that concern began to emerge regarding variation in grading practices across subjects (Kellaghan and Millar, 2003).
Chapter 1 | 5
A strong argument can be made in favour of a system of broader grades on the basis that the relative reliability levels would be higher with a differential of 10 or 15 points than 5 percentage points. However, at the same time the Commission recognises that the 5 percentage point range has a general public acceptability and that a move away from this would increase the likelihood of random
selection (Government of Ireland, 1999, p. 67).
The period 2017–the present
The final phase of grading band reform occurred as a result of the recommendations of the Transitions Reform Steering Group, which was established in 2012, to examine a range of issues relating to the transition from second-level to further education and HE. The group is chaired by the Secretary General of the DES and includes representatives from the Higher Education Authority (HEA), the Irish Universities Association (IUA), Institute of Technology Ireland, Quality and Qualifications Ireland, the National Council for Curriculum and Assessment, the State Examinations Commission (SEC) and Solas. In 2017, following recommendations from the SEC Transitions Reform Steering Group, the new grading bands for the LC were applied (see Table 1.3) alongside revised grading bands for the Junior Certificate (JC) examination. The SEC accompanied the new grading scheme with the instruction ‘… grades are derived from marks not percentages … Rounding up to the next grade band is not permissible’. This phase of reform comes at a time when reform of grading bands for GCSE is occurring in England (Parameshwaran, 2015; Barrance and Elwood, 2018).
While a number of rationales were put forward for the reform, a discourse around improving academic standards is evident, representing a departure from previous reforms. A 2011 report by the Transitions Reform Steering Group argued for:
A return to a seven-point scale, or even an eight-point scale (leaving two points within the A grade to encourage the highest achievers—a system weakness according to our PISA data) would support greater
reliability and validity of the examination grades (NCCA, HEA, 2011, p.
15).
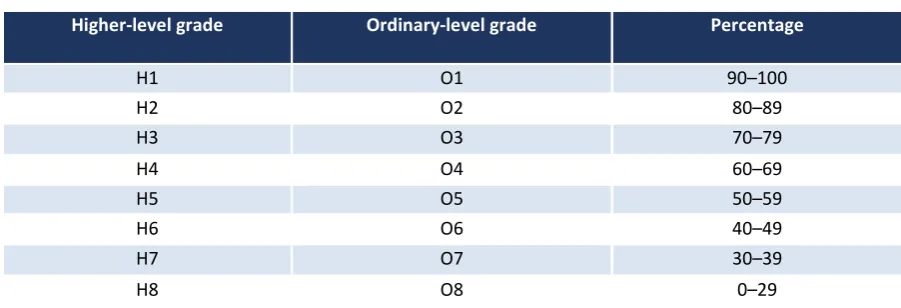
TABLE 1.3 GRADING SCHEME FOR LEAVING CERTIFICATE EXAMINATION, 2017
Higher-level grade Ordinary-level grade Percentage
H1 O1 90–100
H2 O2 80–89
H3 O3 70–79
H4 O4 60–69
H5 O5 50–59
H6 O6 40–49
H7 O7 30–39
H8 O8 0–29
Source: CAO briefing, 2016.
In a number of ways, this reform redefined the standards of academic achievement, as well as the expression of the standards, more dramatically than before. Firstly, and for the first time, the reform explicitly included the level of achievement in the name of the grade. For example, while previously an A1 grade represented high achievers in both higher-level and ordinary-level papers, the new grading scheme now distinguishes the level of study using separate naming conventions ‘H1’, ‘O1’, and so on. Secondly, the number of grading bands has been reduced from 14 to 8 bands for higher-level papers and 8 bands for ordinary-level papers. Thirdly, the standard for high achievers in higher and ordinary papers has been maintained, as those achieving a grade of between 90 and 100 continue to receive the highest grade available (previously an A1, now an H1 or an O1). Yet, the standard for achievement has changed for subsequent grades. That is, the new grades H2/O2 to H6/O6, both map onto and at times overlap the previous grade boundaries. For example, the new H2 and O2 grades now capture those within the 80–90 per cent range, replacing what were the A2 and B1 grades. The new H3 and O3 grades now capture those within the 70–79 per cent range, replacing what were the B2 and B3 grades. The new H4 and O4 grades capture those within the 60–69 per cent range, replacing the C1 and C2 grades. The new H5 and O5 grades capture those within the 50–59 per cent range, replacing the C3 and D1 grades. The new H6 and O6 grades capture those within the 40–49 per cent range, replacing the D2 and D3 grades. In terms of lowest levels of achievement, the H7/O7 and H8/O8 grade bands now replace the previous ‘E’, ‘F’ and ‘NG’ grade bands, while at this level, the standards of academic attainment have been largely maintained. For example, the new H7 and O7 grades capture those within the 30–39 per cent range, representing a narrower grade boundary, replacing the previous grade of ‘E’ (25–39 per cent). Finally, the new H8 and O8 grades capture those within the 0–29 range, replacing the ‘E’, ‘F’, and ‘NG’ grades. This period of reform of grade bands represents the most radical change for redefining academic standards at LC-level.
Chapter 1 | 7
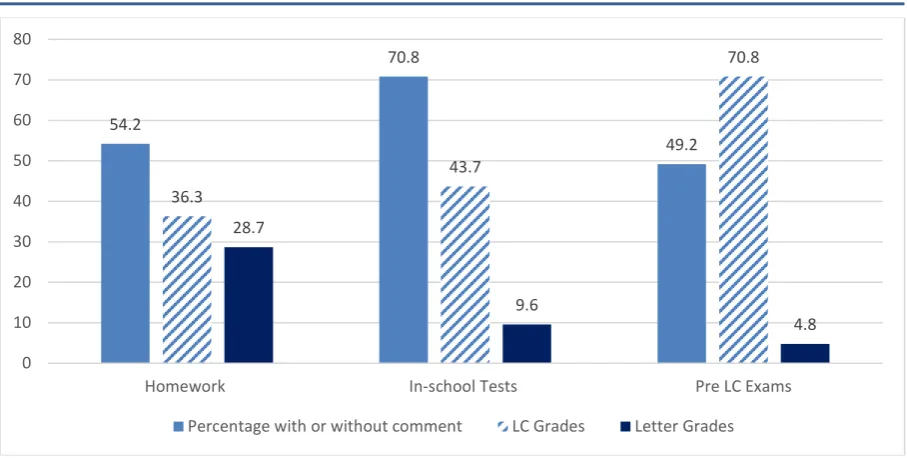
FIGURE 1.1 PERCENTAGE OF TEACHERS USING LC GRADING BANDS FOR ASSESSMENT
Source: Taken from Boland and MacNeela (2013, pp. 6-9).
In the Boland and McNeela study, the use of grading bands was associated with attempts to encourage students to have realistic expectations for grades achieved in the terminal LC examination; to facilitate understanding of the grading and marking system used by examiners; to allow students to realise their level of achievement as they progress through senior cycle; and to help justify the grade using the marking system. The research also indicated that teacher practices were influenced by school management and by parents, which favoured the use of the LC grading bands. Concern was also expressed by some teachers that ‘students don’t really understand LC grading system’ (p. 26) and that the ‘LC grading system is in a state of flux at the moment’ (Boland and MacNeela, 2013, p. 29).
1.3
DEVELOPMENT OF A COMMON POINTS SYSTEM
The following section seeks to locate changes over time to grading bands, to the development of a common points system as a selection mechanism for entry to HE.
The period 1969–1991
The discourse surrounding the implementation of the grading bands in 1969 is strongly tied to the emergence of a points system. The period leading up to the implementation of the A–F grading bands in 1969 is portrayed as a time when certain selective courses in higher education institutes (HEIs) started to become over-subscribed. Such HEIs had initially adopted the practice of open entry as a selection mechanism, which restricted access on the basis of performance at the end of first year (Clancy, 2015). It is well documented that the points system as we know it originated at the Medical Faculty at University College Dublin (UCD) in 1968 and extended to other departments and faculties in the university, as demand began to exceed the number of places available (Clancy, 1981; 2015). The UCD points system combined LC results and scores on the matriculation examination. At
54.2
70.8
49.2
36.3
43.7
70.8
28.7
9.6
4.8
0 10 20 30 40 50 60 70 80
Homework In-school Tests Pre LC Exams
Chapter 1 | 9
this time, students could combine the best results from two LCs, and a double score was awarded on Grades A–D on a higher paper in mathematics.
At this time (prior to the late 1960s), entry to HE was largely dependent on the possession of minimum entry requirements, but also the ability to pay course fees and expenses. The one exception was admission to the colleges of education, for which a quota or cap in the numbers was in place by the Department of Education. However, the admission process was competitive, based largely on results in the LC examination, as well as an interview (Clancy 2015, p. 88). At this time, applicants applied individually to HEIs, and many third-level institutions also required applicants to travel to a variety of colleges for interview and to present portfolios of work relevant to their chosen area of study (O’Donoghue, et al., 2017). It is documented that by 1970, the volume of applications resulted in considerable complexity for HEIs and applicants, given that individual candidates applied directly to multiple institutions. There were also calls for the introduction of the numerus
clausus – to limit the number of students – particularly for certain professional
courses.
Coolahan later reflected on the influence of the development of a points system for the LC examination, indicating that:
A further pressure was added to the Leaving Certificate examination and the universities matriculation examination in 1968, when universities began to operate a points system to select candidates for entry into some faculties where student numbers were restricted. The increased number of second-level students competing for limited occupational opportunities and university places has led to greatly
increased competitiveness in the examinations (Coolahan, 1981,
p. 199).
Furthermore, the advent of the points system coincided with a time when the third-level student grant scheme was introduced. As stated by Coolahan (1981):
Ironically the third-level student grant scheme introduced in 1968 tended to lessen the competitiveness which had existed for university scholarships, but the introduction of the points system in the same year reintroduced competitiveness. Many teachers and parents feel that the examinations and the entry requirements to third level have come to exercise a distorting influence on the whole process of second-level education.
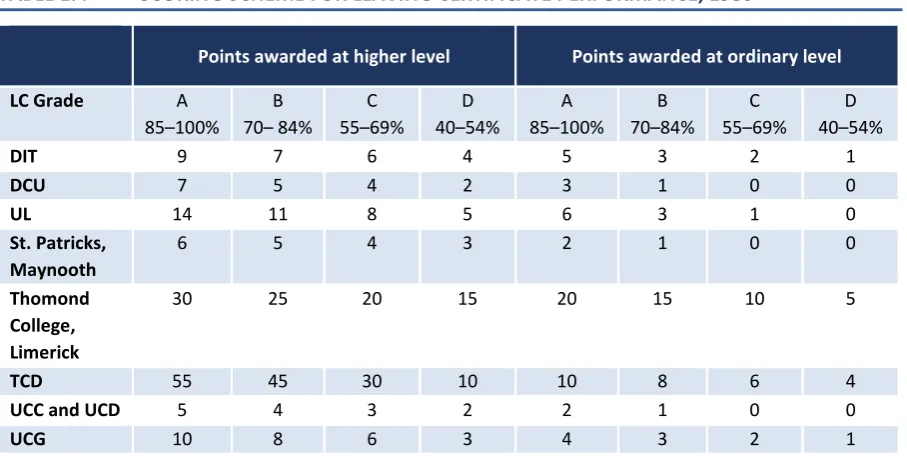
This period also represents the foundation of the Central Applications Office (CAO). In the summer of 1975, agreement for the project was achieved between the university heads and the Higher Education Authority (HEA). In 1976, the CAO was established to facilitate application for first year admission to the five university colleges at that time and was implemented for the autumn 1977 intake. The new system radically changed the admission process, as applicants could now submit a single application for entry to HE courses. At this time, the CAO had limited functions – facilitating the allocation of places, as opposed to calculating scores for HEIs, which came later. However, the service has retained some of its key features since that time. For example, points continue to be calculated from the top six subjects (Coolahan, 1981) and applicants list courses in order of preference. That is, since that time, applicants are ranked based on their total point score in six subjects, and those with the highest points secure the most selective places. Prior to this time, in the absence of a common points system, alternative variations of a points or scoring scheme were applied across HEIs, resulting in considerable institutional variation, which is shown in Table 1.4.
TABLE 1.4 SCORING SCHEME FOR LEAVING CERTIFICATE PERFORMANCE, 1980
Points awarded at higher level Points awarded at ordinary level
LC Grade A
85–100% 70– 84% B 55–69% C 40–54% D 85–100% A 70–84% B 55–69% C 40–54% D
DIT 9 7 6 4 5 3 2 1
DCU 7 5 4 2 3 1 0 0
UL 14 11 8 5 6 3 1 0
St. Patricks,
Maynooth 6 5 4 3 2 1 0 0
Thomond College, Limerick
30 25 20 15 20 15 10 5
TCD 55 45 30 10 10 8 6 4
UCC and UCD 5 4 3 2 2 1 0 0
UCG 10 8 6 3 4 3 2 1
Source: CAO college scoring systems pamphlet, direct communication with CAO July 2018.
As the points system gained momentum as a vehicle for HE selection, academic studies began to emerge in the 1970s that examined the predictive value of the LC for subsequent university performance (for example Nevin, 1974; Moran and Crowley, 1978/79). Around this time, academic requirements also had an impact on eligibility for the third-level grant scheme. According to Coolahan (1981):
Chapter 1| 11
chemistry, physics, agricultural science, agricultural economics, and
technical drawing (Coolahan, 1981, p. 212).
At the time, in order to be eligible for a grant, students must have achieved four grade Cs on higher or common papers in subjects accepted for matriculation.
Between 1970 and 1980, the HE system experienced considerable expansion, during which 12 new publicly funded third-level institutions were launched (White 2001; McCoy and Smyth, 2010), while the CAO continued to regulate admission to first-year undergraduate programmes. It was not until 1989 that the computerisation of LC examination procedures by the Department of Education came into play, followed by the construction of a computer network in 1995 connecting all of the CAO participant HEIs. This period also marked the emergence of a binary system of HE – in 1991, the regional technical colleges (subsequently renamed the institutes of technology) participated in the CAO (for further details see McCoy and Smyth, 2010).
The period 1992–2016
As indicated in Section 1.2, in 1992 a decision was taken to increase the number of grading bands used to award performance in the LC examination. The rationale for reform was pragmatic and driven by a concern from HEIs regarding the use of random selection for entry to HE. At this time, the colleges of education had joined the CAO and the functions of the CAO were expanded to include calculating scores on behalf of HEIs. Furthermore, around this time, the rights and responsibilities of third-level institutions for the admission of students became enshrined in legislation. While separate matriculation examinations were provided by both the colleges of the National University of Ireland (NUI) and Trinity College Dublin (TCD) to select for college entry as an alternative to the LC route, in 1992 the NUI
matriculation examination was suspended.2
In 1992, with the new 14-point grading scale, came a new common points scheme (see Table 1.5). Three important changes occurred with the inception of the CPS. Firstly, the number of points awarded to each of the grading bands changed across all HEIs and was now harmonised. This represented a considerable departure from the points system previously outlined in Table 1.4. Secondly, at higher level, the highest achievers continued to receive the greatest number of points (100 points), with a 10 percentage-point grade now differentiating the A1 and A2 grades. The greatest number of points awarded on an ordinary-level paper for the highest level of achievement was set at 60 for an A1, while 50 points were awarded for an A2. This was against the recommendations of the commission, which later stated ‘there should be a gap of 5 points between grades A1 and A2 on Ordinary Level Papers’ (Government of Ireland, 1999, p. 68). Beyond A1 and A2 grades in higher- and ordinary-level papers, points were awarded in 5 percentage point bands. Finally,
there were some interesting developments in terms of the value or equivalence of an ordinary paper relative to an honours paper. In terms of comparability, pre-1992, the number of points awarded to an ‘A’ grade on an ordinary-level paper varied but was typically located between a ‘C’ and a ‘D’ grade on a higher-level paper. In the new system adopted in 1992, the value of an ‘A’ grade was more clearly articulated, where an ‘A1’ on an ordinary paper was awarded the same number of points as a ‘C3’ on a higher-level paper, while an ‘A2’ was awarded the same number of points as a ‘D2’ on a higher-level paper.
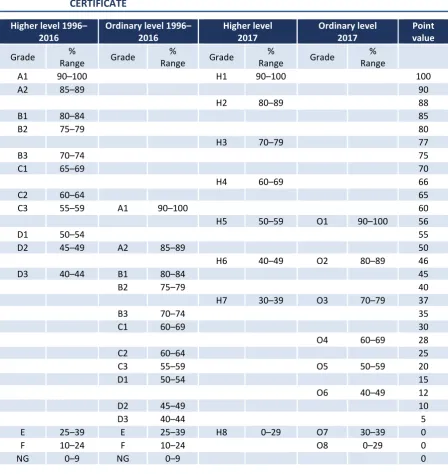
TABLE 1.5 CHANGES TO GRADING STRUCTURE AND POINTS SCHEME FOR LEAVING
CERTIFICATE
Higher level 1996–
2016 Ordinary level 1996–2016 Higher level 2017 Ordinary level 2017 value Point
Grade Range % Grade Range % Grade Range % Grade Range %
A1 90–100 H1 90–100 100
A2 85–89 90
H2 80–89 88
B1 80–84 85
B2 75–79 80
H3 70–79 77
B3 70–74 75
C1 65–69 70
H4 60–69 66
C2 60–64 65
C3 55–59 A1 90–100 60
H5 50–59 O1 90–100 56
D1 50–54 55
D2 45–49 A2 85–89 50
H6 40–49 O2 80–89 46
D3 40–44 B1 80–84 45
B2 75–79 40
H7 30–39 O3 70–79 37
B3 70–74 35
C1 60–69 30
O4 60–69 28
C2 60–64 25
C3 55–59 O5 50–59 20
D1 50–54 15
O6 40–49 12
D2 45–49 10
D3 40–44 5
E 25–39 E 25–39 H8 0–29 O7 30–39 0
F 10–24 F 10–24 O8 0–29 0
NG 0–9 NG 0–9 0
Source: CAO reports, various years
Chapter 1| 13
Programme for the Millennium, which included the appointment of a ‘high-powered’ group to examine the system of selection for third-level entry. The commissioni was chaired by Áine Hyland and prepared an extensive background document (an account of the system at the time, discussion of contextual factors, summary of selection procedures in other countries) and commissioned research, invited submissions and held a number of public meetings. Recommendations pertaining to the points system and selection for HE centred around the harmonisation of basic or special subject entry requirements across institutions, and the discontinuation of the practice of awarding bonus points for any subject. The commission also recommended a modification of points allocated to grades, specifically, ‘that the number of points awarded to those with a higher level A1 should be reduced from 100 to 95’ and that ‘there should be a gap of 5 points between grades A1 and A2 on ordinary level papers … and on balance suggests an increase in all ordinary level grades (other thanthe A1) by 5 points’ (Government of Ireland, 1999, p. 156). These recommendations lay amid proposals to broaden provision of non-standard entry routes, taking into account lifelong learning, mature students, part-time students, students from socio-economically disadvantaged areas, and students with disabilities. However, according to Clancy, these recommendations did not gain traction:
Its [the commission’s] proposals for changes in respect of entry to third level for school leavers were much less consequential and did not lead to fundamental change in the operation of the system. Thus, it was with no surprise that dissatisfaction with the points system resurfaced
(Clancy, 2015, p. 94).
During this time, HEIs continued to make changes to their selection mechanism through matriculation requirements. A number of changes to the matriculation requirements, and to how HEIs award educational attainment in the LC, are noteworthy. First, in 2009, the Health Professions Admission Test (HPAT-Ireland) was introduced to contribute to entry and selection for medicine, alongside performance in the LC. Second, in 2012, and impacting many more students, under a four-year pilot scheme, the seven universities, Dublin Institute of Technology and the Royal College of Surgeons made a decision to allocate bonus points for a D3 grade or higher in higher-level mathematics,3 the rationale being that the type of
students that are needed for the knowledge society would now ‘move up’ in the CAO queue. On this point, there is a long-standing practice of awarding additional marks or ‘bonus points’ to students sitting the LC examination through Irish. This dates back to the 1920s and was introduced as a mechanism to ‘strengthen the position of the Irish language in the education system, with the long-term objective of maintaining and reviving its use in every day life’ (Mac Aóghain, Millar and Kellaghan, 2010, p. 25). It is interesting that the practice of awarding bonus points in mathematics, and additional marks for students sitting their examinations through Irish, continues, despite the explicit recommendation from the Commission on the Points System that ‘institutions should not treat one element of the Leaving
Certificate programme as more important than other elements’ (Government of
Ireland, 1999, p. 64).
During this period, the common points system also attracted criticism from those working in the area of educational inequality. For example, it was argued that the points system upholds an ‘essentialist view of the individual in education’, explaining differences in school attainment in individual terms, rather than structural attributes (Lynch, 1987, p. 107; Drudy and Lynch, 1993). In 2003, variation in grading practices across LC subjects became the focus of research conducted by the Educational Research Centre (ERC). That is, at the time there had been perceptions relayed in ‘official documents’ and the media that it was easier/harder to obtain higher grades in some subjects of the LC than others (Kellaghan and Millar, 2003, p. vii). It was argued that variation in grading was having an impact on student decision-making when choosing subjects for examination in senior cycle. The minister for education at the time commissioned research from ERC to investigate the claims. The research concluded that there was some evidence to suggest that academic achievement in the LC was related to grading practices, given variation identified between subjects in the mean score awarded, as well as in the distribution of grades for each of the years under investigation (1996, 2000, 2001). In particular, it identified that students taking subjects that involved verbal and/or logico-mathematical reasoning had an advantage in grading, while those taking subjects that required sensorimotor, aesthetic or spatial relation skills were at a
3 In 2012, phase 1 of project mathematics was also applied to all schools and examined in the LC, with the
Chapter 1| 15
disadvantage. Recommendations were made to ‘improve grading practices with the objective of ensuring grading equivalence’ (Kellahan and Millar, 2003, p. 120). Furthermore, the SEC was established in 2003.
In 2011, the selection of school leavers for third level was once again under scrutiny, but this time within a broader context of the transition from second to third level. While a number of actions for the Transitions Reform Steering Group were outlined in a 2011 document (NCCA, HEA, 2011), three clear steps for reform dominated their work from 2013 onwards:
• a commitment to address any problematic predictability identified in an
analysis of predictability in the LC examination;
• a commitment to reduce the number of grading bands used in the LC
examination;
• a commitment to significantly reduce the number of programme offerings
for a broader undergraduate entry to level-8 honours degree programmes in the universities and to review level-8 programme provision in the institutes of technology, to ensure a mixed portfolio of programmes with denominated and generic entry.
As part of the work of the Transitions Reform Steering Group, research was commissioned by the SEC to investigate issues relating to the predictability of the LC (Baird et al., 2014). Reporting on the findings of the research, the Transitions Reform Steering Group (2015, p. 12) stated:
concerns about the predictability of the Leaving Certificate examination question content were not sustained by the findings of this research overall. None of the examinations was found to be very problematically predictable in these terms.
In the report, Baird et al. (2013, p. 20) noted ‘no subject was considered to be very problematically predictable overall by the subject specialists, the teachers or the students’. Rather, question formats were reviewed by external subject specialists as ‘helpfully predictable’, as they allowed students to prepare for the examination. In essence, the report recommended that the transparency of the examination process should be maintained.
Chapter 1| 17
more especially ‘the drilling of students with pre-prepared examination answers that they do not fully understand’ (p. 28). The reviewers outlined that while it was important for students to understand examination formats, they cautioned the education system, teachers and students against ‘taking this too far’ (p. 28).
By 2016, the CAO was servicing 41 HEIs and regulating admission to 934 courses for an all-time peak of 81,276 applicants (CAO, 2016). By 2016, 50,766 students sat the LC and 100,793 students were attending HE (DES 2015/16 Statistical report).
2017–the present
In line with recommendations from the Transitions Reform Steering Group, in 2017 new grading bands were applied (see Table 1.5). The group stated that:
very extensive and detailed modelling and testing has been conducted by the higher education institutions, with the assistance of both the CAO and other technical experts, to ensure that the revised scale is fair
and equitable to all students.4
A number of changes occurred with the CPS which are notable and have implications for the construction of academic standards. First, while at higher level the highest achievers continued to receive the greatest number of points (100 points), the highest level of achievement on an ordinary paper has been reduced from 60 points to 56 points. Second, the points differential between the grading bands has changed and the points differential between grades is lower for ordinary papers than for higher-level papers. For example, there is a differential of 12 points between the H1 and H2, and ten between the O1 and O2, and so on. Third, a decision was made to reward points to an ‘H7’ grade, which represents the grading band of 30–39 per cent in order to ‘encourage the take-up of Higher Level subjects at Leaving Certificate … and to reduce for a student the risk of taking Higher Level examinations’ (Transitions Reform Steering Group 2015, p. 16). The number of points awarded is 37, considerably lower than the number of points awarded to an O1 (56) and equivalent to an O3. This explicit measure to raise aspirations at the individual level and raise educational standards at the national level emerged in the later work of the Transitions Reform Steering Group. In terms of comparability, it is less easy to compare the 1992 system with the 2017 system. However, a student achieving an O1 receives the same number of points as a student receiving an H5. Finally, bonus points continue to be awarded to those who achieve an H5 or higher in mathematics, as are additional marks to students who sit the LC examination through Irish. There is no formal/publicly available evaluation of the bonus point scheme, even though the scheme was introduced on a four-year pilot basis in 2012.
The changes to the points system have also been accompanied by revised basic matriculation requirements by the universities and institutes of technology and are
set out in Table 1.6. A variety of basic attainment matriculation requirements exist, given that universities and institutes of technology each set out their own matriculation requirements. While applicants must obtain a pass in at least six subjects, HEIs also set basic matriculation requirements with regard to particular subjects, and often include passes in Irish, English, a third language or mathematics. Where mathematics is required for matriculation, increasingly a subject entry requirement of an H4 has been set, well above the H7 grade which seeks to encourage the take-up of higher-level subjects at LC.
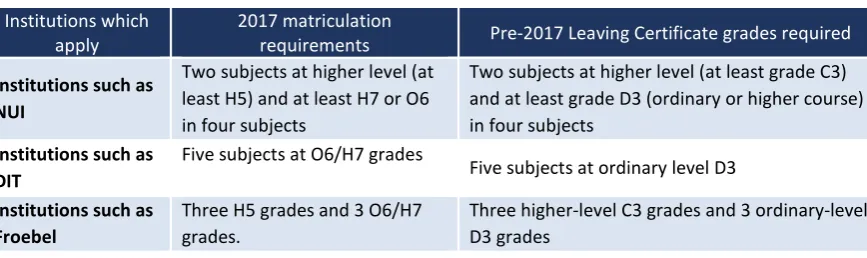
TABLE 1.6 HIGHER EDUCATION MATRICULATION REQUIREMENTS, PRE- AND POST-2017
Institutions which
apply 2017 matriculation requirements Pre-2017 Leaving Certificate grades required
Institutions such as NUI
Two subjects at higher level (at least H5) and at least H7 or O6 in four subjects
Two subjects at higher level (at least grade C3) and at least grade D3 (ordinary or higher course) in four subjects
Institutions such as
DIT Five subjects at O6/H7 grades Five subjects at ordinary level D3
Institutions such as
Froebel Three H5 grades and 3 O6/H7 grades. Three higher-level C3 grades and 3 ordinary-level D3 grades
1.4
RESEARCH ON THE LEAVING CERTIFICATE
Research has repeatedly shown that the LC has strong implications for school leavers’ post-school outcomes. That is, those who secure high levels of attainment in the LC have a greater probability of going directly into HE, while labour market participants are more likely to be found among those with the lowest LC grades, or those who had taken the LCA, even when controlling for a range of factors known to influence post-school pathways (McCoy et al., 2014). In the Irish context, HE is the dominant pathway taken by students at senior cycle and entry is largely dependent on the grades that students achieve. As indicated above, the subjects they take at senior cycle have implications for matriculation. Attainment in the LC also structures the type of HE to which students secure entry (McCoy and Smyth, 2010; Byrne and McCoy, 2017), with consequences for graduate wages and outcomes (Kelly, O’Connell and Smyth, 2010). Research also suggests that examination grades and subjects taken have direct effects on school leavers’ employment outcomes in Ireland, independent of the number of points attained in the LC (Smyth 2008; Breen et al., 1995; Iannelli and Smyth, 2017).
Chapter 1| 19
et al., 2014a; McCoy et al., 2014b). The LC and the points value associated with grades shape how post-school pathways are perceived by young people and society
more generally. In the Leaving School in Ireland Study, McCoy et al. (2014b)
empirically demonstrate how ‘grades play an important role for young people in accessing a valued pathway’, all else being equal (p. 104). They also shape the experience of young people with their parents, outside school. In their interviews with school leavers, the researchers report how academic performance is monitored by parents. Some young people are ‘grounded’ by their parents when grades are not achieved, and grind-taking is seen as a solution to ‘bad grades’.
In the past, the LC has been described by politicians and by the teacher unions as ‘brutal, but fair’. However, research has consistently shown that the idea of rewarding those who perform best, a concept underpinned by meritocratic ideals, is flawed. It is well established that the opportunity structure in education is unequal. Research consistently shows that ‘school effects’, to include school organisation and process, among other factors, play a considerable role in the educational opportunity structure (McCoy et al., 2014b). For example, research shows how school organisation and process shape access to the curriculum and the take-up of higher-level subjects in both junior cycle and senior cycle. The same is true of early school leaving and experiences of school (Smyth 1999; Byrne and Smyth 2010; Byrne and McCoy 2017; Smyth, 2018). That is, aspects such as the gender mix of the school, the social class mix of the school, and in particular ability grouping practices adopted in the school each exert independent effects on access to the curriculum. These aspects of school organisation and process also shape attainment in the LC and clear school effects have been identified in transition probabilities to HE and post-school outcomes (Smyth and Hannan, 2007; Byrne 2008; Smyth et al., 2011; McCoy et al., 2014b). Furthermore, the influence of educational attainment extends beyond the economic domain of people’s lives, representing longer-term high stakes for young people. Such studies point to how those without a LC are more likely to have poor physical and mental health outcomes (Smyth and McCoy, 2009).
teachers to recap on material they do not understand (McCoy et al., 2014b). The nature of learning promoted by the LC examination papers has also been examined (Cullinane and Liston, 2016; Burns et al., 2018). Each of these studies has reached the conclusion that the nature of assessment used in the LC is found to reward lower-order skills, especially memory recall. These findings are supported by a survey of school leavers conducted by McCoy et al. (2014b), where the majority (70 per cent) felt there was too much to remember. To this end, the examination itself has been described by a majority of students as ‘requiring too much writing’ and over half (52 per cent) found that the examination schedule is too demanding (McCoy et al., 2014b).
Accounts of student stress and pressure have been consistently reported in relation to the demands of the LC, with students being positioned as objects of the assessment process (Smyth and Banks, 2012). While students are likely to indicate that it is in fact themselves ‘putting pressure on myself’, schools and parents have also been articulated by students as drivers of pressure (McCoy et al., 2014b; Banks and Smyth, 2015). Specific aspects of schooling that contribute to student stress include the quality of student-teacher interaction and peer relations within the school (Banks and Smyth, 2015). Furthermore, stress levels reported midway through sixth year have been found to be strongly predictive of stress levels three to four years after leaving school (McCoy et al., 2014b), contributing to the construction of ‘learning’ as a high-stress activity.
1.5
STRUCTURE OF THE REPORT
CHAPTER 2
Research methodology
2.1
INTRODUCTION
This study builds on a large body of work, undertaken at the ESRI and elsewhere, on student experiences of second-level education. Increasingly, mixed-method research designs are seen as the gold standard for examining complex interventions applied in heterogeneous environments, with this becoming a highly valued research approach in the Irish context over the last ten years. Most recently, mixed-method research has examined the role and impact of digital technologies in teaching and learning across second-level schools (McCoy et al., 2016). The
Leaving School in Ireland study similarly took a mixed-method approach to
examining how school experiences shaped the post-school decision-making and pathways of young people (McCoy et al., 2014b). The study has two main elements: analysis of individual-level examination data and case-study research in ten schools. Chapter 3 draws on State Examinations Commission (SEC) Leaving Certificate (LC) examination results for the period 2015 to 2017. Comparing the take-up of subject levels and grades in 2016 and 2017 allows us to assess the extent to which the change in the grading structure resulted in any initial changes in student behaviour. Including information on 2015 allows us to examine whether changes were already underway in level take-up and examination performance even before the grading structure changed. The analyses presented are confined to mainstream second-level schools and therefore exclude information from external examination candidates, special schools and non-school settings. Chapters 4 and 5 provide evidence from the case-study research, details of which are provided below.
2.2
RESEARCH DESIGN
The study began with a desk-based research phase. This involved a review of Irish and international literature on the types of grading schemes used internationally and the impact of different grading schemes. The review also outlines key policy changes in the Irish context and research on the nature and impact of the LC examination in Ireland. The empirical analysis involves two main components: analyses of individual-level examination data to look at changes in behaviour at the school and student levels, and in-depth case-study research in ten schools.
2.2.1 Analysis of State Examinations Commission data
associated with any initial changes in student behaviour. It does not definitively establish whether any such changes are due solely to the amended grading structure rather than other factors (such as trends in student motivation or level of preparation for the examination). However, including information on 2015 allows us to examine whether changes were already underway in level take-up and examination performance even before the grading structure changed. The relative stability in the distribution of grades year on year means that patterns in 2015 can be taken as broadly reflective of patterns in previous years.
The analyses presented in this chapter are confined to mainstream second-level schools and therefore exclude information from external examination candidates, special schools and non-school settings. In addition, the small number of students (1.4 per cent of the total) who took five or fewer LC subjects are excluded from analysis. Analyses are therefore based on 153,156 students in 697 schools. Firstly, descriptive analyses are presented of patterns of take-up of higher-level subjects over the period 2015 to 2017, looking at English, Irish and mathematics as well as the total number of higher-level subjects taken. The analysis considers whether the take-up of higher-level subjects changed between 2016 and 2017, as achieving an H7 grade became less ‘risky’ in terms of achieving points for higher education (HE) entry purposes. To take account of the fact that students attending the same school will resemble each other in their experiences and outcomes, multilevel modelling techniques are used for this clustering. Multilevel models are used in Chapter 3 to compare like with like in looking at shifts in take-up of higher level between 2016 and 2017. They can also indicate whether changes have been evident for some students or some types of schools rather than others. The models presented in Chapter 3 consider the gender of candidates and whether they had an examination fee waiver, which is taken as an indicator of socio-economic disadvantage. At the school level, the analyses consider school type (sector), DEIS (Delivering Equality of Opportunity in Schools) status, fee-paying status, whether or not the school is Irish medium, and school size.
Chapter 2 | 3
It should be noted that the SEC data do not cover all factors that are likely to influence subject take-up and performance. In particular, the examination fee waiver is a relatively crude measure of socio-economic background, and so the analyses cannot take into account variation between candidates in their social class background, levels of parental education and/or household income. The absence of detailed information on individual socio-economic background means that the ‘effect’ of attending particular types of school (such as fee-paying or Irish-medium schools) is overestimated. Similarly, the prior achievement profile of students in particular kinds of schools cannot be taken into account using the SEC data.
2.2.2 Case-study research
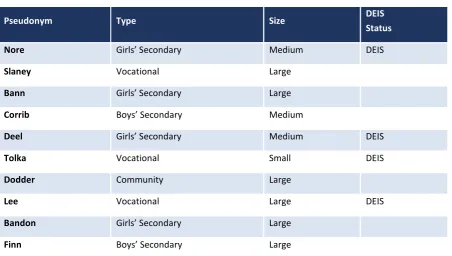
TABLE 2.1 DETAILS ON THE CASE-STUDY SCHOOLS
Pseudonym Type Size DEIS Status
Nore Girls’ Secondary Medium DEIS
Slaney Vocational Large
Bann Girls’ Secondary Large
Corrib Boys’ Secondary Medium
Deel Girls’ Secondary Medium DEIS
Tolka Vocational Small DEIS
Dodder Community Large
Lee Vocational Large DEIS
Bandon Girls’ Secondary Large
Finn Boys’ Secondary Large
Students
A key focus of the research is on students’ own experience and perceptions of the grading structure. In each school, two focus group interviews were conducted with groups of typically six sixth-year students, one group taking higher-level mathematics, the other taking ordinary-level mathematics. In selecting mathematics level, it was intended that a diverse group of higher- and lower-achieving students would be included in the case-study research. The students were randomly selected by the school principal from each of a higher and ordinary mathematics class and written consent from their parents was then sought (and provided before they could join the focus group). These interviews focused on:
• decision-making regarding subject-level take-up; sources of information
and advice used; perceived ‘risk’ in level take-up;
• exam preparation within and outside class; perception of mock exams;
perceived readiness for the LC exams;
• awareness of grading structure and implications for Central Applications
Office (CAO) points;
• perceived preparedness for further/HE and the world of work.
Chapter 2 | 5
Principals and guidance counsellors
Interviews with school principals and guidance counsellors in the ten schools explored school policy and practice across a range of areas. Specifically, the interviews explored a range of issues including:
• school policy and practice regarding ability grouping (including the use of setting);
• timing at which subject levels are selected;
• formal and informal guidance given on subject-level choice.
Teachers
Interviews with three teachers in each of the ten schools were conducted. These included English and mathematics teachers, as these subjects are commonly taught in set groups in senior cycle, and the teacher of an ‘optional’ subject where higher and ordinary level are taught in the same class. These optional subjects varied widely across the ten schools. These interviews focused on:
• how ability grouping is handled between and within classes;
• informal guidance on subject-level take-up; relative role of teacher and
student in the decision;
• teaching methods and examination preparation;
• perceptions of the change in grading structures.
Parents
Telephone interviews were undertaken with a small number of parents across the schools, to provide information on their awareness and perceptions of the change in the grading structure.
2.3
RESEARCH ETHICS
A detailed research plan was submitted to the ESRI Research Ethics Committee, to ensure that the highest standards were maintained throughout the study. The Ethics Committee comprises leading ESRI researchers and an external expert, and is chaired by Professor James Williams, Principal Investigator for the Growing Up in
Ireland study – a study that has been at the forefront of the development of ethical
research practices in Ireland. The committee signed off on the approach to interviewing young people and on how information is stored. Because many of the participants are under 18, all focus group interviews were conducted by two researchers. Informed consent of participants and their parents was secured using plain English language information leaflets. Parents and young people were assured, in a clear and comprehensible manner, that all of the information gathered would be confidential and would not be released to anyone in such a way to allow individual participants to be identified. Confidentiality was similarly assured for school personnel. Pseudonyms are used for the purposes of identifying the ten schools.
Chapter 2 | 7
2.4
SUMMARY
Chapter 3 | 1
CHAPTER 3
Analysis of Leaving Certificate examination data
3.1
INTRODUCTION
This chapter draws on State Examinations Commission (SEC) Leaving Certificate (LC) examination results for the period 2015 to 2017. Comparing the take-up of subject levels and grades in 2016 and 2017 allows us to assess the extent to which the change in the grading structure was associated with any initial changes in student behaviour. Including information on 2015 allows us to examine whether changes were already underway in level take-up and examination performance even before the grading structure changed. As indicated in Chapter 2, the analyses presented in this chapter are confined to mainstream second-level schools and exclude the small number of examination candidates who took five or fewer LC subjects. The second section of the chapter considers changes in the take-up of subjects at higher level, while section three examines changes in the performance within subject levels.
3.2
TAKE-UP OF HIGHER-LEVEL SUBJECTS
3.2.1 Descriptive analyses
Before looking at potential patterns in the wake of changes in the LC grading structure, it is worth examining longer-term trends in the take-up of higher-level subjects. Figure 3.1 shows higher-level take-up of English, Irish and mathematics over the period 2001 to 2015.5 The period as a whole saw a significant growth in
take-up of higher-level subjects, with take-up of higher-level English increasing by 15 per cent and, from a lower base, take-up of higher-level Irish increasing by 35 per cent. At the beginning of the period (2001), the rate of take-up of higher-level mathematics, at 18 per cent, was much lower than for English or Irish. However, take-up levels grew substantially, by 52 per cent over the period, especially from 2012 onwards, reflecting the impact of the introduction of bonus Central Applications Office (CAO) points for higher-level mathematics, as well as a change in the mathematics curriculum at junior- and senior-cycle level.
5 These figures are based on published results, so the take-up levels for 2015 are slightly different from those
FIGURE 3.1 TAKE-UP OF HIGHER-LEVEL ENGLISH, IRISH AND MATHEMATICS 2001–2015
Source: State Examinations Commission website.
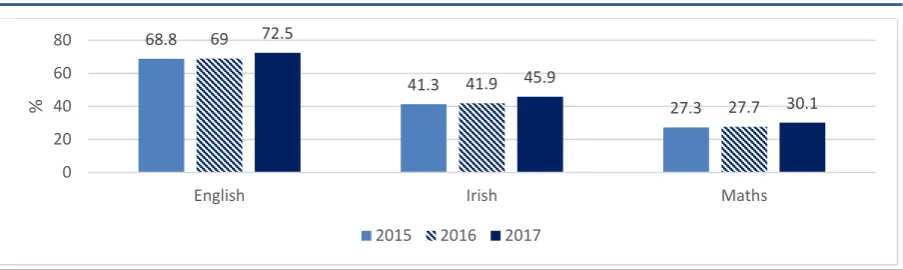
Figure 3.2 shows the proportion of examination candidates taking English, Irish and mathematics at higher level over the period 2015 to 2017. Prior to the introduction of the changed grading structure (that is, between 2015 and 2016), there was only a very small increase in the proportion taking higher level in the three subjects (ranging from 0.2 per cent to 0.6 per cent). However, after the change that applied to the 2017 cohort, there was a modest but significant increase in higher-level take-up for all three subjects. The net increase was largest for Irish at 4 per cent, compared with 3.5 per cent for English and 2.4 per cent for mathematics. Taking the increase relative to the base in 2016, take-up of higher-level Irish increased by 9.5 per cent,6 compared with 8.7 per cent for mathematics and 5.1 per cent for English.
[image:45.595.73.525.513.648.2]The extent to which these patterns hold when we take account of the characteristics of students and schools is explored below.
FIGURE 3.2 TAKE-UP OF HIGHER-LEVEL ENGLISH, IRISH AND MATHEMATICS 2015–2017
Source: State Examinations Commission.
Figure 3.3 shows the total number of higher-level subjects taken over the period 2015 to 2017. The average (mean) increased from 4.39 in 2016 to 4.62 in 2017; the mean for 2015 was very similar to that for 2016 at 4.37. The figure shows slight reductions in the proportions taking three or fewer higher-level subjects, with the
6 For example, the net change in take-up for Irish was 4 per cent (45.9 – 41.9); expressing 4 per cent as a
proportion of the base value (41.9) means that take-up increased by 9.5 per cent.
0 20 40 60 80
2001 2002 2003 2004 2005 2006 2007 2008 2009 2010 2011 2012 2013 2014 2015
%
Irish English Maths
68.8
41.3
27.3 69
41.9
27.7 72.5
45.9
30.1
0 20 40 60 80
English Irish Maths
%
Chapter 3 | 3
[image:46.595.72.525.163.393.2]proportion taking no subjects at higher level dropping from 8.1 per cent to 6.5 per cent. At the other end of the distribution, there was an increase in the proportion of students taking six or seven higher-level subjects (from 23.5 per cent to 26.1 per cent and from 14.6 to 16.4 per cent respectively).
FIGURE 3.3 TOTAL NUMBER OF HIGHER-LEVEL SUBJECTS TAKEN 2015–2017
Source: State Examinations Commission.
3.2.2 Multilevel analysis
The figures shown above do not allow us to examine whether changes over time may reflect the characteristics of students and/or schools rather than the impact of the grading changes. Multilevel modelling techniques can be used to compare like with like in looking at shifts between 2016 and 2017. They can also indicate whether changes have been evident for some students or some types of schools rather than others. The models presented in Table 3.2 and in the reminder of the chapter take account of candidate gender and whether the candidate has an examination fee waiver, which is taken as an indicator of socio-economic disadvantage. At the school level, the analyses consider school type (sector), DEIS (Delivering Equality of Opportunity in Schools) status, fee-paying status, whether the school is Irish medium or not, and school size. Because of the large size of the student population, model coefficients can be statistically significant without being of substantive value. Therefore, the analyses report only effects that are significant at the level of p<.05 or higher and refer to the relative size of the effects found.
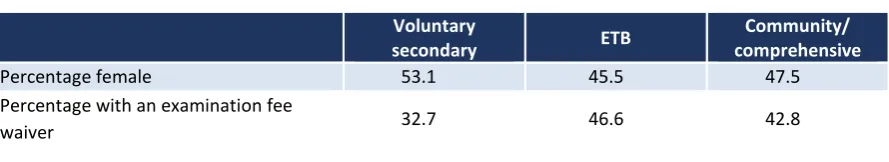
In interpreting the findings on school sector, it is important to note that the different school types differ in terms of their student profile. Table 3.1 shows that female candidates make up a significantly greater proportion of candidates in the voluntary secondary sector than in Educational Training Board (ETB) or community/comprehensive schools. Voluntary secondary schools also have a more advantaged profile, that is, fewer candidates entitled to an examination fee waiver.
8.1 6.3 7.5 9.3 12.7 16 23.5 14.6 2 6.5 5.3 6.6 8.5 12.3 16.4 26.1 16.4 2 0 5 10 15 20 25 30
0 1 2 3 4 5 6 7 8
%