EXPERIMENTAL EVALUATION OF THE ENERGY PERFORMANCE OF A
PHOTOVOLTAIC GENERATOR IN A PROCESS OF OPTIMIZATION OF
MECHANICAL COMPRESSION REFRIGERATION
Adingra Kouassi P. A., Touré Siaka, Traoré Diakaridja and Wanignon Fassinou F.
Department of Physics, Laboratory of Solar Energy, UFR Sciences of the Structures of the Matter and Technology, Félix Houphouët Boigny University, BP, Côte d’Ivoire, Abidjan
E-Mail: [email protected]
ABSTRACT
The design of a photovoltaic generator is generally obtained from the energy characteristics of the solar collector and from the daily light energy that falls on its surface. The optimization of this design depends essentially on the daily sunshine rate, the size of the photovoltaic generator and the energy behavior of the associated load. This article proposes an optimization of the performances of a photovoltaic generator through a concrete evaluation of the capacity electrochemical battery to install for the supply of a 150-liter DC refrigerator. In an experimental study, we characterized the solar energy potential of the city of Abidjan (Côte d'Ivoire-West Africa) and evaluated the energy performance of a photovoltaic generator (250 Wp/100 Ah) linked to a mechanical compression refrigerator. The results showed a mean daily irradiation between 3.5 and 5 Kwh/m2 for 6.5 hours of average insolation per day and a maximum photovoltaic energy production of 48 Ah/d of the solar panel. We obtained a maximum daily consumption of 30 Ah over a cumulative period of 12 hours of operation of the motor-compressor. The balance between production and consumption has confirmed a surplus of energy generated by the solar panel that can reach 45 Ah in front of an energy demand of the motor-compressor between 4 and 8 Ah, during the period of insolation. This experimental approach allows for an improved planning of the capacity electrochemical battery to install in photovoltaic solar refrigerators.
Keywords: photovoltaic generator, solar energy, energy storage, cooling, efficiency.
INTRODUCTION
Photovoltaic generators are solar energy conversion systems, difficult to optimize (Belhadj et al.,
2010). The performance of these systems can be evaluated from their ability to satisfy the energy requirement. The design, optimization and realization of high performance photovoltaic systems are topical issues (Kassmi et al.,
2007; Meah et al., 2008). In photovoltaic applications, the storage of electrical energy through batteries of voltages lower than optimal photovoltaic panels induces considerable energy losses (Chen et al., 2007; Jossen et al,
2004). These energy losses often make photovoltaic systems inefficient and very expensive to realize when the design of the PV generator (modules and batteries) has not been well baked. Various studies on electrochemical batteries show that the energy investment of a battery is very heavy (Alsema and Patyk, 2003; Mrabti et al., 2010). A lead acid battery costs for its manufacture about 200 times its storage capacity (Multon et al., 2004).
The purpose of this study is to show the possibility of reducing the electrochemical battery capacity to install in mechanical compression solar refrigerators. Our work is to establish a design model of the photovoltaic generator based on the energy behavior of the load: the internal charge of the refrigerator, the real time of operation and the daily energy consumption of the motor-compressor. The estimation of the behavior and the performances of the photovoltaic generator permit to establish an optimal energy design of the solar systems (Azzouz et al., 2007). Starting from the supply of a 150-liter refrigerator by a 250 Wp/100Ah photovoltaic generator, we will evaluate the key operating parameters
of this device for an improved management of available energy. This approach will permit to optimize sizing while reducing the cost of the solar refrigerator installations. These machines consume 20% of the residential consumption of electricity and contribute to the greenhouse effect of 2.25 billion tons of CO2 per year (ADEME, 1998).
MATERIALS AND METHODS
Synoptic schema of Figure-1 presents the experimental device. It is composed of a 250 Wp photovoltaic panel (1) which supplies the electrical energy, a 12V/10A charge and discharge regulator (2), a 100 Ah electrochemical battery (3) and a 59 W compressor motor unit (4) which is the load. For better sizing, we take into account the characteristics of each of these four elements.
Figure-1. Synoptic schema of photovoltaic generator.
terminals of the compressor motor (4). This stored energy is used to power the compressor unit in the case of non-productivity of the PV module. Its small capacity aims to limit the dependence of the refrigerator with respect to this element. As for the charge and discharge regulator (2), it makes it possible to stabilize the voltage at the terminals of the battery, but also to manage its charge/discharge.
The experiments were conducted at a site in
Abidjan (latitude=5˚18’34”N, longitude=4˚00’45”W), Côte d’Ivoire in West Africa. The system consists of a Danfoss compressor unit (supply voltage 12/24V, output current 2.41/4.46A, nominal power 42/59W), a charge and discharge regulator (12V/10A), a storage battery
(12V/100Ah) and a photovoltaic panel inclined 10˚ with
respect to the horizontal (Figure.2a) whose characteristics, under standard conditions (STC) (Wangandal, 2011), are summarized in Table-1.
Table-1. Photovoltaic panel characteristics. Monocrystalline SA-250
Nominal power 250 w
Nominal voltage 36 V
Nominal current 8 A
Open circuit voltage 42 V Short circuit current 9.2 A
Battery charging and discharging currents were collected each minute using two F407 multimeter clamps (Figure-2b). Current data is collected and recorded each minute. By integration over the duration of the experiment, we determined the energy produced by the PV panel and that consumed by the compressor unit.
The instantaneous solar radiation at the site is measured by a thermoelectric pyranometer installed on the roof of the building next to the PV panel (Figure-2a). The values of the illumination are collected in steps of 1 minute. The integration of these values on one day gives us daily irradiation. Daily energy and global irradiation were evaluated using Simpson’s numerical integration method (Verges, 1980).
Figure-2. Experimental device 1 for the collection of electrical and solar data.
The thermal evaluation of the refrigeration chamber was carried out using a data acquisition system consisting of three temperature recorders, a computer and thermocouples (Figure-3). The internal temperatures of the refrigerator are collected every 1 minute continuously for the duration of the experiment.
Figure-3. Experimental device 2 for the collection of temperature.
RESULTS AND DISCUSSIONS
The electrical energy produced by the PV panel is function of solar irradiation and temperature at the site (Dajuma et al., 2016; Bhattacharya et al., 2015). This energy must be sufficient for both the charging of the battery and the power supply of the compressor motor to ensure optimal operation of the refrigerator.
Variation of the energy produced by the PV Generator Relation (see Equation.1) expressed the intensity I of the current supplied by the PV generator (Lepage, 2012; Karatepe et al, 2006).
I = Iph − Io [exp (q(V+IRs)nKT ) − 1] −V+IRsRp (1)
In this relation, Ipv is the photocurrent which increases with illumination, I0 is the diode saturation current, V the voltage across the module, Rs the series resistance, Rp the shunt resistance, n the diode ideality factor, T the cell temperature and K the Boltzmann constant.
Figure-4. Variation of PV module and battery currents during a charging.
In Figure-4, we notice that the current produced by the module Ipv and the current received by the battery Ich follow the same pace at different amplitudes. Also, their intensities change according to the illumination E, namely, an increase between 10 h to 12 h with peaks of 9 A and a decrease is observed between 12 h and 14 h. We then observe a bell evolution of these three parameters. However, this evolution is not quite regular because of the different cloudy periods.
The energy Epv provided by the solar panel was plotted according to the values of the global irradiation which lies between 0 and 5 KWh/m2.d. The variation of this energy as a function of solar irradiation (Irrad) is presented in Figure 5.
Figure-5. Energy produced by the PV module according to solar irradiation.
The curve of Figure-5 shows that there is a linear correlation between the total energy Epv produced by the photovoltaic module and the incident solar irradiation. This energy increases strongly with global irradiation (R2=0.9861). The daily energy generated by our photovoltaic panel is estimated by the following relation (2).
Epv = 9.6658Irrad with R2 = 0.9861 (2)
Thus, the PV generator of 250 Wp is able to produce a daily energy which can reach 48 Ah during a
sunny day for Irrad=5 KWh/m2.d. It should be noted that this assessment was made according to the experimental conditions of the site, neglecting the long-term degrading effects of soiling and aging of the photovoltaic module. We know that the maximum power of the PV module decreases slightly with the temperature, especially for the strong illuminations (Belhadj et al., 2010; Aziz, 2006). The effect of temperature on the energy of the panel was not addressed in this study because the cells temperature highly depends of the illumination that falls on the surface of the solar panel (Aziz, 2006; Gélis et al, 2013).
In order to determine the efficiency of the charge and discharge regulator, we have shown in Figure-6, the variation of the current produced by the PV panel (Ipv) according to the one transmitted to the accumulator battery (Ich).
Figure-6. Evolution of the module current according to the current of the battery.
Figure-6 shows that the current produced by the PV panel is proportional to that received by the battery according to the linear correlation:
Ich = 0.9861Ipv with R2 = 0.9754 (3)
The regulation efficiency is the ratio of the energy received by the battery to that produced by the solar panel. According to relation (3), it is equal to 98%. This value confirms the good quality of the charge and discharge regulator. Therefore, the maximum daily energy that could be stored in the battery during a sunny day (5 KWh/m2.d) would be equal to 47 Ah.
With regard to the experimental site, the values of the incident solar irradiation are generally less than 5 KWh/m2.d. Indeed, the sunshine data for Abidjan city show that the maximum value of the daily global irradiation is around 4.446 KWh/m2.d between 1978 and 1988 (Fassinou, 1997; DGTX, 1991). However, between 2003 and 2009 (Brou, 2010), this maximum value is 3.303 KWh/m2.d. The sunshine measurements made at the site in 2017 resulted in an average annual global irradiation value of 3.331 KWh/m2.d.
We present in Figure-7, the monthly average daily variations of the global irradiation for these three periods.
Epv= 9.6658Irrad R² = 0.9861 0
5 10 15 20 25 30 35 40 45 50
0 1 2 3 4 5
C
u
m
u
lat
ive
e
n
e
rgy
p
rod
u
ce
d
b
y
P
V
p
an
e
l
(A
h
)
Incident solar irradiation (Kwh/m²)
Figure-7. Daily average irradiation of Abidjan city from 1978 to 1988, from 2003 to 2009 and in 2017.
We note a considerable decrease in daily irradiation in recent years, 2017 (3.331 KWh/m2.d), 2003-2009 (2.733 to 3.772 KWh/m2.d) unlike in previous years 1978-1988 (3.633-4.446 KWh/m2.d), and the lowest values are observed during the months of June, July and August. This can be explained by the high cloudiness due to the presence of greenhouse gases in the atmosphere, which leads to the disruption of the rainy seasons in most tropical regions.
Charge of the battery by PV panel
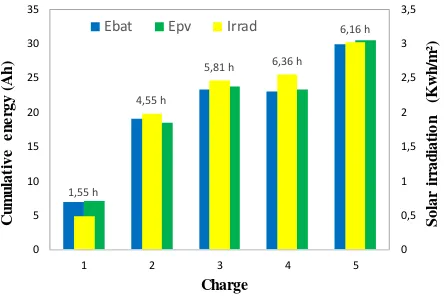
[image:4.595.55.286.91.230.2]We performed load tests in which the energy stored in the battery and the charging duration were measured. The results obtained for this load energy balance are presented in Figure-8.
Figure-8. Charge energy balance.
The balance shows that the energy supplied by the panel and that stored in the battery increase with the daily solar irradiation. Charging duration decreases with the increase of solar energy.
The estimation of the charge duration according to the daily irradiation was carried out by a linear extrapolation from the following approaches:
the linear correlation (2) between the cumulative energy produced by the module (Epv) and the incident solar irradiation (Irrad);
charge regulation efficiency: the battery receives 98% of the energy generated by the PV panel ;
the results of our charging experiments: the charging
duration (δt) increases with the energy accumulated
by the battery (Ebat) for solar irradiations lower than 3 KWh/m2.d and decreases for solar irradiations exceeding 3 KWh/m2.d.
The results are recorded in the Table-2.
Table 2. Variation of the charging duration and the energy received by the battery
according to the daily irradiation.
Irrad Ebat δt
(KWh/m2.d) (Ah) (h)
2.5 22.97 6.36
3 29.96 6.16
3.5 33.15 5.67
4 37.89 4.78
4.5 43.50 3.89
5 48.32 3.01
Table-2 shows that the charging duration decreases with the increase in daily irradiation varying between 2.5 and 5 KWh/m2.d. Under the conditions of the experimental site, we consider that the photovoltaic module of 250 Wp can provide a daily energy equal to 48 Ah to the battery during a good sun exposure (5 KWh/m2.d). Also, an energy of 33 Ah in a period of an average sunshine (3.5 KWh/m2.d). For daily global irradiations between 3.5 and 5 KWh/m2.d, we obtained an average charge duration between 3 h and 6 h.
The knowledge of the power generation and storage capacities of the photovoltaic generator studied, allows us to evaluate the energy autonomy needed to power the compressor unit. This assessment will permit an optimized management between production and consumption.
DISCHARGE OF THE BATTERY IN THE COMPRES-SOR MOTOR
In order to evaluate the autonomy in electric energy of the battery, we connected it to the terminals of the compressor motor which chills a refrigerated enclosure of 150 liters to follow the various energy consumptions according to the thermostatic settings. The compressor motor is equipped of an automatic shutdown system by intermittent during its operation. For each experiment according to the 4 settings, we measure the duration of
discharge (δt’), the energy consumed by the motor (Epv)
and the variation (∆T) of the interior temperature of the
refrigerator.
The thermostatic setting is the thermostat position which allows the setting of the motor running and the 1,55 h
4,55 h
5,81 h 6,36 h
6,16 h
0 0,5 1 1,5 2 2,5 3 3,5
0 5 10 15 20 25 30 35
1 2 3 4 5
S
ol
ar
i
rr
ad
iat
io
n
(
K
w
h
/m
²)
C
u
m
u
lat
ive
e
n
e
rgy
(A
h
)
Charge
[image:4.595.58.282.458.606.2]motor stop temperatures. This causes the compressor unit to run and stop alternately. Thus, for the production of cold inside the refrigerator we have defined four positions of the thermostat which are:
Setting A: motor running (+6˚C) and motor stop (-1˚C)
Setting B: motor running (-1˚C) and motor stop (6˚C)
Setting C: motor running (-2˚C) and motor stop (-12˚C)
Setting D: motor running (-5˚C) and motor stop (-15˚C)
The results obtained are summarized in Table-3.
Table-3. Values of temperature variation, discharge duration and energy consumption for different
thermostatic settings.
Setting Ti Tf ∆T δt’ Emot (˚C) (˚C) (˚C) (h) (Ah) Discharge 1 A 22.30 5.64 16.66 72.30 40.27 Discharge 2 B 21.77 -0.46 22.23 58.70 52.01 Discharge 3 C 21.04 -3.03 24.07 46.58 48.83 Discharge 4 D 21.20 -4 25.20 34.25 41.94
In Table-3, Ti is initial internal temperature of the refrigerator before discharge, Tf the final internal
temperature of the refrigerator after discharge and ∆T internal temperature variation of the refrigerator. ∆T is
equal to Tf –Ti.
We note that the greater the variation of
temperature (∆T) inside the refrigerator, less the autonomy (δt’) in electrical energy of the battery is long. However, when we observe the energy consumption of the motor-compressor (Emot) as function of the variation of temperature inside the refrigerator, we find that the setting A has the lowest energy consumption (40.27 Ah). This low consumption is explained by the fact that this setting produced less cold, which is observed by the small variation of temperature (16.7°C) inside of the refrigerated enclosure.
Then, we observe for the other settings (B, C and D) that the energy consumption of the refrigerator (Emot) decreases with the increase of the variation of temperature
(∆T) inside the refrigerated enclosure. When the cold
production is high, the refrigerator consumes less of electricity energy. This is due to the good thermal insulation of the refrigerating enclosure, built from locally available materials (plywood, polystyrene and polychloride of vinyl), which leads a prolonged stop of the motor-compressor (energy gain). So, we say that the thermostatic adjustment leads to a reduction of the energy consumption of the refrigerator.
The energy that can be drawn from the battery depends on two essential parameters which are: the storage capacity of the battery and the energy behavior of
the load that is powered. Thus, for optimized management of this energy, it is imperative to evaluate the energy parameters of this load.
Table-4 summarizes the consumption of the refrigerator and daily production of the solar panel under the experimental conditions according to the thermostatic settings.
Table-4. Balance of energy production and consumption.
Thermostatic settings A B C D
Daily consumption (Ah/d) 13.37 21.26 25.16 29.39 Daily production (Ah/d)
at 3.5 KWh/m2 33.83 33.83 33.83 33.83 Daily production (Ah/d)
at 5 KWh/m2 48.32 48.32 48.32 48.32 Surplus production (Ah/d)
at 3.5 KWh/m2 20.46 12.57 8.67 4.44 Surplus production (Ah/d)
at 5 KWh/m2 34.95 27.06 23.16 18.93
With regard to the daily energies that can be delivered by the 250 Wp photovoltaic module to the 100 Ah battery, we observe that the energy surplus, which varies between 4.44 and 34.95 Ah. Clearly, these results show the good performance of the photovoltaic generator. Indeed, under the conditions of the site, the solar module is able to fully meet the daily needs of the refrigerator whatever the thermostatic setting. The energy balance between the production of the PV module and the consumption of the motor-compressor shows that the refrigerator can operate regularly throughout the year, even in case of average daily sunshine (3.5 KWh/m2.d). The daily sunshine rate of the city of Abidjan is greater than 3.5 KWh/m2.d (Fassinou, 1997; Monteny et Lhomme, 1981).
The daily consumption presented by the Table 4 was evaluated for 24 h motor compressor operation. Based on this fact, we determined easily the daily consumption of the compressor motor during the daytime period, about 6.5 hours of sunshine on average per day (between 9:00 and 15:30). The result of this estimate shows that the consumption of the motor during the daytime period varies between 3.62 Ah and 7.96 Ah depending on the type of setting. This energy is low compared to the daily output of the solar panel (33.83 Ah or 48.32 Ah). So, the energy overproduction varies between 25.87 Ah and 44.7 Ah for average solar irradiations of 3.5 to 5 KWh/m2.d. The use of the empty refrigerator for these tests explains the low energy consumption of the motor. However, it could increase during experiments with loads inside the refrigerator. Increasing the storage capacity of the battery could recover the excess energy.
60% when sizing, we have a stored residual energy which is about 38% of the battery capacity (38 Ah).
The thermostatic settings significantly reduce the daily energy consumption and allow optimal operation of the refrigerator.
The discharge time (energy autonomy) of the battery varies depending on the setting. We present respectively in Figure 9a and Figure-9b the variation of the discharge time according to the thermostatic setting and the internal temperature variation of the empty refrigerator.
Figure-9. Energy autonomy of the electrochemical storage battery.
We find that the discharge time of the battery decreases from the setting A to the setting D according to the thermostatic setting and the temperature variation (see Figure-9a). The energy autonomy decreases from 72.3 h (setting A) to 34.5 h (setting D) for a temperature reduction of the refrigerator from 17 ˚C to 25 ˚C (see Figure-9b). This autonomy in electrical energy of the battery follows a linear decrease with the temperature of the refrigerator according to the following correlation:
tdisch = - 4.0093∆T + 141.31 with R 2
= 0.83 (tdisch in hour) (4)
∆T is the internal temperature variation of the
refrigerator. ∆T is equal to Tf -Ti.
We can estimate the energy autonomy of the battery by fixing the average internal temperature of the
refrigerator. The maximum discharge time (for ∆T=0˚C) is
141.31 hours, about 6 days. This autonomy decreases as the temperature drops inside the refrigerator. However, this electrical energy autonomy is almost dependent on the state of charge and the quality of the battery.
Optimization of the sizing of the battery capacity In this section, we compare the energy autonomy obtained by the different 100Ah/12V battery discharge tests with that resulting from the theoretical design, for the same operating time of the compressor motor. This approach aims to show the need to evaluate the energy behavior of the load before estimating the capacity of the battery for a specific energy depletion time.
To do this, we consider the actual daily operating time of the refrigerator according to different thermostatic
settings. The experimental evaluation of the running and stopping duration of the compressor motor made it possible to determine the actual daily operating duration and the maximum consumption caused by each of the four thermostatic adjustments (A, B, C and D). This was made possible by analyzing the evolution of the discharge current induced by each of the four settings. The discharge current is the current delivered by the battery during the running of the compressor motor. The Figure-10 shows an illustration for setting D.
Figure-10. Evolution of the discharge current of the battery for the setting D.
Table-5. Operating duration and theoretical daily consumption of the compressor motor.
Setting Running duration
Stopping duration
Theorical energy consumption Eth
(h) (h) (Ah)
A 6.00 18.00 29.50
B 8.00 16.00 39.33
C 9.60 14.44 47.20
D 12.00 12.00 59.00
The daily running duration of the motor varies between 6h and 12 h depending on the type of setting. This allows us to estimate the daily consumption (Eth) of the refrigerator between 30 Ah and 59 Ah. The maximum daily consumption is estimated to 59 Ah for 12 hours of operation without stopping of the compressor motor considering the nominal power of 59 w powered in 12 V.
Hence, for X hours of operation of the compressor motor, the theoretical energy consumption Eth (Ah) is expressed by the following relation (5):
Eth = 59.X12 (5)
This evaluation makes it possible to estimate judiciously the quantity of electricity that can operate the unit 24h/24h in case of meteorological and technical hazards. These theoretical results are compared with the experimental values in Table-6.
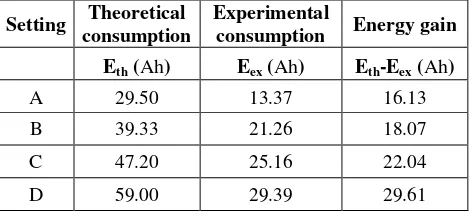
[image:7.595.52.288.528.635.2]Table 6 compares the experimental and theoretical results of the daily energy consumption of the refrigeration unit according to the different thermostat settings.
Table-6. Energy consumption of the refrigerator.
Setting Theoretical consumption
Experimental
consumption Energy gain
Eth (Ah) Eex (Ah) Eth-Eex (Ah)
A 29.50 13.37 16.13
B 39.33 21.26 18.07
C 47.20 25.16 22.04
D 59.00 29.39 29.61
We note that the theoretical consumption, determined from the daily motor running duration and the nominal power given by the manufacturer (59 W), is almost twice that recorded experimentally. This difference in value is due to the prolonged stop of the motor-compressor caused by the good thermal inertia in the refrigerated enclosure. The energy gain recorded by the electrochemical battery increases when we move of the setting A (16.13 Ah) to setting D (29.61 Ah). The energy consumption of the refrigerator is improved (reduction of the consumption), more the cold production is important to
behavior of the load is useful for optimizing the sizing of the storage capacity of the battery.
To do this, we determine the energy autonomy of the battery using two approaches, one theoretical and the other experimental.
In the theoretical approach, we use the relation (6) (Chabot, 1991) which gives the capacity (CA) of the battery according to its energy autonomy (Ns). The energy autonomy (Ns) of the battery is given by relation (7). Ns is the number of storage days and also the autonomy of the battery.
CA= Wd.NSηa .DM (6)
NS=ηa.DM.CAWd (7)
The parameters involved in equation (Equation.7) are defined as below:
CA: Capacity of electrochemical battery (100 Ah) Wd: Daily consumption of the compressor motor (59
Ah/d)
Ns: Number of storage days (d)
DM: Depth of maximum discharge of accumulators (60%)
ηa: Accumulators performance (85%) (Semassou, 2011)
With regard to the experimental approach, we use the results obtained during the electric discharge of the battery through the thermostatic setting of the compressor motor. The experimental autonomy of the battery, tDex, is
the discharge duration (δt’) given in Table-3.
The results of the evaluation of the depletion time (tD) of the accumulator energy for a maximum discharge depth of 60% according to the two predefined approaches have been recorded in Table-7.
tDth is the value of Ns for DM =0.6, CA=100 Ah,
ηa=0.85. The tDth values, presented in Table-7, were calculated from the theorical consumption (Eth) data of the Table 6.
Table-7. Energy depletion duration of accumulators. Setting tDth tDex tDex-tDth
(h) (h) (h)
A 41.37 72.30 30.93
B 31.12 58.70 27.58
C 25.93 46.58 20.65
D 20.74 34.25 13.51
In Table-7, tDth and tDex represent respectively the theoretical and experimental depletion duration after which the battery reaches 60% of discharge depth.
daily consumption of the refrigerator between 29.5 Ah and 59 Ah, is generally the standard theoretical design performed to determine the capacity of the storage battery to install in photovoltaic systems. It does not take into account the different states of the motor, which often causes an oversizing and expensive installation.
The second approach which is totally experimental gives real and satisfactory forecasts in the sense that we get a very important autonomy (tDex) and much more improved than the first by going from 34.25 h to 72.30 h.
This study allowed us to appreciate the gap that exists between the results generated by these two approaches in the process of evaluating the energy autonomy of our device/experimental set up. Indeed, we recorded an increase of the depletion time (energy autonomy) of the electrochemical battery of 100 Ah, which could range from 13.5 to 31 hours which is an optimization rate between 23 and 75%, according to the energy consumption of the compressor motor. This increase shows the need to evaluate the energy behavior of the load before any sizing for optimal management of the energy that can be delivered by the battery in case of non-productivity of the photovoltaic module.
The results obtained by these two approaches show the approximations related to the application of the standard theoretical model for sizing the capacity of the battery to install. We say that the design of the photovoltaic generator must take into account the energy behavior of the load.
CONCLUSIONS
This study made it possible to note the approximations related to the application of the theoretical model of design of the photovoltaic generator by considering that the data of the manufacturer. It is necessary to include in this theoretical design, the experimental data resulting from the evaluation of the energy behavior of the load and the solar energy potential of the installation site of the photovoltaic system. This approach involves a concrete determination of the daily operating time and the energy consumption of the motor-compressor according to the temperature variation inside the refrigerator. The study showed that a 250 Wp photovoltaic generator can provide enough energy to power a 59W-12V compressor motor. The energy that can be stored at global irradiations of 3.5 KWh/m2.d to 5 KWh/m2.d is between 33 Ah and 47 Ah. The daily consumption of the solar refrigerator varies from 13.4 Ah to 29.4 Ah. Discharge tests showed that the 100 Ah battery alone could provide an autonomy in electric energy of 1.5 to 3 days at the refrigerator according to its internal charge, contrary to the standard theoretical design that estimated it between 21 h and 41 h. These results made it possible to reduce the size of the photovoltaic generator by a rate ranging from 23 to 75%.
From a general point of view, we have been able to establish a sizing model based on actual operating conditions in order to optimize the performance of the photovoltaic generator in solar refrigeration systems.
ACKNOWLEDGEMENTS
The authors thank the Strategic Support Program for Scientific Research of Côte d’Ivoire (PASRES) for its support for the acquisition of the material used to carry out this study.
NOMENCLATURE
I: Current supplied by the PV generator (A) V: Voltage across the PV generator (V) Iph: Photocurrent (A)
Ipv: Current produced by the PV module (A) Ich: Current received by the battery (A) PV: Photovoltaic
I0: Saturation current of the diode (A) Rs: Series Resistance (Ω)
Rp: Shunt Resistance (Ω) T: Temperature (K) n: Diode ideality factor
K: Boltzmann constant (1.38 10-23 J/K) q: Elementary charge (1.602 10-19 C)
E: Irradiance measured by the pyranometer (W/m2) Epv: Daily energy generated by PV generator (Ah) Ebat: Energy accumulated by the battery (Ah)
Emot: Energy consumed by the compressor motor (Ah) Eth: Theoretical energy consumption of the
compressor motor (Ah)
Eex: Experimental energy consumption of the compressor motor (Ah)
Irrad: Solar irradiation (KWh/m2)
δt: Experimental charge duration of the battery (h)
δt’: Experimental discharge duration of the battery (h) tdisch: Discharge duration of the battery (h)
∆T: Internal temperature variation of the refrigerator (°C)
Ti: Initial internal temperature of the refrigerator (°C)
Tf: Final internal temperature of the refrigerator (°C) CA: Capacity of the battery (Ah)
NS: Energy autonomy of the battery (j)
Wd: Daily consumption of the compressor motor (Ah/d)
tDth: Theoretical depletion duration of the battery for 60% of discharge depth (h)
tDex: Experimental depletion duration of the battery for 60% of discharge depth (h)
REFERENCES
ADEME. 1998. Etude expérimentale des appareils électroménagers à haute efficacité énergétique placés en situation réelle. Rapport final projet ECODROME.
Alsema E. and Patyk A. 2003. Investigation on storage technologies for intermittent renewable energies: Evaluation and recommended R&D strategy. WP Report
Aziz A. 2006. Propriétés électriques des composants électroniques minéraux et organiques: Conception et modélisation d’une chaîne photovoltaïque pour une meilleure exploitation de l’énergie solaire. Doctorat en Sciences (Electronique). Université Mohamed Premier. n°86/06, Oujda(Maroc). Université Paul Sabatier. N°06234, Toulouse (France).
Azzouz K., Leducq D., Guilpart J. and Gobin D. 2007. Modélisation dynamique d’un système frigorifique domestique couplé à matériau à changement de phase. 13èmes Journées Internationales de Thermique (JITH 2007). Albi (France), 28 au 30 Août 2007.
Belhadj M., Benouaz T., Cheknane A. et Bekkouche S. M. A 2010. Estimation de la puissance maximale produite par un générateur photovoltaïque. Revue des Energies Renouvelables. 13(2): 257-264.
Bhattacharya T., Chakraborty A. K., and Pal K. 2015 Statistical analysis of the performance of solar photovoltaic module with the influence of different meteorological parameters in Tripura (India). International Journal of Engineering Research. 4:137-140.
Brou T. 2010. Etude technico-économique des technologies solaires en Côte d’Ivoire. Master (Génie Electrique Energétique et Energies Renouvelables), Institut International d’Ingénierie de l’Eau et de l’Environnement (2iE). Burkina Faso.
Chabot B. 1991. Les systèmes photovoltaïques: Présentation, conception, caractéristiques et Applications. Mise en valeur des ressources énergétiques en Afrique. Actes d’atelier. Editions CRES, ADEME, IEPF. 18-29. Mali.
Chen W., Shen H., Shu B., Qin H. and Deng T. 2007. Evaluation of performance of MPPT devices in PV systems with storage batteries. Renewable Energy. 32(9):1611-1622.
D.G.T.X. 1991. Plan national de l’énergie: Situation énergétique existante. Les énergies renouvelables », Rapport de la Direction de Contrôle des Grands Travaux. Côte d’Ivoire. II(6):1-9.
Dajuma A. et al. 2016. Sensitivity of solar photovoltaic panel efficiency to weather and dust over West Africa: comparative experimental study between Niamey (Niger) and Abidjan (Côte d’Ivoire). Computational Water, Energy, and Environmental Engineering. 5: 123-147.
Fassinou W. F. 1997. Réfrigérateur solaire photovoltaïque à trois compartiments avec batterie de froid: Etude, réalisation et analyse des irréversibilités. Doctorat 3ème cycle en Sciences (énergie solaire). Université Nationale de Côte d’Ivoire.
Gélis B., Creuze V., Glaise C., Lecat F. et Thomas V. 2013. Travaux pratiques de caractérisation de panneaux photovoltaïques. Colloque sur l’Enseignement des Technologies et des Sciences de l’Information et des Systèmes (CETSIS 2013). Caen (France). Mars.
Jossen A., Garche J. and Sauer D.U. 2004. Operation conditions of batteries in PV applications. Solar Energy. 76(6):759-769.
Karatepe E., Boztepe M. And Colak M. 2006. Neural network based solar-cell model. Energy Conversion and Management. 47(9-10):1159-1178.
Kassmi K., Hamdaoui M. et Olivié F. 2007. Conception et modélisation d’un système photovoltaïque adapté par commande MPPT analogique. Revue des Energies Renouvelables. 10(4):451-462.
Khezzar R., Zereg M. et Khezzar A. 2010. Comparaison entre les différents modèles électriques et détermination des paramètres de la caractéristique I-V d’un module photovoltaïque. Revue des Energies Renouvelables. 13(3): 379-388.
Lepage H. 2012. Modélisation de solides à manocristaux de silicium. Doctorat (Sciences Appliquées). INSA de Lyon. France.
Meah K., Ula S. and Barrett S. 2008. Solar photovoltaic water pumping: Opportunities and challenges. Renewable and Sustainable Energy Review. 12(4):1162-1175.
Monteny B. A. et Lhomme J. P. 1981. Etude du climat radiatif de la région sud-ouest de Côte d’Ivoire (zone Taï). Rapport de l’Office de la Recherche Scientifique et Technique Outre-Mer(ORSTOM). Centre ORSTOM d’Adiopodoumé. Côte d’Ivoire.
Mrabti T., El Ouariachi M., Tidhaf B., El Chadli et Kassmi K. 2010. Conception, simulation et réalisation d’un système photovoltaïque destiné au stockage d’énergie dans les batteries stationnaires (2V). Revue des Energies Renouvelables. 13(1):85-100.
Multon B., Robin G., Erambert E. and Ben Ahmed H. 2004.
Stockage de l’énergie dans les applications stationnaires. Colloque Energie Electrique: besoins, enjeux, technologies et applications. Belfort (France). 64-77.
Semassou C. 2011. Aide à la décision pour le choix de sites et systèmes énergétiques adaptés aux besoins du Benin. Doctorat (Mécanique). Université de Bordeaux 1. France.
Verges J. 1980. Détermination d’un pas optimum d’intégration pour la méthode de Simpson. Mathematics and Computers in Simulation. 3(22):177-188.