www.esri.ie
Working Paper No. 276
January 2009Discounting for Climate Change
David Anthoff
a,b, Richard S.J. Tol
a,c,dand Gary W. Yohe
eAbstract: It is well-known that the discount rate is crucially important for estimating the social cost of carbon, a standard indicator for the seriousness of climate change and desirable level of climate policy. The Ramsey equation for the discount rate has three components: the pure rate of time preference, a measure of relative risk aversion, and the rate of growth of per capita consumption. Much of the attention on the appropriate discount rate for long-term environmental problems has focussed on the role played by the pure rate of time preference in this formulation. We show that the other two elements are numerically just as important in considerations of anthropogenic climate change. The elasticity of the marginal utility with respect to consumption is particularly important because it assumes three roles: consumption smoothing over time, risk aversion, and inequity aversion. Given the large uncertainties about climate change and widely asymmetric impacts, the assumed rates of risk and inequity aversion can be expected to play significant roles. The consumption growth rate plays four roles. It is one of the determinants of the discount rate, and one of the drivers of emissions and hence climate change. We find that the impacts of climate change grow slower than income, so that the effective discount rate is higher than the real discount rate. The differential growth rate between rich and poor countries determines the time evolution of the size of the equity weights. As there are a number of crucial but uncertain parameters, it is no surprise that one can obtain almost any estimate of the social cost of carbon. We even show that, for a low pure rate of time preference, the estimate of the social cost of carbon is indeed arbitrary – as one can exclude neither large positive nor large negative impacts in the very long run. However, if we probabilistically constrain the parameters to values that are implied by observed behaviour, we find that the social cost of carbon, corrected for uncertainty and inequity, is 61 US dollar per metric tonne of carbon.
Corresponding Author: [email protected]
Key words:Social cost of carbon; climate change; pure time preference; risk aversion; inequity aversion; income elasticity; time horizon; uncertainty
JEL Classification:Q54
a Economic and Social Research Institute, Dublin, Ireland
b International Max Planck Research School on Earth System Modelling, Hamburg, Germany c Institute for Environmental Studies, Vrije Universiteit, Amsterdam, The Netherlands d Department of Spatial Economics, Vrije Universiteit, Amsterdam, The Netherlands e Department of Economics, Wesleyan University, Middletown, CT, USA
Discounting for Climate Change
1. Introduction
The social cost of carbon (SCC), the discounted value of damage associated with climate change impacts that would be avoided by a marginal reduction in carbon emissions along an arbitrary trajectory, is a useful measure for assessing the benefits of climate policy. It would, of course, equal the Pigouvian carbon tax if it were evaluated along an optimal emission trajectory, but that is just one possibility. Since SCC has been used by many to quantify, in one admittedly aggregated number, the significance of climate change as a public policy issue, a large number of estimates of the SCC have been offered in the literature. All of these estimates depend on many assumptions about future emissions, climate sensitivity (warming associated with increases in greenhouse gas concentrations) and the seriousness of impacts over time. Since the accumulation of greenhouse gases in the atmosphere is a stock problem at a century time-scale, though, it has long been known that the discount rate is one of the most critical factors in determining the relative magnitude of any particular estimate of the SCC.
We were reminded of the importance of the discount rate in the climate change arena by many of the discussions that were spawned by the Stern Review (Stern, Nicholas H. et al. 2006;Stern 2008;Stern & Taylor 2007). The Review itself reported a SCC in excess of $300/tC in the absence of any climate policy for its lowest damage scenarios – an estimate that landed well above the range found in the previous literature (Tol 2005b). Many analysts attributed this to the very low rate of pure time preference adopted by the Stern author team (Arrow 2007;Jensen & Webster 2007;Mendelsohn 2008;Nordhaus 2007;Weyant 2008). Others argued that the Stern Review also included unusual assumptions about the curvature of the utility function (Dasgupta 2007;Weitzman 2007); these authors noted that this curvature affects the consumption discount rate as well as the aggregation between countries1 and alternative realizations of an uncertain future. Still other commentators suggested that one should consider effective discount rates, correcting for the expected changes in the valuation of impacts (Sterner & Persson 2008); here, the effective discount rate is a function of the pure rate of time
preference, the growth rate of consumption, the rate of risk aversion, and the income elasticity of the
value of climate change impacts.
In this paper, we systematically explore the relative importance of these various factors. To our knowledge, no single study has looked at all three aspects and their various interactions. In a previous paper (Anthoff et al. 2008), we only considered the pure rate of time preference and the income elasticity of marginal utility. We here use a slightly updated version of the model, and add scenario uncertainty to the Monte Carlo analysis. We also extended the time horizon of the analysis, which affects some of the results in an intriguing way. Finally, we add an investigation of effective discount rates in this paper. The paper proceeds as follows. Section 2 sets out the conceptual and theoretical preliminaries. Most of this material is standard, but we include it here for reasons of clarity and to suggest why it is important to look at all three aspects together; there are, in particular, no a priori reasons by which we can even predict the sign of changes driven by anything but time preference. Section 3 presents the model that we use for the numerical analyses that produced ranges of estimates for the social cost of carbon. Instead of following the lead of the Stern Review and imposing our own normative values on the selection of values for risk aversion and time preference, we look at the behaviours of democratically elected governments to infer distributions of these critical factors of Ramsey discounting that are actually used in practice. We use the resulting probability densities to constrain the estimates of the SCC and compute its expected values. Section 4 discusses the results, and Section 5 offers some concluding remarks.
2. Preliminaries
Climate change is a long-term problem. This is why the pure rate of time preference is so important. Greenhouse gas emission reduction over the near-term would mitigate future damages, but they would do little to alter the present climate and/or the present rate of change in climate impacts. The costs of emission abatement must therefore be justified by the benefits of avoided impacts in the future. People discount future consumption for two reasons (Ramsey 1928). Firstly, they expect to become richer in the future, and so they care less about an additional dollar then than they do about an additional dollar today. Secondly, they are impatient. This leads to the Ramsey rule:
r= +ρ ηg
where r is the discount rate, ρ is the rate of pure time preference, g is the growth rate of per capita consumption, and η is the elasticity of marginal utility of consumption. It is clear that both ρ and η are important in specifying an optimal consumption discount rate.
Climate change is not just a long-term problem. It is a problem that is confounded by significant sources of uncertainty; and it is a problem where the impacts differentially affect people with widely different incomes. The rate of pure time preference ρ speaks only to the first characteristic of the climate policy problem – the time scale issue. The elasticity of marginal utility with respect to consumption, the parameter η, speaks to all three characteristics. First of all, it indicates the degree to which an additional dollar brings less joy as income increases. Moreover, the parameter η can also be interpreted as a measure of how one evaluates a gain of a dollar for rich person relative to a gain of a dollar for a poor person. This is why η is occasionally referred to as the parameter of inequity aversion. In its simplest form (Azar & Sterner 1996;Fankhauser et al. 1997), equity-weighted impacts are based on the following equation
(2) w
w c
c c
y
D D
y
η
⎛ ⎞
= ⎜ ⎟
⎝ ⎠
∑
where Dw is the globally aggregate impact, Dc is the monetary impact of climate change in country c,
yw is globally average per capita income, and yc is per capita income in country c. If η = 0, the global
impact is the unweighted sum of national impacts but if η > 0, the impact of climate change on poor countries (relative to the world average) receive a greater weight than impacts on rich countries. Furthermore, the elasticity of marginal utility can be viewed as a reflection of relative risk aversion. In this role, η explains why risk-averse people buy insurance; they are willing to pay a premium that is proportional in first order approximation to the parameter η to eliminate variability in outcomes because doing so increases their expected utility.
(2)
(
)
(
)
(
)
(
)
(
)
(
)
(
)
(
)
0 0 0
0 0 0
(1 ) (1 ) (1 )
1 1 1 1
(1 ) (1 ) '
1 1 1 ( ) 1 (
t t t
t t t t
t t t t
t t t t
t t
t t t
t t t
t t t t
D d y P d y g d g y g
D P P
r r r r
d g y d g y d y D
P P P
r g g
ε
ε ε
ρ η ρ η ε ρ η ε
+ + + = = ≈ ≈ = + + + + + = + ≈ = + + + + + − + +
∑
∑
∑
∑
∑
∑
∑
∑
) t t g −where y is per capita income, P is population (conveniently held constant), and ε is the income elasticity of impacts; d is relative impact, and D is the actual absolute impact and D’ is the absolute impact with constant vulnerability; as above, r is the discount rate, ρ is the rate of pure time preference,
g is the growth rate of per capita consumption, and η is the elasticity of marginal utility of consumption. It is clear that the effective discount rate r’=ρ+(η-ε)g is smaller than the ordinary discount rate r for any ε>0. Equation (2) also shows that the net present value of a series of escalating
impacts equals the net present value of a series of constant impacts evaluated at a lower discount rate.2 Couched in these terms, it is apparent that the rate of escalation of impacts is as important as the rate of pure time preference and the rate of risk aversion. Indeed, in Equation (2), if the income elasticity is greater than the rate of risk aversion, the effective discount rate may be negative – in which case the net present value can be unbounded.
In sum, then, we expected that the SCC would react as follows to changes in three critical parameters that influence the appropriate discount rate. The higher the pure rate of time preference, ρ, the less one cares about the future. Damages from climate change, as they occur over time, are therefore less of problem and the SCC should fall. Similarly, the higher risk aversion, η, the higher the discount rate in a scenario of growing per capita income and so the SCC should again fall. However, higher aversion to risk means that one is more concerned about uncertainty and particularly concerned about negative surprises; as a result, the SCC should rise with higher values of η. Furthermore, the higher aversion to risk also corresponds to greater concern about income distribution; if one assumes that climate change disproportionally affects the poor, then the SCC should again rise. The role of income elasticities in determining effective discount rates is even more complicated since the direction of influence depends on the relative size of η. So while we can predict, on first principles, that the effect of changes in time preference ρ, the effects of risk aversion η and income elasticities are ambiguous.
3. The model
Armed with these insights, we use the integrated assessment model FUND to test the hypothesis that η and/or income elasticities could actually turn out to be more important in determining the SCC than ρ. In many ways, FUND is a standard integrated assessment model (Guo et al. 2006;Tol 1997;Tol 1999;Tol 2006). It has simple representations of the demography, economy, energy, emissions, and emission reduction policies for 16 regions. It has simple representations of the cycles of greenhouse gases, radiative forcing, climate, and sea level rise. In other ways, though, FUND is unique. It is alone in the detail of its representation of the impacts of climate change. Impacts on agriculture, forestry, water use, energy use, the coastal zone, hurricanes, ecosystems, and health are all modelled separately – both in “physical” units and their monetary value (Tol 2002a;Tol 2002b). Moreover, FUND allows vulnerability to climate change impacts to be an explicit function of the level and rate of regional development (Tol 2005a;Tol et al. 2007).
This paper uses version 3.4 of the Climate Framework for Uncertainty, Negotiation and
Distribution (FUND). Version 3.4 of FUND corresponds to version 1.6 (Tol et al. 1999;Tol 2001;Tol
2002c) except for the impact module described in (Link & Tol 2004;Tol 2002a;Tol 2002b). A full list of papers, the source code, and the technical documentation for the model can be found on line at http://www.fund-model.org/. The model distinguishes 16 major regions of the world, viz. the United States of America, Canada, Western Europe, Japan and South Korea, Australia and New Zealand, Central and Eastern Europe, the former Soviet Union, the Middle East, Central America, South America, South Asia, Southeast Asia, China, North Africa, Sub-Saharan Africa, and Small Island States. The model runs from 1950 to 3000 in time steps of one year. The prime reason for starting in 1950 is to initialize the climate change impact module. In FUND, the impacts of climate change are assumed to depend on the impact of the previous year, this way reflecting the process of adjustment to climate change. Because the initial values to be used for the year 1950 cannot be approximated very well, both physical and monetized impacts of climate change tend to be misrepresented in the first few decades of the model runs.3 The centuries after the 21st are included to assess the long-term implications of climate change. Previous versions of the model stopped at 2300.
The scenarios are defined by the rates of population growth, economic growth, autonomous energy efficiency improvements as well as the rate of decarbonization of the energy use (autonomous carbon efficiency improvements), and emissions of carbon dioxide from land use change, methane and nitrous oxide. The scenarios of economic and population growth are perturbed by the impact of climatic change. Population decreases with increasing climate change related deaths that result from changes in heat stress, cold stress, malaria, and storms. Heat and cold stress are assumed to have an effect only on the elderly, non-reproductive population. In contrast, the other sources of mortality also affect the number of births. Heat stress only affects the urban population. The share of the urban population among the total population is based on the World Resources Databases (http://earthtrends.wri.org). It is extrapolated based on the statistical relationship between urbanization and per-capita income, which are estimated from a cross-section of countries in 1995. Climate-induced migration between the regions of the world also causes the population sizes to change. Immigrants are assumed to assimilate immediately and completely with the respective host population.
The endogenous parts of FUND consist of the atmospheric concentrations of carbon dioxide, methane, nitrous oxide and sulphur hexafluoride, the global mean temperature, the impact of carbon dioxide emission reductions on the economy and on emissions, and the impact of the damages to the economy and the population caused by climate change. Methane and nitrous oxide are taken up in the atmosphere, and then geometrically depleted. The atmospheric concentration of carbon dioxide, measured in parts per million by volume, is represented by the five-box model (Hammitt et al. 1992;Maier-Reimer & Hasselmann 1987). The model also contains sulphur emissions (Tol 2006).
The climate impact module (Tol 2002a;Tol 2002b) includes the following categories: agriculture, forestry, sea level rise, cardiovascular and respiratory disorders related to cold and heat stress, malaria, dengue fever, schistosomiasis, diarrhoea, energy consumption, water resources, unmanaged ecosystems, and tropical and extra tropical storms. The last two are new additions(Narita et al. 2008;Narita et al. 2009). Climate change related damages can be attributed to either the rate of change (benchmarked at 0.04°C/yr) or the level of change (benchmarked at 1.0°C). Damages from the rate of temperature change slowly fade, reflecting adaptation(Tol 2002b).
People can die prematurely due to climate change, or they can migrate because of sea level rise. Like all impacts of climate change, these effects are monetized. The value of a statistical life is set to be 200 times the annual per capita income. The resulting value of a statistical life lies in the middle of the observed range of values in the literature (Cline 1992). The value of emigration is set to be 3 times the per capita income (Tol 1995), the value of immigration is 40 per cent of the per capita income in the host region (Cline 1992). Losses of dryland and wetlands due to sea level rise are modeled explicitly. The monetary value of a loss of one square kilometre of dryland was on average $4 million in OECD countries in 1990 (Fankhauser 1994). Dryland value is assumed to be proportional to GDP per square kilometre. Wetland losses are valued at $2 million per square kilometre on average in the OECD in 1990 (Fankhauser 1994). The wetland value is assumed to have logistic relation to per capita income. Coastal protection is based on cost-benefit analysis, including the value of additional wetland lost due to the construction of dikes and subsequent coastal squeeze.
The impacts of climate change on coastal zones, forestry, tropical and extratropical storm damage, unmanaged ecosystems, water resources, diarrhoea malaria, dengue fever, and schistosomiasis are modelled as simple power functions. Impacts are either negative or positive, and they do not change sign (Tol 2002b).
Vulnerability to climate change changes with population growth, economic growth, and technological progress. Some systems are expected to become more vulnerable, such as water resources (with population growth), heat-related disorders (with urbanization), and ecosystems and health (with higher per capita incomes). Other systems are projected to become less vulnerable, such as energy consumption (with technological progress), agriculture (with economic growth) and vector- and water-borne diseases (with improved health care) (Tol 2002b). The income elasticities (Tol 2002b) are estimated from cross-sectional data or taken from the literature.
We estimated the SCC cost of carbon by computing the total, monetised impact of climate change along a business as usual path and along a path with slightly higher emissions between 2005 and 2014.4 Differences in impacts were calculated, discounted back to the current year, and normalised by the difference in emissions.5 The SCC is thereby expressed in dollars per tonne of carbon at a point in time – the standard measure of how much future damage would be avoided if today’s emissions were reduced by one tonne.6 That is,
(S3) 1 1 , , 3000 2014 1950 1950 2005 2005 , 2005 1 t t
t r s s t r s
s s
r t t
t t
s r s
I E I E
SCC g δ δ ρ η − − = = = = = ⎛ ⎞ ⎛ ⎞ + − ⎜ ⎟ ⎜ ⎟ ⎝ ⎠ ⎝ ⎠ = + +
∑
∑
∑
∑
∏
where• SCCr is the regional social cost of carbon (in US dollar per tonne of carbon); • r denotes region;
• t and s denote time (in years);
• I are monetised impacts (in US dollar per year);
• E are emissions (in metric tonnes of carbon);
4 The social cost of carbon of emissions in future or past periods is beyond the scope of this paper.
5 We abstained from levelizing the incremental impacts within the period 2005-14 because the numerical effect of this correction is minimal while it is hard to explain.
• δ are additional emissions (in metric tonnes of carbon);
• ρ is the pure rate of time preference (in fraction per year);
• η is the elasticity of marginal utility with respect to consumption; and
• g is the growth rate of per capita consumption (in fraction per year). We first compute the SCC per region, and then aggregate, as follows
(S4) 16 Y
ε
⎛ 2005, ⎞
1 2005,
world
r
r r
SCC SCC
Y =
= ⎜⎜ ⎟⎟
⎝ ⎠
∑
where
• SCC is the global social cost of carbon (in US dollar per tonne of carbon);
• SCCris the regional social cost of carbon (in US dollar per tonne of carbon); • r denotes region;
• Yworld is the global average per capita consumption (in US dollar per person per year); • Yr is the regional average per capita consumption (in US dollar per person per year); and • ε is the rate of inequity aversion; ε=0 in the case without equity weighing; ε=η in the case with
equity weighing.
In the case of uncertainty, we compute the expected value of the SCC, as follows:
(S5)
1
1
E( ) MC ( )i
i
SCC SCC
MC = θ
=
∑
where
• E(SCC) is the expected value of the social cost of carbon (in US dollar per tonne of carbon);
• i indexes the Monte Carlo run;
• MC is the number of Monte Carlo runs; MC = 1000; and
• θ is the vector of uncertain input parameters, fully specified on http://www.fundmodel.org/
4. Results
analyse scenario sensitivity before discussing a probability-weighted combination of all of the above to arrive at some summary estimates.
All results are expressed in US dollars at 1995 price levels.
4.1. Time preference and risk aversion
We estimated the SCC for a range of values for ρ and η, but we report our results in stages to highlight the triple role of η. We first considered results for cases in which η affects only the discount rate. That is, we pretended that uncertainty about climate change had been resolved and that income differences between countries were irrelevant. The second set of results put uncertainty back into the problem; the reported expected values of the SCC are the product of a Monte Carlo analysis of all the uncertain parameters in the FUND model. A third batch of results were drawn from the original world of perfect climate certainty, but social cost estimates applied equity weighting to the regional impacts of climate change. Finally, we report expected social cost estimates for cases in which both uncertainty and equity-weighing played a role – the cases where η plays its theoretically appropriate triple role.7
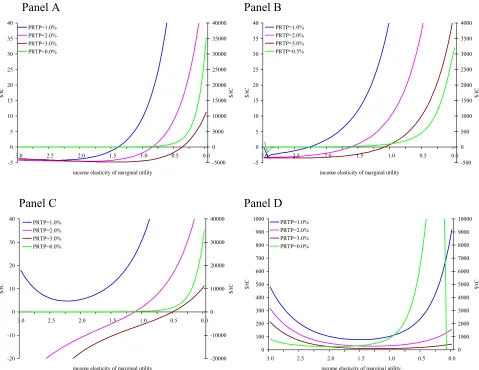
Figure 1 shows the SCC cost of carbon for the four cases, varying η for a given ρ (bivariate plots are not particularly insightful). If we ignore concerns about equity and uncertainty (Panel A), the SCC roughly decreases as expected with the discount rate. For ρ = η = 0, SCC = $34,937.5/tC (the highest SCC); it falls to SCC = $10.3/tC for ρ = η= 1 and to SCC = -$4.6/tC for ρ = η= 2. The sign turns negative because climate change is initially beneficial to the world economy. For ρ = η = 3, however, SCC climbs back to -$3.7/tC because the discount rate is so high that it even discounts initial benefits significantly. Indeed, the graphs show that while the SCC tends to increase with higher ρand
η, this pattern first flattens and then reverses for high discount rates.
The profiles change when uncertainty is taken into account (cf. Panel B). By and large, the SCC increases with both ρandη; and the mean SCC tends to be greater than the best guess SCC. For ρ
= η= 1, E(SCC) = $43.9/tC, more than four times higher than the best guess; for ρ = η= 2, -$1.9/tC is less than half the best guess.8 However, the pattern reverses when η approaches 3, and this trend is
7 Note that we assume that the scenarios of population, economy, energy and emissions are independent of ρ and η. Implicitly, we thus assume that changes in ρ and η are exactly offset by changes in the scenario of technological change. 8 For reference, Lord Stern of Brentford chose ρ = 0.1%,η= 1 and estimates E(SCC) = $314/tC. Here, E(SCC) = $673/tC while Anthoff et al. (2008) have E(SCC) = $333/tC. The Stern Review used the PAGE(Hope 2008) model – which
particularly pronounced for low values of ρ. For higher rates of risk aversion, the mean SCC is increasingly dominated by a few Monte Carlo runs with either large positive or large negative impacts even though the Monte Carlo sample starts to diverge only in the medium run. When ρ < 0.5, our estimates of E(SCC) become unreliable. There is no clear relationship with either ρorη, although the numbers tend to be large, either negative or positive. The reason is that the uncertainty about the far future is very large indeed, and that this uncertainty is not discounted. In the Monte Carlo sample, there are runs with large and rich populations with positive impacts that are small relative to the economy but large relative to the rest of the Monte Carlo sample. There are also runs with large negative impacts nearly everywhere. Depending on the parameter choice, either of the two extremes can dominate the mean. The result cannot be interpreted, and the estimates are unreliable in the sense that they vary strongly with small parameter changes.
The results are different again with equity weighing and no uncertainty (cf. Panel C). For ρ = η
= 0, SCC = $43,937.5/tC; since η = 0 implies equal weights, this is the global maximum. A local maximum appears at SCC = $108.7/tC when ρ = 0 and η= 3. A global minimum is observed when ρ
= η = 3 and SCC = -$55.2/tC. This minimum emerges because CO2 fertilization brings short-term benefits even to poor countries that will be hurt by climate change in the longer term. For these parameters, long-term losses are heavily discounted and short-term benefits in developing countries are emphasized. See (Anthoff, Tol, & Yohe 2008) for more discussion on CO2 fertilization.
The results change once more when equity weighting is added to the uncertainty (cf. Panel D). Panel B shows peculiar behaviour for high values of η. This disappears in Panel D, indicating that the numerical instabilities in the Monte Carlo analysis are due to high positive or negative impacts in rich countries which are discounted here by equity weighting. With equity weighting, the results are also more stable for low values of ρ – although for very low values of both ρ and η the SCC cannot be estimated reliably. Note that the E(SCC) is strictly positive for this, the theoretically correct scenario.
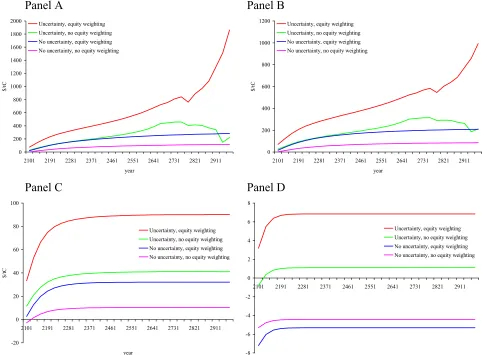
4.2. Time horizon
Figure 2 shows the social cost of carbon as a function of the time horizon. In the bottom left panel, both the pure rate of time preference and the rate of risk aversion are set to unity. The estimate of the social cost of carbon converges in a few centuries. For ρ = 3% (bottom right panel), convergence is faster for obvious reasons, but note that the SCC is still converging after 100 years. Convergence is faster without equity weights and without uncertainty.
The top left panel of Figure 2 shows the results for ρ = 0%. Without uncertainty, the pattern is smooth but the SCC continues to increase throughout the time horizon. Even though the scenario assumes that greenhouse gas emissions fall to zero and climate change comes to an eventual halt, temperatures do not return to pre-industrial levels. Indeed, some 13% of the incremental carbon dioxide used to compute the marginal damage costs stays in the atmosphere forever and impacts remain.9 For ρ = 0%, one therefore needs an infinite horizon and the SCC would be infinite (either positive or negative).
With uncertainty, the pattern is different but not unexpected given the discussion of Figure 1. With uncertainty but without equity weighting, E(SCC) first increases as the time horizon is further away, but then it starts to fall. This is because in a handful of scenarios, positive impacts on rich economies dominate the mean. Equity weighting discounts such positive impacts, and E(SCC) continues to rise. In both cases, E(SCC) becomes more erratic as the time horizon expands. This is because the uncertainty about the remote future is so large that extremely high and low impacts increasingly drive the mean estimate. This is more pronounced for higher values of the rate of risk aversion (results not shown). The top right panel of Figure 2 shows the same pattern, albeit subdued, for a pure rate of time preference of 0.1%.
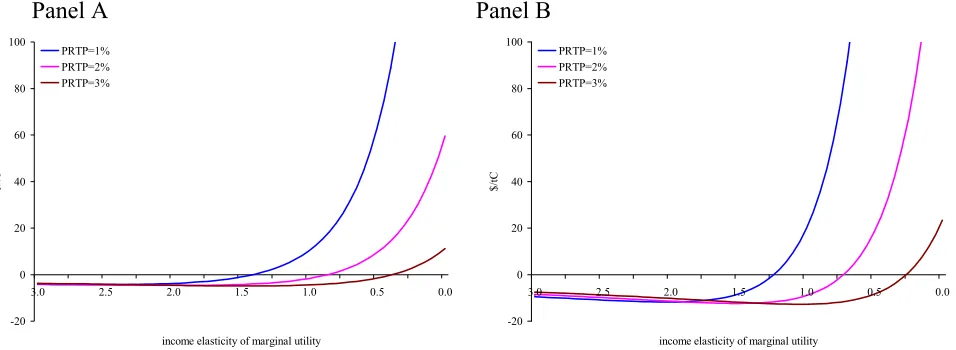
4.3. Income elasticities
In the third set of experiments, we set all the impact elasticities in the impact module of FUND equal to zero. That is, we kept the pattern of vulnerability to climate change constant at the level of the calibration year (1995). Figure 3 shows the results without equity weighting and without uncertainty. One of the basic results of the climate change impact literature is that poor countries tend to be more
vulnerable to climate change, and the results in Figure 3 certainly reflect this. With zero income elasticities, the SCC tend to be higher – at least, if the discount rate is low. If the discount rate is high, the SCC is negative (that is, climate change is a net benefit); and with zero income elasticities, the SCC is even more negative (that is, climate change is an even greater benefit). The reason can be found in the positive impacts of carbon dioxide fertilization on agriculture in poor countries. With the original income elasticity of -0.31, these benefits grow smaller as agriculture become less important; but with a zero income elasticity, these benefits remain.
Next, we compute the overall income elasticity of impacts in Equation (2). This required that we find a value for ε that would set the SCC with original income elasticities equal to the SCC with zero income elasticities for a given ρ; i.e., we needed to compute ε such that
(4) ε η η= −' |SCC( , , )ρ η ξ =SCC( , ',0)ρ η
where ξ is the vector of income elasticities of impacts by sector. Note that we restrict 0 ≤η≤ 3 so that we interpolate but we do not extrapolate. Figure 4 shows the results of this calculation. They vary with the rate of risk aversion and with the rate of pure time preference. Unlike Equation (2), FUND
does not assume a constant growth rate in all regions and all periods. Furthermore, FUND has different income elasticities for different impacts. The qualitative pattern is as one would expect from Figure 3. Since poor countries are more vulnerable to climate change than rich countries, their income elasticities are negative. The lowest value in Figure 4 is ε = -0.38. The income elasticity increases with a higher discount rate, and it becomes positive for a small fraction of parameter combinations. The highest value is ε= 2.55.
4.4. Scenario uncertainty
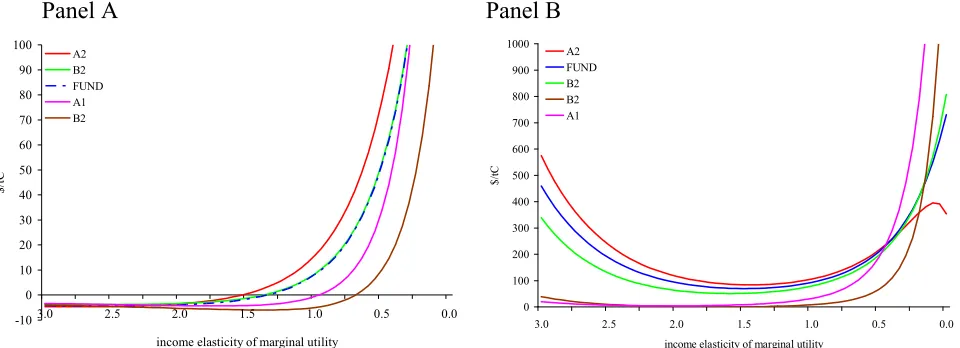
Figure 5 shows the estimated SCC for each of the five scenarios as a function of the rate of risk aversion and a pure rate of time preference of one per cent per year. The left panel depicts the case without uncertainty and without equity weighting. The pattern is the same for all five scenarios. The right panel shows the case with uncertainty and equity weighting. The A1 and B2 do not show the high E(SCC) for high values of η. This is because these scenarios have a more egalitarian distribution of income, so that the effect equity weighting is less pronounced, and a slower rate of warming, so the uncertainty about impacts grows not as fast as in other scenarios. The results of the A2 scenario deviate from the other scenarios for a low value of η. The A2 scenario has the largest income gaps of all scenarios; as equity weights are unity for η= 0, the large positive impacts on rich countries in a few Monte Carlo runs dominate the results.
4.5. Probability weighted results
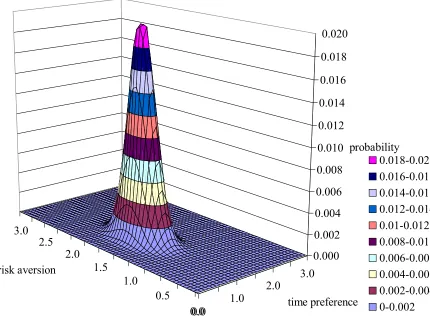
Finally, w used two different sources to inform our representations of combinations ρand η that reflect actual practice across decision-makers. Firstly, (Evans & Sezer 2004;Evans & Sezer 2005) estimate η= 1.49, with a standard deviation of 0.19 for 22 rich and democratic countries from income redistribution data, using the method of (Stern 1977). They also independently estimate ρ = 1.08 ± 0.20 %/year using data on mortality rates. Assuming normality, these results support a bivariate probability density function on ρ and η. Secondly, we used data on nominal per capita consumption growth rates, inflation rates, and nominal interest rates for 27 OECD countries from 1970 to 2006 to produce a joint distribution for η and ρ from observed behaviour. More specifically, we interpreted observations of the real interest rate (r in equation (1) and the difference between the nominal rate and the rate of inflation) and the growth rate g as drawings from a bivariate normal distribution. The Ramsey equation implies that realizations for r and g together support a linear combination for ρand η.
As a result, the bivariate distribution for r and g implies a degenerate bivariate distribution for ρand η.
We used the bivariate probability density function to compute the expected SCC, treating ρand
η as uncertain input variables. We used the results of all five scenarios described above giving each a probability of 0.2. Table 1 shows the results. Without uncertainty and without equity weighting, the SCC is negative. In this case, the Pigou tax would actually be a subsidy. However, given that the standard deviation is larger than the mean, one should not place too much weight on this finding. The expected SCC increases if either uncertainty or equity weighing is added. Uncertainty clearly is the more important factor; in either case, the standard deviation is large compared to the mean. If both uncertainty and equity weighting are included, E(SCC) = $44/tC, with a standard deviation of $12/tC; note that the standard deviation is still relatively large compared to the mean.
5. Discussion and conclusion
We used FUND, an integrated assessment model, to explore systematically the social cost of carbon and how it varies with the pure rate of time preference, the income elasticity of marginal utility (in its triple role of consumption growth discount rate, risk aversion, and inequity aversion), the time horizon used in the analysis, the income elasticity of climate change impacts, and emission scenarios. On the one hand, the results are sobering. Depending on the assumptions, one can get high or low estimates of the social cost of carbon – and one can even get large negative values. That is, one can choose a set of parameters, based on “ethical” or other considerations, to defend any position on climate policy. This is no surprise. Climate change is a long term problem, surrounded by large uncertainties with strong distributional consequences. Climate change is thus a moral problem, and different people would reasonably take a different position on the urgency of climate policy. On the other hand, extreme values of the social cost of carbon are associated with positions that are at odds with revealed preferences on time preference and risk aversion. For middle of the road choices of the most sensitive parameters, the range of social cost of carbon estimates is much more limited.
Besides these broad insights, a number of specific results emerge as well. First, with a very low discount rate, the social cost of carbon is arbitrary. We know this because the estimate does not converge as the time horizon expands. It follows that assumptions about the remote future dominate the results; and since these assumptions are so uncertain, they are essentially arbitrary.
Third, the expected social cost of carbon is estimated to be $44/tC in 1995 dollars, which equals $61/tC in 2008 prices (using US CPI data). The price of carbon dioxide emission permits in the European Union was $78/tC in January 2009.10 The United States has only one federal law that puts a price on carbon. It was buried in the first stimulus package passed at the end of 2008 (Division B of H.R. 1424: The Energy Improvement and Extension Act of 2008) – offering a credit of $20 for every short ton of CO2 ($80/tC) sequestered in a geologically secure locations with the United States. The bill also offers half that value for using CO2 to enhance the productivity of domestic oil and gas wells. Meanwhile, the first two auctions of carbon permits in the Northeast States program that covers major electricity providers cleared at around $3.75 per short ton of CO2 ($15/tC). So while federal policy has yet to be directed at reducing carbon emissions (as of January 19, 2008), the official price of carbon is not zero. Perhaps as a result, many utilities apparently factor in a carbon tax of $15/tC in their investment decisions (Richels, personal communication). Was the price of carbon too high in the European Union as the Obama administration came to power, or was it too low in the United States? That remains to be seen. What is clear is that developing countries do not have climate policies; of course these countries are most vulnerable to climate change, but they have done the least to cause the problem.
The above results come with all the usual caveats. Our knowledge of climate change impacts is incomplete, and may be biased downwards. The analysis presented here is based on a single model. This calls for further research, and replication of the current paper by other researchers. The income elasticity of marginal utility plays a triple role in our analysis. Consumption over time, risk aversion, and inequity aversion are conceptually different, but numerically the same in our set-up. One may argue that inequity aversion is different within and between countries. This calls for a richer specification of utility and welfare functions, but we have yet managed to find a workable alternative. Future research should also have a closer look at the probability density function of the social cost of carbon, and particularly at the behaviour of its tails.
Researchers will work for some time to come to improve our understanding of the social cost of carbon and explore its appropriate use both in framing climate policy and supporting evaluations of other policies whose benefits of costs might include changes in carbon emissions. It is important to
emphasize, however, that the evidence presented here and elsewhere in these efforts suggests that, to the best of our current knowledge, climate change is a real problem and that policy makers around the world should act quickly to put a positive price on greenhouse gas emissions that will grow over time.
Acknowledgements: Funding by the European Commission under the Climate Cost project, by
Panel A Panel B -5 0 5 10 15 20 25 30 35 40
3.0 2.5 2.0 1.5 1.0 0.5 0.0
income elasticity of marginal utility
$/tC -5000 0 5000 10000 15000 20000 25000 30000 35000 40000 $/tC PRTP=1.0% PRTP=2.0% PRTP=3.0% PRTP=0.0% -5 0 5 10 15 20 25 30 35 40
3.0 2.5 2.0 1.5 1.0 0.5 0.0
income elasticity of marginal utility
$/tC -500 0 500 1000 1500 2000 2500 3000 3500 4000 $/tC PRTP=1.0% PRTP=2.0% PRTP=3.0% PRTP=0.5%
Panel C Panel D
-20 -10 0 10 20 30 40
3.0 2.5 2.0 1.5 1.0 0.5 0.0
income elasticity of marginal utility
$/tC -20000 -10000 0 10000 20000 30000 40000 $/tC PRTP=1.0% PRTP=2.0% PRTP=3.0% PRTP=0.0% 0 100 200 300 400 500 600 700 800 900 1000
3.0 2.5 2.0 1.5 1.0 0.5 0.0
income elasticity of marginal utility
[image:19.612.65.544.72.442.2]$/tC 0 1000 2000 3000 4000 5000 6000 7000 8000 9000 10000 $/tC PRTP=1.0% PRTP=2.0% PRTP=3.0% PRTP=0.0%
Figure 1. The marginal damage cost of carbon emissions as a function of the rate of risk aversion for selected rates of time preference.
Panel A Panel B 0 200 400 600 800 1000 1200 1400 1600 1800 2000
2101 2191 2281 2371 2461 2551 2641 2731 2821 2911
year
$/tC
Uncertainty, equity weighting Uncertainty, no equity weighting No uncertainty, equity weighting No uncertainty, no equity weighting
0 200 400 600 800 1000 1200
2101 2191 2281 2371 2461 2551 2641 2731 2821 2911
year
$/tC
Uncertainty, equity weighting Uncertainty, no equity weighting No uncertainty, equity weighting No uncertainty, no equity weighting
Panel C Panel D
-20 0 20 40 60 80 100
2101 2191 2281 2371 2461 2551 2641 2731 2821 2911
year
$/
tC
Uncertainty, equity weighting Uncertainty, no equity weighting No uncertainty, equity weighting No uncertainty, no equity weighting
-8 -6 -4 -2 0 2 4 6 8
2101 2191 2281 2371 2461 2551 2641 2731 2821 2911
[image:20.612.62.544.74.429.2]Uncertainty, equity weighting Uncertainty, no equity weighting No uncertainty, equity weighting No uncertainty, no equity weighting
Figure 2. The marginal damage cost of carbon emissions as a function of the time horizon with and without uncertainty and with and without equity weighting.
Panel A Panel B
-20 0 20 40 60 80 100
3.0 2.5 2.0 1.5 1.0 0.5 0.0
income elasticity of marginal utility
$/tC
PRTP=1% PRTP=2% PRTP=3%
-20 0 20 40 60 80 100
3.0 2.5 2.0 1.5 1.0 0.5 0.0
income elasticity of marginal utility
$/tC
[image:21.612.71.549.74.249.2]PRTP=1% PRTP=2% PRTP=3%
Figure 3. The marginal damage cost of carbon emissions as a function of the rate of risk aversion for selected rates of time preference and alternative income elasticities.
2.0
1.5
1.0
0.5
0.0
0.0 0.5 1.0 1.5 2.0 2.5 3.0
-0.4 -0.2 0.0 0.2 0.4 0.6 0.8 1.0
income elasticity
risk aversion time preference
0.8-1 0.6-0.8 0.4-0.6 0.2-0.4 -0-0.2 -0.2--0 -0.4--0.2
Figure 4. The implied income elasticity of total impacts as a function of the rate of risk aversion and the pure rate of time preference.
Panel A Panel B
-10 0 10 20 30 40 50 60 70 80 90 100
3.0 2.5 2.0 1.5 1.0 0.5 0.0
income elasticity of marginal utility
$/tC
A2 B2 FUND A1 B2
0 100 200 300 400 500 600 700 800 900 1000
3.0 2.5 2.0 1.5 1.0 0.5 0.0
income elasticity of marginal utility
$/
tC
[image:23.612.66.546.74.248.2]A2 FUND B2 B2 A1
Figure 5. The marginal damage cost of carbon emissions as a function of the rate of risk aversion for selected rates of time preference and alternative scenarios.
3.0 2.5
2.0 1.5
1.0 0.5
0.00.0
1.0 2.0
3.0 0.000
0.002 0.004 0.006 0.008 0.010 0.012 0.014 0.016 0.018 0.020
probability
risk aversion
time preference
[image:24.612.101.531.82.400.2]0.018-0.02 0.016-0.018 0.014-0.016 0.012-0.014 0.01-0.012 0.008-0.01 0.006-0.008 0.004-0.006 0.002-0.004 0-0.002
Table 1. Estimates of the expected social cost of carbon($/tC) and its standard deviation ($/tC).
Equity weighting included
No Yes
Uncertainty included No -1.88 8.96
(2.20) (6.88)
Yes -0.35 44.35
(4.85) (11.85)
References
Anthoff, D., C. Hepburn and R.S.J. Tol (2009), ‘Equity weighting and the marginal damage costs of climate change’, Ecological Economics, 68(3), 836-849.
Anthoff, D., R.S.J.Tol, and G.W.Yohe (2008), Risk Aversion, Time Preference, and the Social Cost of
Carbon, Working Paper252 ,Economic and Social Research Institute, Dublin.
Arrow, K.J. (2007), 'Global Climate Change: A Challenge to Policy', Economists' Voice (June), 1-5.
Azar, C. and T.Sterner (1996), 'Discounting and Distributional Considerations in the Context of Global Warming', Ecological Economics, 19, 169-184.
Batjes, J.J. and C.G.M.Goldewijk (1994), The IMAGE 2 Hundred Year (1890-1990) Database of the
Global Environment (HYDE)410100082, RIVM, Bilthoven.
Cline, W.R. (1992), Global Warming - The Benefits of Emission Abatement ,OECD, Paris.
Dasgupta, P. (2007), 'Commentary: The Stern Review's Economics of Climate Change', National
Institute Economic Review, 199, 4-7.
Evans, D.J. and H.Sezer (2004), 'Social Discount Rates for Six Major Countries', Applied Economics
Letters, 11, 557-560.
Evans, D.J. and H.Sezer (2005), 'Social Discount Rates for Member Countries of the European Union',
Journal of Economic Studies, 32, (1), 47-59.
Fankhauser, S. (1994), 'Protection vs. Retreat -- The Economic Costs of Sea Level Rise', Environment
and Planning A, 27, 299-319.
Fankhauser, S., R.S.J.Tol, and D.W.Pearce (1997), 'The Aggregation of Climate Change Damages: A Welfare Theoretic Approach', Environmental and Resource Economics, 10, 249-266.
Guo, J., C.J.Hepburn, R.S.J.Tol, and D.Anthoff (2006), 'Discounting and the Social Cost of Climate Change: A Closer Look at Uncertainty', Environmental Science & Policy, 9, 205-216.
Hammitt, J.K., R.J.Lempert, and M.E.Schlesinger (1992), 'A Sequential-Decision Strategy for Abating Climate Change', Nature, 357, 315-318.
Hasselmann, K., S.Hasselmann, R.Giering, V.Ocana, and H.von Storch (1997), 'Sensitivity Study of Optimal CO2 Emission Paths Using a Simplified Structural Integrated Assessment Model (SIAM)',
Climatic Change, 37, 345-386.
Hoel, M. and T.Sterner (2007), 'Discounting and Relative Prices', Climatic Change, 84, 265-280.
Horowitz, J.K. (2002), 'Preferences in the Future', Environmental and Resource Economics, 21, 241-259.
Jensen, P.H. and E.Webster (2007), 'Is Stern Correct? Does Climate Change Require Policy Intervention?', Australian Economic Review, 40, (4), 421-431.
Kattenberg, A., F.Giorgi, H.Grassl, G.A.Meehl, J.F.B.Mitchell, R.J.Stouffer, T.Tokioka, A.J.Weaver, and T.M.L.Wigley (1996), 'Climate Models - Projections of Future Climate', in Climate Change 1995: The Science of Climate Change -- Contribution of Working Group I to the Second Assessment Report
of the Intergovernmental Panel on Climate Change, 1 edn, J.T. Houghton et al. (eds.), Cambridge
University Press, Cambridge, pp. 285-357.
Koegel, T. (2009), On the Relation with Dual-Rate Discounting and Substitutability, Economics Discussion Paper2009-10, Institute for World Economics, Kiel.
Leggett, J., W.J.Pepper, and R.J.Swart (1992), 'Emissions Scenarios for the IPCC: An Update', in
Climate Change 1992 - The Supplementary Report to the IPCC Scientific Assessment, 1 edn, vol. 1 J.T.
Houghton, B.A. Callander, and S.K. Varney (eds.), Cambridge University Press, Cambridge, pp. 71-95.
Link, P.M. and R.S.J.Tol (2004), 'Possible economic impacts of a shutdown of the thermohaline circulation: an application of FUND', Portuguese Economic Journal, 3, 99-114.
Maier-Reimer, E. and K.Hasselmann (1987), 'Transport and Storage of Carbon Dioxide in the Ocean: An Inorganic Ocean Circulation Carbon Cycle Model', Climate Dynamics, 2, 63-90.
Mendelsohn, R.O. (2008), 'Is the stern review an economic analysis?', Rev Environ Econ Policy, 2, (1), pp. 45-60.
Mendelsohn, R.O., W.N.Morrison, M.E.Schlesinger, and N.G.Andronova (2000), 'Country-specific market impacts of climate change', Climatic Change, 45, 553-569.
Narita, D., D.Anthoff, and R.S.J.Tol (2008), Damage Costs of Climate Change through Intensification
of Tropical Cyclone Activities: An Application of FUND, Working Paper259 ,Economic and Social
Research Institute, Dublin.
Narita, D., D.Anthoff, and R.S.J.Tol (2009), Economic Costs of Extratropical Storms under Climate
Change: An Application of FUND, Working Paper274 ,Economic and Social Research Institute,
Dublin.
Nordhaus, W.D. (2007), 'Critical Assumptions in the Stern Review on Climate Change', Science, 317, 201-202.
Ramaswamy, V., O.Boucher, J.Haigh, D.Hauglustaine, J.Haywood, G.Myhre, T.Nakajima, G.Y.Shi, and S.Solomon (2001), 'Radiative Forcing of Climate Change', in Climate Change 2001: The Scientific Basis -- Contribution of Working Group I to the Third Assessment Report of the Intergovernmental
Panel on Climate Change, J.T. Houghton and Y. Ding (eds.), Cambridge University Press, Cambridge,
Ramsey, F. (1928), 'A Mathematical Theory of Saving', Economic Journal, 38, 543-549.
Stern, N.H. (1977), 'Welfare Weights and the Elasticity of the Marginal Valuation of Income', in
Studies in Modern Economic Analysis: Proceedings of the Annual Conference of the Association of
University Teachers of Economics, M.J. Artis and A.R. Norbay (eds.), Blackwell, Oxford, pp. 209-257.
Stern, N.H. (2008), 'The Economics of Climate Change', American Economic Review, 98, (2), 1-37.
Stern, N.H., S.Peters, V.Bakhshi, A.Bowen, C.Cameron, S.Catovsky, D.Crane, S.Cruickshank, S.Dietz, N.Edmonson, S.-L.Garbett, L.Hamid, G.Hoffman, D.Ingram, B.Jones, N.Patmore, H.Radcliffe,
R.Sathiyarajah, M.Stock, C.Taylor, T.Vernon, H.Wanjie, and D.Zenghelis (2006), Stern Review: The
Economics of Climate Change Cambridge University Press, Cambridge.
Stern, N.H. and C.Taylor (2007), 'Climate Change: Risks, Ethics and the Stern Review', Science, 317, 203-204.
Sterner, T. and U.M.Persson (2008), 'An even sterner review: Introducing relative prices into the discounting debate', Review of Environmental Economics and Policy, 2, (1), 61-76.
Tol, R.S.J. (1995), 'The Damage Costs of Climate Change Toward More Comprehensive Calculations',
Environmental and Resource Economics, 5, 353-374.
Tol, R.S.J. (1997), 'On the Optimal Control of Carbon Dioxide Emissions: An Application of FUND',
Environmental Modeling and Assessment, 2, 151-163.
Tol, R.S.J. (1999), 'The Marginal Costs of Greenhouse Gas Emissions', Energy Journal, 20, (1), 61-81.
Tol, R.S.J. (2001), 'Equitable Cost-Benefit Analysis of Climate Change', Ecological Economics, 36, (1), 71-85.
Tol, R.S.J. (2002a), 'Estimates of the Damage Costs of Climate Change - Part 1: Benchmark Estimates',
Environmental and Resource Economics, 21, 47-73.
Tol, R.S.J. (2002b), 'Estimates of the Damage Costs of Climate Change - Part II: Dynamic Estimates',
Environmental and Resource Economics, 21, 135-160.
Tol, R.S.J. (2002c), 'Welfare Specifications and Optimal Control of Climate Change: an Application of
FUND', Energy Economics, 24, 367-376.
Tol, R.S.J. (2003), 'On dual-rate discounting', Economic Modelling, 21, 95-98.
Tol, R.S.J. (2005a), 'Emission Abatement versus Development as Strategies to Reduce Vulnerability to Climate Change: An Application of FUND', Environment and Development Economics, 10, 615-629.
Tol, R.S.J. (2006), 'Multi-Gas Emission Reduction for Climate Change Policy: An Application of FUND', Energy Journal (Multi-Greenhouse Gas Mitigation and Climate Policy Special Issue), 235-250.
Tol, R.S.J., T.E.Downing, and N.Eyre (1999), The Marginal Costs of Radiatively-Active Gases
W99/32 ,Institute for Environmental Studies, Vrije Universiteit, Amsterdam.
Tol, R.S.J., K.L.Ebi, and G.W.Yohe (2007), 'Infectious Disease, Development, and Climate Change: A Scenario Analysis', Environment and Development Economics, 12, 687-706.
Weitzman, M.L. (2007), 'A Review of the Stern Review on the Economics of Climate Change', Journal
of Economic Literature, 45, (3), 703-724.
Weyant, J.P. (2008), 'A critique of the stern review's mitigation cost analyses and integrated assessment', Review of Environmental Economics and Policy, 2, (1), 77-93.
Yang, Z. (2003), 'Dual-rate discounting in dynamic economic-environmental modeling', Economic
Year Number Title/Author(s) ESRI Authors/Co-authors Italicised
2009
275 Projecting the Future Numbers of Migrant Workers in the Health
and Social Care Sectors in Ireland
Alan Barrett and Anna Rust
274 Economic Costs of Extratropical Storms under Climate Change: An
application of FUND
Daiju Narita, Richard S.J. Tol, David Anthoff
273 The Macro-Economic Impact of Changing the Rate of Corporation
Tax
Thomas Conefrey and John D. Fitz Gerald
272 The Games We Used to Play
An Application of Survival Analysis to the Sporting Life-course
Pete Lunn
2008
271 Exploring the Economic Geography of Ireland
Edgar Morgenroth
270 Benchmarking, Social Partnership and Higher Remuneration: Wage
Settling Institutions and the Public-Private Sector Wage Gap in Ireland
Elish Kelly, Seamus McGuinness, Philip O’Connell
269 A Dynamic Analysis of Household Car Ownership in Ireland
Anne Nolan
268 The Determinants of Mode of Transport to Work in the Greater
Dublin Area
Nicola Commins and Anne Nolan
267 Resonances from Economic Development for Current Economic
Policymaking
Frances Ruane
266 The Impact of Wage Bargaining Regime on Firm-Level
Competitiveness and Wage Inequality: The Case of Ireland
Seamus McGuinness, Elish Kelly and Philip O’Connell
265 Poverty in Ireland in Comparative European Perspective
264 A Hedonic Analysis of the Value of Rail Transport in the Greater Dublin Area
Karen Mayor, Seán Lyons, David Duffy and Richard S.J. Tol
263 Comparing Poverty Indicators in an Enlarged EU
Christopher T. Whelan and Bertrand Maître
262 Fuel Poverty in Ireland: Extent,
Affected Groups and Policy Issues
Sue Scott, Seán Lyons, Claire Keane, Donal McCarthy and Richard S.J. Tol
261 The Misperception of Inflation by Irish Consumers
David Duffy and Pete Lunn
260 The Direct Impact of Climate Change on Regional Labour
Productivity
Tord Kjellstrom, R Sari Kovats, Simon J. Lloyd, Tom Holt, Richard
S.J. Tol
259 Damage Costs of Climate Change through Intensification of Tropical
Cyclone Activities: An Application of FUND
Daiju Narita, Richard S. J. Tol and David Anthoff
258 Are Over-educated People Insiders or Outsiders?
A Case of Job Search Methods and Over-education in UK
Aleksander Kucel, Delma Byrne
257 Metrics for Aggregating the Climate Effect of Different Emissions: A
Unifying Framework
Richard S.J. Tol, Terje K. Berntsen, Brian C. O’Neill, Jan S. Fuglestvedt, Keith P. Shine, Yves Balkanski and Laszlo Makra
256 Intra-Union Flexibility of Non-ETS Emission Reduction Obligations in
the European Union
Richard S.J. Tol
255 The Economic Impact of Climate Change
Richard S.J. Tol
254 Measuring International Inequity Aversion
Richard S.J. Tol
253 Using a Census to Assess the Reliability of a National Household
Survey for Migration Research: The Case of Ireland
252 Risk Aversion, Time Preference, and the Social Cost of Carbon
David Anthoff, Richard S.J. Tol and Gary W. Yohe
251 The Impact of a Carbon Tax on Economic Growth and Carbon
Dioxide Emissions in Ireland
Thomas Conefrey, John D. Fitz Gerald, Laura Malaguzzi Valeri and
Richard S.J. Tol
250 The Distributional Implications of a Carbon Tax in Ireland
Tim Callan, Sean Lyons, Susan Scott, Richard S.J. Tol and Stefano Verde
249 Measuring Material Deprivation in the Enlarged EU
Christopher T. Whelan, Brian Nolan and Bertrand Maître
248 Marginal Abatement Costs on Carbon-Dioxide Emissions: A
Meta-Analysis
Onno Kuik, Luke Brander and Richard S.J. Tol
247 Incorporating GHG Emission Costs in the Economic Appraisal of
Projects Supported by State Development Agencies
Richard S.J. Tol and Seán Lyons
246 A Carton Tax for Ireland
Richard S.J. Tol, Tim Callan, Thomas Conefrey, John D. Fitz Gerald, Seán Lyons, Laura Malaguzzi Valeri and Susan Scott
245 Non-cash Benefits and the Distribution of Economic Welfare
Tim Callan and Claire Keane
244 Scenarios of Carbon Dioxide Emissions from Aviation
Karen Mayor and Richard S.J. Tol
243 The Effect of the Euro on Export Patterns: Empirical Evidence from
Industry Data
Gavin Murphy and Iulia Siedschlag
242 The Economic Returns to Field of Study and Competencies Among
Higher Education Graduates in Ireland
Elish Kelly, Philip O’Connell and Emer Smyth
241 European Climate Policy and Aviation Emissions
Karen Mayor and Richard S.J. Tol
240 Aviation and the Environment in the Context of the EU-US Open
Skies Agreement
239 Yuppie Kvetch? Work-life Conflict and Social Class in Western Europe
Frances McGinnity and Emma Calvert
238 Immigrants and Welfare Programmes: Exploring the Interactions
between Immigrant Characteristics, Immigrant Welfare Dependence and Welfare Policy
Alan Barrett and Yvonne McCarthy
237 How Local is Hospital Treatment? An Exploratory Analysis of
Public/Private Variation in Location of Treatment in Irish Acute Public Hospitals
Jacqueline O’Reilly and Miriam M. Wiley
236 The Immigrant Earnings Disadvantage Across the Earnings and
Skills Distributions: The Case of Immigrants from the EU’s New Member States in Ireland
Alan Barrett, Seamus McGuinness and Martin O’Brien
235 Europeanisation of Inequality and European Reference Groups
Christopher T. Whelan and Bertrand Maître
234 Managing Capital Flows: Experiences from Central and Eastern
Europe
Jürgen von Hagen and Iulia Siedschlag
233 ICT Diffusion, Innovation Systems, Globalisation and Regional
Economic Dynamics: Theory and Empirical Evidence
Charlie Karlsson, Gunther Maier, Michaela Trippl, Iulia Siedschlag,
Robert Owen and Gavin Murphy
232 Welfare and Competition Effects of Electricity Interconnection
between Great Britain and Ireland
Laura Malaguzzi Valeri
231 Is FDI into China Crowding Out the FDI into the European Union?
Laura Resmini and Iulia Siedschlag
230 Estimating the Economic Cost of Disability in Ireland
John Cullinan, Brenda Gannon and Seán Lyons
229 Controlling the Cost of Controlling the Climate: The Irish
Government’s Climate Change Strategy
Colm McCarthy, Sue Scott
228 The Impact of Climate Change on the Balanced-Growth-Equivalent:
An Application of FUND
227 Changing Returns to Education During a Boom? The Case of Ireland
Seamus McGuinness, Frances McGinnity, Philip O’Connell
226 ‘New’ and ‘Old’ Social Risks: Life Cycle and Social Class Perspectives
on Social Exclusion in Ireland
Christopher T. Whelan and Bertrand Maître
225 The Climate Preferences of Irish Tourists by Purpose of Travel
Seán Lyons, Karen Mayor and Richard S.J. Tol
224 A Hirsch Measure for the Quality of Research Supervision, and an
Illustration with Trade Economists
Frances P. Ruane and Richard S.J. Tol
223 Environmental Accounts for the Republic of Ireland: 1990-2005
Seán Lyons, Karen Mayor and Richard S.J. Tol
2007 222 Assessing Vulnerability of Selected Sectors under Environmental Tax Reform: The issue of pricing power
J. Fitz Gerald, M. Keeney and S. Scott
221 Climate Policy Versus Development Aid
Richard S.J. Tol
220 Exports and Productivity – Comparable Evidence for 14 Countries
The International Study Group on Exports and Productivity
219 Energy-Using Appliances and Energy-Saving Features: Determinants
of Ownership in Ireland
Joe O’Doherty, Seán Lyons and Richard S.J. Tol
218 The Public/Private Mix in Irish Acute Public Hospitals: Trends and
Implications
Jacqueline O’Reilly and Miriam M. Wiley
217 Regret About the Timing of First Sexual Intercourse: The Role of
Age and Context
Richard Layte, Hannah McGee
216 Determinants of Water Connection Type and Ownership of
Water-Using Appliances in Ireland
Joe O’Doherty, Seán Lyons and Richard S.J. Tol
215 Unemployment – Stage or Stigma?
Being Unemployed During an Economic Boom
214 The Value of Lost Load
Richard S.J. Tol
213 Adolescents’ Educational Attainment and School Experiences in
Contemporary Ireland
Merike Darmody, Selina McCoy, Emer Smyth
212 Acting Up or Opting Out? Truancy in Irish Secondary Schools
Merike Darmody, Emer Smyth and Selina McCoy
211 Where do MNEs Expand Production: Location Choices of the
Pharmaceutical Industry in Europe after 1992
Frances P. Ruane, Xiaoheng Zhang
210 Holiday Destinations: Understanding the Travel Choices of Irish
Tourists
Seán Lyons, Karen Mayor and Richard S.J. Tol
209 The Effectiveness of Competition Policy and the Price-Cost Margin:
Evidence from Panel Data
Patrick McCloughan, Seán Lyons and William Batt
208 Tax Structure and Female Labour Market Participation: Evidence
from Ireland
Tim Callan, A. Van Soest, J.R. Walsh
207 Distributional Effects of Public Education Transfers in Seven
European Countries