Statistical
First Release
1 SFR 14/2012
12 July 2012
Coverage: England
Theme: Children, Education and Skills
Issued by
Department for Education Sanctuary Buildings Great Smith Street London SW1P 3BT
Telephone: Press Office
020 7783 8300
Public Enquiries 0370 000 2288
Statistician Andrew Clarke
Schools.Statistics@educat ion.gsi.gov.uk
Internet
http://www.education.gov.u k/rsgateway/DB/SFR/s001 075/index.shtml
SPECIAL EDUCATIONAL NEEDS IN ENGLAND, JANUARY 2012
INTRODUCTION
This Statistical First Release brings together information on pupils with Special Educational Needs (SEN) and related information about special schools in England. It provides analyses on the characteristics of pupils by their SEN provision together with information on the assessment and placement of pupils with statements of SEN.
Information is drawn from two sources: the School Census and the SEN2 survey. Figures from these two sources should not be aggregated or compared. See Technical Notes 2 and 4.
See Technical Note 7 for details of changes to the content, including additional tables, to this Statistical First Release.
KEY POINTS
Pupils with SEN in schools (Tables 1A, 1B and 1C)
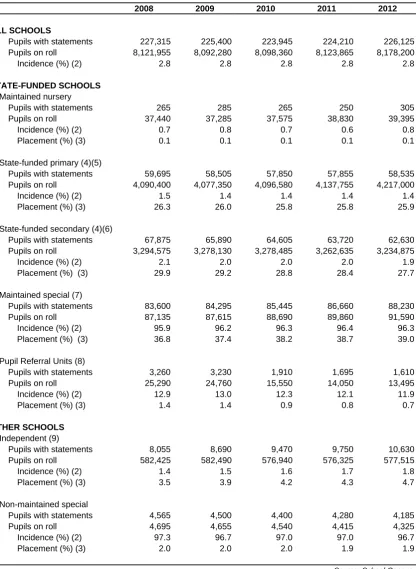
• In January 2012, some 226,125 pupils (2.8 per cent) across all schools in England had statements of SEN. This percentage has remained
unchanged in recent years.
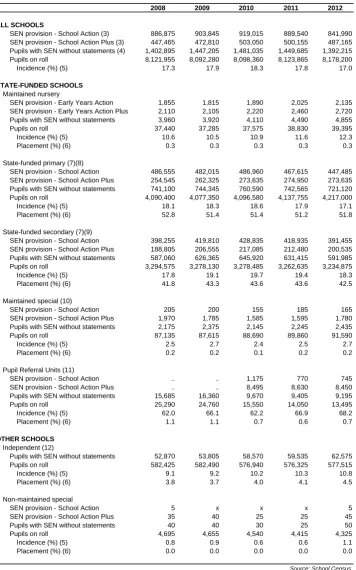
• In 2012 there were some 1,392,215 pupils with SEN without statements, 17.0 per cent of pupils across all schools, compared to 17.8 per cent in 2011. Most of the decrease is in pupils at School Action.
Gender (Tables 5A, 5B, 5C and 5D)
• In primary schools, the incidence of pupils with statements of SEN was much higher for boys (2.0 per cent) than for girls (0.8 per cent). Similarly, the incidence of pupils with SEN without statements was higher for boys (21.8 per cent) than for girls (12.2 per cent).
• Secondary schools show a similar picture regarding gender. The
incidence of boys with statements (2.9 per cent) is nearly three times that for girls (1.0 per cent). The incidence of pupils with SEN without
statements was 22.1 per cent for boys and 14.5 per cent for girls.
Free school meal eligibility (Table 7)
meals was much higher for pupils with SEN than for pupils with no SEN.
• In primary schools, 31.5 per cent of pupils with SEN (with and without statements) were known to be eligible for and claiming free school meals, compared with 15.2 per cent of pupils with no SEN.
• In secondary schools the comparable figures were 26.9 per cent for pupils with SEN and 11.7 per cent for pupils with no SEN.
• In special schools, 35.8 per cent of pupils were eligible for and claiming free school meals.
Incidence and placement of pupils with SEN
• 53.7 per cent of pupils with statements of SEN were placed in mainstream schools (nursery, primary, secondary, academies, city technology colleges), compared to 54.3 per cent in 2011. In addition, 39.0 per cent were placed in state-funded special schools, 4.7 per cent in independent schools, 1.9 per cent in non-maintained special schools and 0.7 per cent in pupil referral units.
• The incidence of pupils with SEN with statements was higher in secondary schools (1.9 per cent) than in primary schools (1.4 per cent). The difference for those with SEN without statements was relatively less marked, 18.3 per cent in secondary schools compared to 17.1 per cent in primary schools.
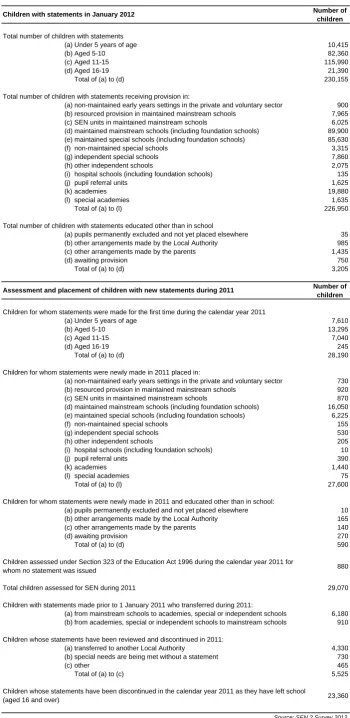
Newly made statements of SEN (Tables 2 and 3A)
• Of the 29,070 children assessed for SEN during the 2011 calendar year, 28,190 (97.0 per cent) were issued with a statement for the first time.
• For those children issued with a new statement, the pattern of placements was similar to 2010:
• 6.4 per cent were placed in resourced provision or SEN units in maintained mainstream schools;
• 62.0 per cent were placed in mainstream state-funded schools;
• 24.8 per cent were placed in special schools (maintained, non-maintained, independent and academies);
• 2.6 per cent were placed in non-maintained early years settings in the private and voluntary sector, and 4.2 per cent elsewhere.
All children with statements of SEN (Tables 3B, 4A and 4B)
• Figures for all children with statements of SEN (not just those in schools) show that the number of statements maintained by an authority has increased by nearly 1,140 to 230,155 at January 2012. Of those, 45.5 per cent of children with statements of SEN were placed in early years settings or in maintained mainstream schools (including in resourced provision or SEN units in maintained mainstream schools). This compares with 51.8 per cent at January 2011.
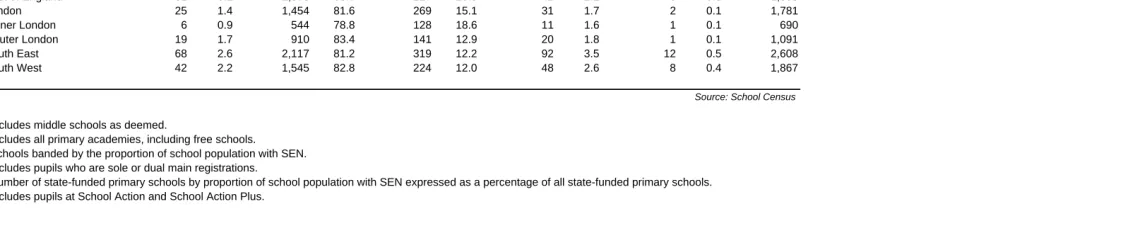
• 76.2 per cent of state-funded primary schools and 58.8 per cent of state-funded secondary schools had fewer than 2 per cent of pupils with statements of SEN. Fewer than 1 per cent of both primary and secondary schools had over 10 per cent of pupils with statements.
Characteristics of pupils with SEN
Age (Tables 5A, 5B, 5C and 5D)
• In primary schools, the percentage of pupils with statements of SEN increased with age. For secondary school age pupils in secondary schools, the percentage of pupils with statements was fairly constant through the age range.
• The percentage of pupils with SEN without statements in primary schools increased fairly
constantly with age. In secondary schools, for pupils of secondary-school age, the percentage of pupils with SEN without statements decreased from age 11 onwards, falling sharply at age 16.
• In special schools, the percentage of pupils with statements of SEN was lowest among those aged under 5 and remained constant from ages 6 to 18. For those with SEN without statements, the highest percentage was in the under 5 age group.
Ethnicity (Tables 8A, 8B, 8C and 8D)
• In January 2012, around 1.6 per cent of White ethnic origin pupils had statements of SEN in primary schools. The figure is similar for Mixed pupils (1.7 per cent) but for Black pupils the figure is around 1.9 per cent.
• In secondary schools, 2.0 per cent of White pupils had statements of SEN, the same as for both Mixed pupils and Black pupils.
• Across primary, secondary and special schools combined, the percentage of pupils with statements of SEN was greatest amongst Traveller of Irish Heritage pupils (5.2 per cent), Any Other Black Background pupils (4.1 per cent) and Black Caribbean pupils (4.0 per cent). However, caution is recommended in interpreting data for Traveller of Irish Heritage children due to the small numbers recorded.
• Similarly, the percentage of pupils with SEN without statements, across primary, secondary and special schools combined, was greatest amongst Traveller of Irish Heritage pupils (52.0 per cent), Gypsy/Roma pupils (43.1 per cent) and Black Caribbean pupils (26.7 per cent). Again, caution is recommended in interpreting data for Gypsy/Roma and Traveller of Irish Heritage children due to the small numbers recorded.
• In primary, secondary and special schools combined, the lowest occurrence of SEN (with and without statements) was generally found in pupils of Chinese ethnic origin and Asian ethnic origin. Again, caution is needed in interpreting data for Chinese children due to the small numbers involved.
First Language (Tables 9A, 9B, 9Cand 9D)
• In primary schools, the percentage of pupils with statements of SEN is lower for pupils whose first language is known or believed to be other than English (1.4 per cent), compared to those whose first language is known or believed to be English (1.7 per cent). A similar pattern is seen in secondary schools (1.3 per cent, compared to 2.0 per cent).
• In primary schools, the percentage of pupils with SEN without statements was slightly lower for pupils whose first language is known or believed to be other than English (19.4 per cent), compared to those whose first language is known or believed to be English (19.7 per cent). In secondary schools, the percentage was slightly higher for pupils whose first language is known or believed to be other than English (20.3 per cent), compared to those whose first language is known or believed to be English (18.0 per cent).
Type of need (Table 10A)
• Primary need is collected for those pupils at School Action Plus or with a statement of SEN. Overall, the distribution across the types of SEN is similar to last year. The figures below are for School Action Plus and statemented pupils but it should be noted that the distributions vary between these two groups:
• In state-funded primary schools the three most frequent types of primary need were
Speech, Language and Communication needs (29.1 per cent), Moderate Learning Difficulty (21.8 per cent) and Behaviour, Emotional & Social Difficulties (18.6 per cent).
• In state-funded secondary schools the three most frequent types of primary need were Behaviour, Emotional & Social Difficulties (29.0 per cent), Moderate Learning Difficulty (22.7 per cent) and Specific Learning Difficulty (15.9 per cent).
• In all special schools the three most frequent types of primary need were Severe Learning Difficulty (24.6 per cent), Autistic Spectrum Disorder (20.4 per cent) and Moderate Learning Difficulty (18.6 per cent).
CHARTS
Chart A State-funded primary, state-funded secondary and special schools: Distribution of primary type of need for pupils at school action plus, England, January 2012
Chart B State-funded primary, state-funded secondary and special schools: Distribution of primary type of need for pupils with a statement of SEN, England, January 2012
TABLES
Table 1A All schools: Pupils with statements of special educational needs (SEN), England, January 2008 to 2012
Table 1B All schools: Pupils with special educational needs (SEN) without statements, England, January 2008 to 2012
Table 1C All schools: Pupils with special educational needs (SEN), England, January 2008 to 2012
Table 1D Academies: Pupils with special educational needs (SEN), England, January 2008 to 2012
Table 2 Education arrangements, assessment and placement of children for whom local authorities maintain a statement of special educational needs (SEN), England
Table 3A Assessment and placement of children with new statements of special educational needs (SEN), England, 2007 to 2011
Table 3B Placement of children with a statement maintained by the local authority, England, 2008 to 2012
Table 4A State-funded primary schools: Number of schools by percentage of pupils with special educational needs (SEN), England, January 2012
Table 4B State-funded secondary schools: Number of schools by percentage of pupils with special educational needs (SEN), England, January 2012
Table 5A State-funded primary schools: Number of pupils with special educational needs (SEN) by age and gender, England, January 2012
Table 5B State-funded secondary schools: Number of pupils with special educational needs (SEN) by age and gender, England, January 2012
Table 5C Special schools: Number of pupils with special educational needs (SEN) by age and gender, England, January 2012
Table 5D State-funded primary, state-funded secondary and special schools: Number of pupils with special educational needs (SEN) by age and gender, England, January 2012
Table 6A State-funded primary schools: Number of pupils with special educational needs (SEN) by national curriculum year group, England, January 2012
Table 6B State-funded secondary schools: Number of pupils with special educational needs (SEN) by national curriculum year group, England, January 2012
Table 6C Special schools: Number of pupils with special educational needs (SEN) by national curriculum year group, England, January 2012
Table 6D State-funded primary, state-funded secondary and special schools: Number of pupils with special educational needs (SEN) by national curriculum year group, England, January 2012
Table 7 State-funded primary, state-funded secondary and special schools: Number and percentage of pupils known to be eligible for and claiming free school meals by special educational needs (SEN) provision, England, January 2012
Table 8A State-funded primary schools: Number of pupils with special educational needs (SEN) by ethnic group, England, January 2012
Table 8B State-funded secondary schools: Number of pupils with special educational needs (SEN) by ethnic group, England, January 2012
Table 8C Special schools: Number of pupils with special educational needs (SEN) by ethnic group, England, January 2012
Table 8D State-funded primary, state-funded secondary and special schools: Number of pupils with special educational needs (SEN) by ethnic group, England, January 2012
Table 9A State-funded primary schools: Number of pupils with special educational needs (SEN) by first language, England, January 2012
Table 9B State-funded secondary schools: Number of pupils with special educational needs (SEN) by first language, England, January 2012
Table 9C Special schools: Number of pupils with special educational needs (SEN) by first language, England, January 2012
Table 9D State-funded primary, state-funded secondary and special schools: Number of pupils with special educational needs (SEN) by first language, England, January 2012
Table 10A State-funded primary, state-funded secondary and special schools: Number and percentage of pupils by type of need, England, January 2012
Table 10B Academies: Number and percentage of pupils by type of need, England, January 2012
Table 11 Special schools: Number and percentage of pupils attending special schools, England, January 2008 to 2012
Table 12 Special schools: Types of provision for which schools have been approved, England, January 2012
Table 13A Special schools: Number of schools by size, England, January 2012
Table 13B Special schools: Number of pupils by the size of their school, England, January 2012
ADDITIONAL TABLES
The following additional tables will be available on our website at
http://www.education.gov.uk/rsgateway/DB/SFR/s001075/index.shtml.
Local Authority Tables:
Table 14A All schools: Pupils with statements of special educational needs (SEN), based on where the pupil attends school, by local authority area and region, England, January 2008 to 2012
Table 14B All schools: Pupils with special educational needs (SEN) without a statement, based on where the pupil attends school, by local authority area and region, England, January 2009 to 2012
Table 15 State-funded primary schools: Number of pupils with special educational needs (SEN), based on where the pupil attends school, by local authority area and region, England, January 2012
Table 16 State-funded secondary schools: Number of pupils with special educational needs (SEN), based on where the pupil attends school, by local authority area and region, England, January 2012
Table 17 All schools: Number of pupils with special educational needs (SEN), based on where the pupil attends school, by local authority area and region, England, January 2012
Table 18 Number of pupils with a statement maintained by each local authority, by local authority area and region, England, 2008 to 2012
Table 19 Assessment and placement of children with new statements of special educational needs (SEN) during 2011, by local authority area and region, England
Table 20 Maintained mainstream schools: Pupils for whom statements were newly made, by local authority area and region, England, 2007 – 2011
Table 21 Placement of children with a statement maintained by each local authority, by local authority area and region, England
Table 22 State-funded primary schools: Number and percentage of pupils with statements of special educational needs (SEN) or at School Action Plus by type of need, by local authority area and region, England, January 2012
Table 23 State-funded secondary schools: Number and percentage of pupils with statements of special educational needs (SEN) or at School Action Plus by type of need, by local authority area and region, England, January 2012
Table 24 Special schools: Number and percentage of pupils with statements of special educational needs (SEN) or at school action plus by type of need, by local authority area and region, England, January 2012
Table 25 State-funded primary schools: Number and percentage of pupils with special
educational needs (SEN) attending SEN units or placed in resourced provision, by local authority area and region, England, January 2012
Table 26 State-funded secondary schools: Number and percentage of pupils with special
educational needs (SEN) attending SEN units or placed in resourced provision, by local authority area and region, England, January 2012
ADDITIONAL INFORMATION
In order to improve data accessibility, underlying data will be published at
http://www.education.gov.uk/rsgateway/DB/SFR/s001075/index.shtml on 12 July 2012 in the ‘Publication’s Underlying Data’ section.
Additional tables on pupil characteristics by primary need will be published on our website at
http://www.education.gov.uk/rsgateway/DB/SFR/s001075/index.shtml in October 2012.
RELATED PUBLICATIONS
SFR14/2011 - Special Educational Needs in England: January 2011 (http://www.education.gov.uk/rsgateway/DB/SFR/s001007/index.shtml) SFR10/2012 – Schools, Pupils and Their Characteristics, January 2012 (http://www.education.gov.uk/rsgateway/DB/SFR/s001071/index.shtml)
OSR20/2011 -Children with Special Educational Needs: an analysis, October 2011. (http://www.education.gov.uk/rsgateway/DB/STR/d001032/index.shtml)
TECHNICAL NOTES
Data Sources
1. Information presented in this Statistical First Release is drawn from two sources: the School Census and the SEN2 Survey. Figures sourced from the School Census and the SEN2 Survey are not directly comparable.
2. The School Census has collected information from schools on pupils with special educational needs (SEN) on the census date in January since 1985. It is completed by schools and records those pupils with and without statements who are educated at the school, regardless of which Local Authority (LA) is responsible for the pupil. Figures for pupils with SEN without statements were collected from maintained primary and secondary schools for the first time in 1995.
3. In January 2002, the School Census introduced a major change in that primary, secondary and special schools reported data at an individual pupil level for the first time. Whilst the overall collection of pupil level data for these schools was successful, it is possible that some discontinuity in the time series data has resulted from this underlying change in data collection. For instance, the national trend in SEN pupils with statements between 2001 and 2002 in School Census is different from that shown in the SEN2 survey. Whilst there are valid reasons as to why the figures will be different between these surveys, it is unusual for the trends to differ to this degree. Therefore information from this release may not be compatible with information for earlier years shown in previous publications.
4. The SEN2 Survey has collected information on children with statements on the census date in January and new statements made in the previous calendar year from LAs since 1984. SEN2 is completed by LAs and records those children for whom the LA is responsible (regardless of whether they are educated in the LA’s own maintained schools, in other LA’s schools, in the non-maintained or independent sectors or educated other than at school).
SEN legislation and effect on long term data trends
5. Arrangements for identifying and providing for children with SEN are set out in Part IV of the 1996 Education Act (and, prior to this, the 1981 and 1993 Education Acts). New rights and duties were introduced by the SEN and Disability Act 2001 (SENDA). A Code of Practice, issued in 1994,
supported the rights and duties in the 1996 Act. A new SEN Code of Practice took effect from January 2002. All LAs, schools and early years settings must have regard to it.
6. The SEN Code of Practice introduced in January 2002 replaced the five stages with
School/Early Years Action, School/Early Years Action Plus and Statements of SEN. The effect of this change was to reduce the number of pupils recorded as having SEN without statements. Numbers of children with SEN without statements reported in 2003 and later are not directly comparable with earlier years. Therefore information from this release may not be compatible with information for years prior to 2003 shown in previous publications. Further changes may result from the March 2011 public consultation “Support and aspiration: a new approach to Special Educational Needs and disability”.
7. The main changes from last year’s SFR are:
• There are two additional tables providing information on SEN for pupils in academies (tables 1D and 10B).
• Information on gifted and talented pupils is no longer collected.
10 General
8. The description ‘state-funded primary schools’ refers to those schools maintained by the local authority, including middle schools deemed as primary, as well as primary academies and primary free schools. The description ‘state-funded secondary schools’ refers to those schools maintained by the local authority, including middle schools deemed as secondary, city technology colleges, secondary academies and secondary free schools. The description ‘state-funded special schools’ refers to those schools maintained by the local authority, as well as special academies.
Confidentiality
9. Pupil numbers at national and regional levels have been rounded to the nearest 5. Pupil numbers of 1 or 2 have been suppressed, being replaced in the table by an ‘x’. Where any number is shown as zero (0), the original figure was also zero. Where the numerator or denominator of any percentage calculated on pupil numbers is 1 or 2, this has been replaced by an ‘x’.
10. The following symbols have been used within this publication:
0 – zero
x – small number suppressed to preserve confidentiality (see Technical Note 11)
. – not applicable
.. – not available
National Statistics publication
11. The United Kingdom Statistics Authority has designated these statistics as National Statistics, in accordance with the Statistics and Registration Service Act 2007 and signifying compliance with the Code of Practice for Official Statistics.
Designation can be broadly interpreted to mean that the statistics: • meet identified user needs;
• are well explained and readily accessible; • are produced according to sound methods, and
• are managed impartially and objectively in the public interest.
Once statistics have been designated as National Statistics it is a statutory requirement that the Code of Practice shall continue to be observed.
12. There are no planned revisions to this Statistical First Release, however, if at a later date we need to make a revision, this will comply with the departmental revisions policy which is published at
http://www.education.gov.uk/rsgateway/nat-stats.shtml. Enquiries
13. Enquiries (non-media) or feedback about information contained in this release should be addressed to Schools Data Unit, Room 1F Area H, Mowden Hall, Staindrop Road, Darlington, Co Durham, DL3 9BG or e-mail [email protected]
Chart A
STATE-FUNDED PRIMARY, STATE-FUNDED SECONDARY AND SPECIAL SCHOOLS (1)(2)(3)(4): DISTRIBUTION OF PRIMARY TYPE OF NEED FOR PUPILS AT SCHOOL ACTION PLUS (5)(6)(7)
January 2012 England
(1) Includes middle schools as deemed.
(2) Includes all primary academies, including free schools.
(3) Includes city technology and all secondary academies, including free schools.
(4) Includes maintained and non-maintained special schools and special academies. Excludes general hospital schools. (5) Includes pupils who have sole or dual main registrations.
(6) Pupils at School Action Plus provided information on their primary need and, if appropriate, their secondary need. Information on primary need only is given here. (7) Number of pupils by their main need expressed as a percentage of all pupils at School Action Plus.
0 5 10 15 20 25 30 35
S
pecific Learning
Difficulty Moderate
Learning Difficulty S
evere Learning
Difficulty
P
rofound &
Multiple Learning
Difficulty Behaviour,
E
m
otional &
Social Difficulties
S
peech,
Language and
Communications
Needs Hearing Impairment
V
isual Impairment
Multi- S
ensory
Impairment
Physical Disability Au
tistic S
pectrum
Disorder Other
Difficulty/Disability
Primary need
Per
cent
a
ge of
pupi
ls
Chart B
STATE-FUNDED PRIMARY, STATE-FUNDED SECONDARY AND SPECIAL SCHOOLS (1)(2)(3)(4): DISTRIBUTION OF PRIMARY TYPE OF NEED FOR PUPILS WITH A STATEMENT OF SEN (5)(6)(7)
January 2012 England
(1) Includes middle schools as deemed.
(2) Includes all primary academies, including free schools.
(3) Includes city technology and all secondary academies, including free schools.
(4) Includes maintained and non-maintained special schools and special academies. Excludes general hospital schools. (5) Includes pupils who have sole or dual main registrations.
(6) Pupils with a statement of SEN provided information on their primary need and, if appropriate, their secondary need. Information on primary need only is given here. (7) Number of pupils by their main need expressed as a percentage of all pupils with a statement of SEN.
0 5 10 15 20 25 30 Speci fi c Lear ni ng D iffic u lty Moder at e Lear ni ng Di ff icul ty Sever e Lear ni ng D iffic u lty Pr of ound & Mul ti pl e Lear ni ng D iffic u lty Behavi our , Emot ional & S o c ia l D iffic u ltie s Speech, Language and Communi cat ions Needs Hear ing Im pai rm ent Vi sual I m pai rm ent Mul ti - Sensor y Im pai rm ent P h y s ic a l D is a b ility A u tis tic S p e c tru m Di sor der Ot her D iffic u lty /D is a b ility Primary need
Percentage of pupils
Table 1A
ALL SCHOOLS:
PUPILS WITH STATEMENTS OF SPECIAL EDUCATIONAL NEEDS (SEN) (1)
As at January each year: 2008-2012 England
2008 2009 2010 2011 2012
ALL SCHOOLS
Pupils with statements 227,315 225,400 223,945 224,210 226,125
Pupils on roll 8,121,955 8,092,280 8,098,360 8,123,865 8,178,200
Incidence (%) (2) 2.8 2.8 2.8 2.8 2.8
STATE-FUNDED SCHOOLS
Maintained nursery
Pupils with statements 265 285 265 250 305
Pupils on roll 37,440 37,285 37,575 38,830 39,395
Incidence (%) (2) 0.7 0.8 0.7 0.6 0.8
Placement (%) (3) 0.1 0.1 0.1 0.1 0.1
State-funded primary (4)(5)
Pupils with statements 59,695 58,505 57,850 57,855 58,535
Pupils on roll 4,090,400 4,077,350 4,096,580 4,137,755 4,217,000
Incidence (%) (2) 1.5 1.4 1.4 1.4 1.4
Placement (%) (3) 26.3 26.0 25.8 25.8 25.9
State-funded secondary (4)(6)
Pupils with statements 67,875 65,890 64,605 63,720 62,630
Pupils on roll 3,294,575 3,278,130 3,278,485 3,262,635 3,234,875
Incidence (%) (2) 2.1 2.0 2.0 2.0 1.9
Placement (%) (3) 29.9 29.2 28.8 28.4 27.7
Maintained special (7)
Pupils with statements 83,600 84,295 85,445 86,660 88,230
Pupils on roll 87,135 87,615 88,690 89,860 91,590
Incidence (%) (2) 95.9 96.2 96.3 96.4 96.3
Placement (%) (3) 36.8 37.4 38.2 38.7 39.0
Pupil Referral Units (8)
Pupils with statements 3,260 3,230 1,910 1,695 1,610
Pupils on roll 25,290 24,760 15,550 14,050 13,495
Incidence (%) (2) 12.9 13.0 12.3 12.1 11.9
Placement (%) (3) 1.4 1.4 0.9 0.8 0.7
OTHER SCHOOLS
Independent (9)
Pupils with statements 8,055 8,690 9,470 9,750 10,630
Pupils on roll 582,425 582,490 576,940 576,325 577,515
Incidence (%) (2) 1.4 1.5 1.6 1.7 1.8
Placement (%) (3) 3.5 3.9 4.2 4.3 4.7
Non-maintained special
Pupils with statements 4,565 4,500 4,400 4,280 4,185
Pupils on roll 4,695 4,655 4,540 4,415 4,325
Incidence (%) (2) 97.3 96.7 97.0 97.0 96.7
Placement (%) (3) 2.0 2.0 2.0 1.9 1.9
Source: School Census
(1) Includes pupils who are sole or dual main registrations.
(2) Incidence of pupils - the number of pupils with statements expressed as a proportion of the number of pupils on roll. (3) Placement of pupils - the number of pupils with statements expressed as a proportion of the number of pupils with statements in all schools.
(4) Includes middle schools as deemed.
(5) Includes all primary academies, including free schools.
(6) Includes city technology colleges and all secondary academies, including free schools. Includes all-through schools. (7) Includes general hospital schools and special academies.
(8) Includes pupils registered with other providers and in further education colleges. Prior to 2010 includes dual subsidiary registered pupils.
(9) Includes direct grant nursery schools.
Table 1B ALL SCHOOLS:
PUPILS WITH SPECIAL EDUCATIONAL NEEDS (SEN) WITHOUT STATEMENTS (1)(2) As at January each year: 2008-2012
England
2008 2009 2010 2011 2012
ALL SCHOOLS
SEN provision - School Action (3) 886,875 903,845 919,015 889,540 841,990 SEN provision - School Action Plus (3) 447,465 472,810 503,050 500,155 487,165 Pupils with SEN without statements (4) 1,402,895 1,447,205 1,481,035 1,449,685 1,392,215 Pupils on roll 8,121,955 8,092,280 8,098,360 8,123,865 8,178,200
Incidence (%) (5) 17.3 17.9 18.3 17.8 17.0
STATE-FUNDED SCHOOLS Maintained nursery
SEN provision - Early Years Action 1,855 1,815 1,890 2,025 2,135 SEN provision - Early Years Action Plus 2,110 2,105 2,220 2,460 2,720 Pupils with SEN without statements 3,960 3,920 4,110 4,490 4,855
Pupils on roll 37,440 37,285 37,575 38,830 39,395
Incidence (%) (5) 10.6 10.5 10.9 11.6 12.3
Placement (%) (6) 0.3 0.3 0.3 0.3 0.3
State-funded primary (7)(8)
SEN provision - School Action 486,555 482,015 486,960 467,615 447,485 SEN provision - School Action Plus 254,545 262,325 273,635 274,950 273,635 Pupils with SEN without statements 741,100 744,345 760,590 742,565 721,120 Pupils on roll 4,090,400 4,077,350 4,096,580 4,137,755 4,217,000
Incidence (%) (5) 18.1 18.3 18.6 17.9 17.1
Placement (%) (6) 52.8 51.4 51.4 51.2 51.8
State-funded secondary (7)(9)
SEN provision - School Action 398,255 419,810 428,835 418,935 391,455 SEN provision - School Action Plus 188,805 206,555 217,085 212,480 200,535 Pupils with SEN without statements 587,060 626,365 645,920 631,415 591,985 Pupils on roll 3,294,575 3,278,130 3,278,485 3,262,635 3,234,875
Incidence (%) (5) 17.8 19.1 19.7 19.4 18.3
Placement (%) (6) 41.8 43.3 43.6 43.6 42.5
Maintained special (10)
SEN provision - School Action 205 200 155 185 165
SEN provision - School Action Plus 1,970 1,785 1,585 1,595 1,780 Pupils with SEN without statements 2,175 2,375 2,145 2,245 2,435
Pupils on roll 87,135 87,615 88,690 89,860 91,590
Incidence (%) (5) 2.5 2.7 2.4 2.5 2.7
Placement (%) (6) 0.2 0.2 0.1 0.2 0.2
Pupil Referral Units (11)
SEN provision - School Action .. .. 1,175 770 745
SEN provision - School Action Plus .. .. 8,495 8,630 8,450
Pupils with SEN without statements 15,685 16,360 9,670 9,405 9,195
Pupils on roll 25,290 24,760 15,550 14,050 13,495
Incidence (%) (5) 62.0 66.1 62.2 66.9 68.2
Placement (%) (6) 1.1 1.1 0.7 0.6 0.7
OTHER SCHOOLS Independent (12)
Pupils with SEN without statements 52,870 53,805 58,570 59,535 62,575
Pupils on roll 582,425 582,490 576,940 576,325 577,515
Incidence (%) (5) 9.1 9.2 10.2 10.3 10.8
Placement (%) (6) 3.8 3.7 4.0 4.1 4.5
Non-maintained special
SEN provision - School Action 5 x x x 5
SEN provision - School Action Plus 35 40 25 25 45
Pupils with SEN without statements 40 40 30 25 50
Pupils on roll 4,695 4,655 4,540 4,415 4,325
Incidence (%) (5) 0.8 0.9 0.6 0.6 1.1
Placement (%) (6) 0.0 0.0 0.0 0.0 0.0
Source: School Census
(1) Includes pupils at School Action and School Action Plus. (2) Includes pupils who are sole or dual main registrations.
(3) Excludes independent schools and general hospital schools as data collected is not broken down by SEN provision. Includes direct grant nurseries. (4) Includes pupils with SEN without statements in all school types.
(5) Incidence of pupils - the number of pupils with SEN without statements expressed as a proportion of the number of pupils on roll. (6) Placement of pupils - the number of pupils with SEN without statements expressed as a proportion of the number of
pupils without statements in all schools. (7) Includes middle schools as deemed.
(8) Includes all primary academies, including free schools.
(9) Includes city technology colleges and all secondary academies, including free schools. Includes all-through schools. (10) Includes general hospital schools and special academies. Prior to 2009 information on pupils with SEN without statements was not collected from general hospital schools.
(11) Includes pupils registered with other providers and in further education colleges. Prior to 2010 includes dual subsidiary registered pupils.
(12) Includes direct grant nursery schools.
.. Not available. x - 1 or 2 pupils.
Table 1C
ALL SCHOOLS:
PUPILS WITH SPECIAL EDUCATIONAL NEEDS (SEN) (1)(2)
As at January each year: 2008-2012 England
2008 2009 2010 2011 2012
ALL SCHOOLS
Pupils with SEN 1,630,210 1,672,610 1,704,980 1,673,895 1,618,340
Pupils on roll 8,121,955 8,092,280 8,098,360 8,123,865 8,178,200
Incidence (%) (3) 20.1 20.7 21.1 20.6 19.8
STATE-FUNDED SCHOOLS
Maintained nursery
Pupils with SEN 4,230 4,205 4,375 4,740 5,155
Pupils on roll 37,440 37,285 37,575 38,830 39,395
Incidence (%) (3) 11.3 11.3 11.6 12.2 13.1
Placement (%) (4) 0.3 0.3 0.3 0.3 0.3
State-funded primary (5)(6)
Pupils with SEN 800,800 802,850 818,440 800,420 779,655
Pupils on roll 4,090,400 4,077,350 4,096,580 4,137,755 4,217,000
Incidence (%) (3) 19.6 19.7 20.0 19.3 18.5
Placement (%) (4) 49.1 48.0 48.0 47.8 48.2
State-funded secondary (5)(7)
Pupils with SEN 654,935 692,255 710,525 695,135 654,620
Pupils on roll 3,294,575 3,278,130 3,278,485 3,262,635 3,234,875
Incidence (%) (3) 19.9 21.1 21.7 21.3 20.2
Placement (%) (4) 40.2 41.4 41.7 41.5 40.4
Maintained special (8)
Pupils with SEN 85,775 86,670 87,590 88,905 90,665
Pupils on roll 87,135 87,615 88,690 89,860 91,590
Incidence (%) (3) 98.4 98.9 98.8 98.9 99.0
Placement (%) (4) 5.3 5.2 5.1 5.3 5.6
Pupil Referral Units (9)
Pupils with SEN 18,945 19,585 11,580 11,095 10,805
Pupils on roll 25,290 24,760 15,550 14,050 13,495
Incidence (%) (3) 74.9 79.1 74.5 79.0 80.1
Placement (%) (4) 1.2 1.2 0.7 0.7 0.7
OTHER SCHOOLS
Independent (10)
Pupils with SEN 60,925 62,500 68,040 69,285 73,205
Pupils on roll 582,425 582,490 576,940 576,325 577,515
Incidence (%) (3) 10.5 10.7 11.8 12.0 12.7
Placement (%) (4) 3.7 3.7 4.0 4.1 4.5
Non-maintained special
Pupils with SEN 4,605 4,540 4,430 4,310 4,235
Pupils on roll 4,695 4,655 4,540 4,415 4,325
Incidence (%) (3) 98.1 97.6 97.6 97.6 97.8
Placement (%) (4) 0.3 0.3 0.3 0.3 0.3
Source: School Census
(1) Includes pupils with a statement of special educational needs, at School Action and School Action Plus. (2) Includes pupils who are sole or dual main registrations.
(3) Incidence of pupils - the number of pupils with SEN expressed as a proportion of the number of pupils on roll. (4) Placement of pupils - the number of pupils with SEN expressed as a proportion of the number of pupils with SEN in all schools.
(5) Includes middle schools as deemed.
(6) Includes all primary academies, including free schools.
(7) Includes city technology colleges and all secondary academies, including free schools. Includes all-through schools. (8) Includes general hospital schools and special academies. Prior to 2009 information on pupils with SEN
without statements was not collected from general hospital schools.
(9) Includes pupils registered with other providers and in further education colleges. Prior to 2010 includes dual subsidiary registered pupils.
(10) Includes direct grant nursery schools.
Table 1D
ACADEMIES
PUPILS WITH SPECIAL EDUCATIONAL NEEDS (SEN) (1)(2)
January 2012 England
Number on roll
Pupils with statements of SEN
Pupils with SEN - School Action
Pupils with SEN - School
Action Plus Total pupils with SEN
Number
Incidence
(%)(3) Number
Incidence
(%)(3) Number
Incidence
(%)(3) Number
Incidence (%)(3)
Primary converter academy 109,845 1,450 1.3 11,130 10.1 6,110 5.6 18,690 17.0
Sponsor-led primary academy 1,670 15 1.0 270 16.3 135 8.1 425 25.4
Primary free school 1,530 x x 105 7.0 75 4.8 180 11.9
Total primary academies 113,040 1,465 1.3 11,505 10.2 6,320 5.6 19,295 17.1
Secondary converter academy 938,500 16,150 1.7 96,825 10.3 46,925 5.0 159,900 17.0
Sponsor-led secondary academy 308,995 6,620 2.1 48,010 15.5 26,260 8.5 80,890 26.2
Secondary free school 2,375 25 1.1 165 7.0 60 2.4 250 10.5
Total secondary academies 1,249,865 22,795 1.8 145,000 11.6 73,245 5.9 241,045 19.3
Special converter academies 1,795 1,790 99.6 0 0.0 10 0.4 1,795 100.0
Source: School Census
1. Includes pupils with a statement of special educational needs, at School Action and School Action Plus. 2. Includes pupils who are sole or dual main registrations.
x - 1 or 2 pupils or a percentage based on 1 or 2 pupils.
Table 2
EDUCATION ARRANGEMENTS, ASSESSMENT AND PLACEMENT OF CHILDREN FOR WHOM LOCAL AUTHORITIES MAINTAIN A STATEMENT OF SPECIAL EDUCATIONAL NEEDS (SEN)
England
Children with statements in January 2012 Number of
children
Total number of children with statements
(a) Under 5 years of age 10,415
(b) Aged 5-10 82,360
(c) Aged 11-15 115,990
(d) Aged 16-19 21,390
Total of (a) to (d) 230,155
Total number of children with statements receiving provision in:
(a) non-maintained early years settings in the private and voluntary sector 900 (b) resourced provision in maintained mainstream schools 7,965 (c) SEN units in maintained mainstream schools 6,025 (d) maintained mainstream schools (including foundation schools) 89,900 (e) maintained special schools (including foundation schools) 85,630
(f) non-maintained special schools 3,315
(g) independent special schools 7,860
(h) other independent schools 2,075
(i) hospital schools (including foundation schools) 135
(j) pupil referral units 1,625
(k) academies 19,880
(l) special academies 1,635
Total of (a) to (l) 226,950
Total number of children with statements educated other than in school
(a) pupils permanently excluded and not yet placed elsewhere 35 (b) other arrangements made by the Local Authority 985
(c) other arrangements made by the parents 1,435
(d) awaiting provision 750
Total of (a) to (d) 3,205
Assessment and placement of children with new statements during 2011 Number of children
Children for whom statements were made for the first time during the calendar year 2011
(a) Under 5 years of age 7,610
(b) Aged 5-10 13,295
(c) Aged 11-15 7,040
(d) Aged 16-19 245
Total of (a) to (d) 28,190
Children for whom statements were newly made in 2011 placed in:
(a) non-maintained early years settings in the private and voluntary sector 730 (b) resourced provision in maintained mainstream schools 920
(c) SEN units in maintained mainstream schools 870
(d) maintained mainstream schools (including foundation schools) 16,050 (e) maintained special schools (including foundation schools) 6,225
(f) non-maintained special schools 155
(g) independent special schools 530
(h) other independent schools 205
(i) hospital schools (including foundation schools) 10
(j) pupil referral units 390
(k) academies 1,440
(l) special academies 75
Total of (a) to (l) 27,600
Children for whom statements were newly made in 2011 and educated other than in school:
(a) pupils permanently excluded and not yet placed elsewhere 10 (b) other arrangements made by the Local Authority 165
(c) other arrangements made by the parents 140
(d) awaiting provision 270
Total of (a) to (d) 590
Children assessed under Section 323 of the Education Act 1996 during the calendar year 2011 for
whom no statement was issued 880
Total children assessed for SEN during 2011 29,070
Children with statements made prior to 1 January 2011 who transferred during 2011:
(a) from mainstream schools to academies, special or independent schools 6,180 (b) from academies, special or independent schools to mainstream schools 910
Children whose statements have been reviewed and discontinued in 2011:
(a) transferred to another Local Authority 4,330
(b) special needs are being met without a statement 730
(c) other 465
Total of (a) to (c) 5,525
Children whose statements have been discontinued in the calendar year 2011 as they have left school
(aged 16 and over) 23,360
Source: SEN 2 Survey 2012
Table 3A
ASSESSMENT AND PLACEMENT OF CHILDREN WITH NEW STATEMENTS OF SPECIAL EDUCATIONAL NEEDS (SEN)
2007-2011 England
2007 2008 2009 2010 2011
Number % Number % Number % Number % Number %
Total children for whom a statement was made for the first time in calendar
year 23,515 100.0 25,765 100.0 26,495 100.0 25,885 100.0 28,190 100.0
Placement in:
Non-maintained early years settings in the private and voluntary sector 680 2.9 680 2.6 710 2.7 605 2.3 730 2.6
Resourced provision in maintained mainstream schools 845 3.6 905 3.5 925 3.5 1,000 3.9 920 3.3
SEN units in maintained mainstream schools 880 3.8 845 3.3 795 3.0 815 3.1 870 3.1
Maintained mainstream schools (including foundation schools) 14,430 61.4 16,035 62.2 16,450 62.1 16,125 62.3 16,050 56.9
Maintained special schools (including foundation schools) 5,125 21.8 5,425 21.1 5,650 21.3 5,325 20.6 6,225 22.1
Non-maintained special schools 90 0.4 135 0.5 100 0.4 100 0.4 155 0.6
Independent special schools 425 1.8 475 1.9 500 1.9 470 1.8 530 1.9
Other independent schools 140 0.6 180 0.7 215 0.8 230 0.9 205 0.7
Hospital schools 20 0.1 25 0.1 30 0.1 35 0.1 10 0.0
Pupil referral units 315 1.3 370 1.4 345 1.3 375 1.4 390 1.4
Academies 110 0.5 175 0.7 300 1.1 355 1.4 1,440 5.1
Special Academies .. .. .. .. .. .. .. .. 75 0.3
Pupils permanently excluded and not yet placed elsewhere 5 0.0 10 0.0 20 0.1 5 0.0 10 0.0
Other arrangements made by the Local Authority 125 0.5 175 0.7 150 0.6 150 0.6 165 0.6
Other arrangements made by the parents 115 0.5 110 0.4 145 0.5 130 0.5 140 0.5
Awaiting provision 205 0.9 230 0.9 160 0.6 175 0.7 270 1.0
Children assessed during the calendar year for whom no statement was issued 1,275 . 755 . 1,060 . 985 . 880 .
Source: SEN 2 surveys 2008 - 2012
. Not applicable. .. Not available.
Table 3B
PLACEMENT OF CHILDREN WITH A STATEMENT MAINTAINED BY THE LOCAL AUTHORITY
2008 - 2012 England
2008 2009 2010 2011 2012
Number % Number % Number % Number % Number %
Total number of children for whom the authorities maintain a statement 230,635 100.0 228,895 100.0 228,220 100.0 229,015 100.0 230,155 100.0
Placement in:
Non-maintained early years settings in the private and voluntary sector 820 0.4 895 0.4 940 0.4 770 0.3 900 0.4
Resourced provision in maintained mainstream schools 9,075 3.9 9,040 3.9 8,765 3.8 8,925 3.9 7,965 3.5
SEN units in maintained mainstream schools 7,820 3.4 7,150 3.1 6,935 3.0 6,565 2.9 6,025 2.6
Maintained mainstream schools (including foundation schools) 111,210 48.2 107,645 47.0 105,195 46.1 102,375 44.7 89,900 39.1
Maintained special schools (including foundation schools) 82,465 35.8 83,825 36.6 84,820 37.2 86,105 37.6 85,630 37.2
Non-maintained special schools 3,585 1.6 3,640 1.6 3,485 1.5 3,380 1.5 3,315 1.4
Independent special schools 6,620 2.9 6,800 3.0 7,345 3.2 7,660 3.3 7,860 3.4
Other independent schools 1,540 0.7 1,870 0.8 1,945 0.9 2,180 1.0 2,075 0.9
Hospital schools (including foundation schools) 130 0.1 130 0.1 135 0.1 150 0.1 135 0.1
Pupil Referral Units 2,035 0.9 1,865 0.8 1,705 0.7 1,665 0.7 1,625 0.7
Academies 1,695 0.7 2,480 1.1 3,640 1.6 6,080 2.7 19,880 8.6
Special Academies .. .. .. .. .. .. .. .. 1,635 0.7
Total number of pupils with statements educated other than in school:
Pupils permanently excluded and not yet placed elsewhere 115 0.0 80 0.0 75 0.0 70 0.0 35 0.0
Other arrangements made by the Local Authority 1,370 0.6 1,405 0.6 1,175 0.5 1,050 0.5 985 0.4
Other arrangements made by the parents 1,320 0.6 1,350 0.6 1,355 0.6 1,355 0.6 1,435 0.6
Awaiting provision 835 0.4 725 0.3 700 0.3 690 0.3 750 0.3
Source: SEN 2 Surveys 2008 - 2012
.. Not available.
Table 4A
STATE-FUNDED PRIMARY SCHOOLS (1)(2):
NUMBER OF SCHOOLS BY PERCENTAGE OF PUPILS WITH SPECIAL EDUCATIONAL NEEDS (SEN) (3)(4)
January 2012 By region in England
Pupils with statements of SEN
Up to 2% 2% up to 5% 5% up to 10% 10% and above
Total number of schools Number of
schools % (5)
Number of schools % (5)
Number of schools % (5)
Number of schools % (5)
England 12,822 76.2 3,399 20.2 522 3.1 75 0.4 16,818
North East 730 83.1 127 14.5 17 1.9 4 0.5 878
North West 1,923 78.5 445 18.2 73 3.0 10 0.4 2,451
Yorkshire and the Humber 1,460 80.6 304 16.8 46 2.5 2 0.1 1,812
East Midlands 1,290 78.7 295 18.0 47 2.9 7 0.4 1,639
West Midlands 1,422 79.8 324 18.2 32 1.8 5 0.3 1,783
East of England 1,326 66.3 563 28.2 102 5.1 8 0.4 1,999
London 1,273 71.5 440 24.7 57 3.2 11 0.6 1,781
Inner London 442 64.1 222 32.2 22 3.2 4 0.6 690
Outer London 831 76.2 218 20.0 35 3.2 7 0.6 1,091
South East 2,062 79.1 453 17.4 78 3.0 15 0.6 2,608
South West 1,336 71.6 448 24.0 70 3.7 13 0.7 1,867
Pupils with SEN without statements (6)
Up to 5% 5% up to 25% 25% up to 35% 35% up to 50% 50% and above
Total number of schools Number of
schools % (5)
Number of schools % (5)
Number of schools % (5)
Number of schools % (5)
Number of schools % (5)
England 451 2.7 13,798 82.0 2,066 12.3 460 2.7 43 0.3 16,818
North East 26 3.0 643 73.2 156 17.8 50 5.7 3 0.3 878
North West 81 3.3 1,987 81.1 320 13.1 59 2.4 4 0.2 2,451
Yorkshire and the Humber 53 2.9 1,507 83.2 195 10.8 54 3.0 3 0.2 1,812
East Midlands 64 3.9 1,378 84.1 158 9.6 38 2.3 1 0.1 1,639
West Midlands 31 1.7 1,494 83.8 208 11.7 46 2.6 4 0.2 1,783
East of England 61 3.1 1,673 83.7 217 10.9 42 2.1 6 0.3 1,999
London 25 1.4 1,454 81.6 269 15.1 31 1.7 2 0.1 1,781
Inner London 6 0.9 544 78.8 128 18.6 11 1.6 1 0.1 690
Outer London 19 1.7 910 83.4 141 12.9 20 1.8 1 0.1 1,091
South East 68 2.6 2,117 81.2 319 12.2 92 3.5 12 0.5 2,608
South West 42 2.2 1,545 82.8 224 12.0 48 2.6 8 0.4 1,867
Source: School Census
(1) Includes middle schools as deemed.
(2) Includes all primary academies, including free schools.
(3) Schools banded by the proportion of school population with SEN. (4) Includes pupils who are sole or dual main registrations.
Table 4B
STATE-FUNDED SECONDARY SCHOOLS (1)(2):
NUMBER OF SCHOOLS BY PERCENTAGE OF PUPILS WITH SPECIAL EDUCATIONAL NEEDS (SEN) (3)(4)
January 2012 By region in England
Pupils with statements of SEN
Up to 2% 2% up to 5% 5% up to 10% 10% and above
Total number of schools Number of
schools % (5)
Number of schools % (5)
Number of schools % (5)
Number of schools % (5)
England 1,920 58.8 1,229 37.6 113 3.5 6 0.2 3,268
North East 111 59.0 69 36.7 8 4.3 0 0.0 188
North West 248 55.5 179 40.0 18 4.0 2 0.4 447
Yorkshire and the Humber 214 68.6 92 29.5 6 1.9 0 0.0 312
East Midlands 162 56.3 113 39.2 13 4.5 0 0.0 288
West Midlands 240 60.6 142 35.9 14 3.5 0 0.0 396
East of England 204 50.1 182 44.7 20 4.9 1 0.2 407
London 232 53.7 181 41.9 18 4.2 1 0.2 432
Inner London 63 40.9 79 51.3 12 7.8 0 0.0 154
Outer London 169 60.8 102 36.7 6 2.2 1 0.4 278
South East 318 66.8 145 30.5 11 2.3 2 0.4 476
South West 191 59.3 126 39.1 5 1.6 0 0.0 322
Pupils with SEN without statements (6)
Up to 5% 5% up to 25% 25% up to 35% 35% up to 50% 50% and above
Total number of schools Number of
schools % (5)
Number of schools % (5)
Number of schools % (5)
Number of schools % (5)
Number of schools % (5)
England 145 4.4 2,374 72.6 550 16.8 169 5.2 30 0.9 3,268
North East 2 1.1 143 76.1 27 14.4 15 8.0 1 0.5 188
North West 20 4.5 336 75.2 74 16.6 15 3.4 2 0.4 447
Yorkshire and the Humber 6 1.9 231 74.0 52 16.7 22 7.1 1 0.3 312
East Midlands 14 4.9 218 75.7 38 13.2 16 5.6 2 0.7 288
West Midlands 19 4.8 283 71.5 70 17.7 20 5.1 4 1.0 396
East of England 17 4.2 321 78.9 58 14.3 10 2.5 1 0.2 407
London 24 5.6 267 61.8 91 21.1 41 9.5 9 2.1 432
Inner London 3 1.9 83 53.9 43 27.9 17 11.0 8 5.2 154
Outer London 21 7.6 184 66.2 48 17.3 24 8.6 1 0.4 278
South East 28 5.9 328 68.9 93 19.5 19 4.0 8 1.7 476
South West 15 4.7 247 76.7 47 14.6 11 3.4 2 0.6 322
Source: School Census
(1) Includes middle schools as deemed.
(2) Includes city technology colleges and all secondary academies, including free schools. Includes all-through schools. (3) Schools banded by the proportion of school population with SEN.
(4) Includes pupils who are sole or dual main registrations.
Table 5A
STATE-FUNDED PRIMARY SCHOOLS (1)(2):
NUMBER OF PUPILS WITH SPECIAL EDUCATIONAL NEEDS (SEN) BY AGE AND GENDER (3)(4)
January 2012 England
All pupils Pupils with SEN without statements Pupils with statements
Boys Girls Total
Boys Girls Total Boys Girls Total
Number of pupils
% of school population (5)
Number of pupils
% of school population (5)
Number of pupils
% of school population (5)
Number of pupils
% of school population (5)
Number of pupils
% of school population (5)
Number of pupils
% of school population (5)
Pupils Aged:
2 and under 19,735 19,605 39,340 575 2.9 265 1.4 840 2.1 15 0.1 15 0.1 35 0.1
3 134,680 130,680 265,360 10,990 8.2 4,970 3.8 15,960 6.0 435 0.3 230 0.2 665 0.3
4 309,515 295,670 605,180 37,155 12.0 17,350 5.9 54,510 9.0 3,315 1.1 1,420 0.5 4,735 0.8
5 301,405 288,160 589,565 60,715 20.1 29,805 10.3 90,520 15.4 4,500 1.5 1,760 0.6 6,260 1.1
6 295,235 282,885 578,120 71,570 24.2 37,270 13.2 108,840 18.8 5,290 1.8 2,085 0.7 7,375 1.3
7 288,330 276,205 564,535 74,190 25.7 40,325 14.6 114,510 20.3 6,280 2.2 2,275 0.8 8,555 1.5
8 279,800 268,135 547,930 74,180 26.5 41,415 15.4 115,595 21.1 6,765 2.4 2,495 0.9 9,260 1.7
9 261,010 250,620 511,630 69,905 26.8 39,930 15.9 109,840 21.5 7,360 2.8 2,615 1.0 9,975 1.9
10 260,225 251,515 511,740 68,625 26.4 41,070 16.3 109,695 21.4 8,240 3.2 2,980 1.2 11,220 2.2
11 1,900 1,500 3,400 525 27.5 265 17.7 790 23.2 325 17.2 120 8.1 450 13.2
12 and above 95 105 200 15 18.1 5 6.6 25 12.0 5 6.4 5 4.7 10 5.5
Total All Ages 2,151,920 2,065,080 4,217,000 468,445 21.8 252,675 12.2 721,120 17.1 42,540 2.0 16,000 0.8 58,535 1.4
Source: School Census
(1) Includes middle schools as deemed.
(2) Includes all primary academies, including free schools. (3) Includes pupils who are sole or dual main registrations. (4) Age as at 31 August 2011.
(5) The number of SEN pupils expressed as a percentage of the total number of pupils of the same age and gender.
Table 5B
STATE-FUNDED SECONDARY SCHOOLS (1)(2):
NUMBER OF PUPILS WITH SPECIAL EDUCATIONAL NEEDS (SEN) BY AGE AND GENDER (3)(4)
January 2012 England
All pupils Pupils with SEN without statements Pupils with statements
Boys Girls Total
Boys Girls Total Boys Girls Total
Number of pupils
% of school population (5)
Number of pupils
% of school population (5)
Number of pupils
% of school population (5)
Number of pupils
% of school population (5)
Number of pupils
% of school population (5)
Number of pupils
% of school population (5)
Pupils Aged:
4 and under 2,350 2,270 4,615 265 11.3 115 5.1 380 8.3 20 0.9 5 0.3 30 0.6
5 1,255 1,240 2,490 295 23.5 135 11.1 430 17.3 20 1.4 10 0.9 30 1.2
6 1,135 1,105 2,240 340 30.0 165 14.7 505 22.5 20 1.9 10 1.1 35 1.5
7 1,090 1,105 2,195 325 29.8 230 20.7 555 25.2 30 2.7 10 0.7 35 1.7
8 1,040 1,000 2,040 315 30.2 190 19.1 505 24.7 30 3.1 10 1.1 45 2.1
9 9,005 8,575 17,580 2,275 25.3 1,335 15.5 3,610 20.5 210 2.3 55 0.6 260 1.5
10 10,995 10,590 21,585 2,705 24.6 1,520 14.4 4,225 19.6 310 2.8 95 0.9 405 1.9
11 270,565 262,090 532,655 70,030 25.9 43,670 16.7 113,705 21.3 7,905 2.9 2,640 1.0 10,545 2.0
12 279,825 270,405 550,230 69,735 24.9 43,195 16.0 112,930 20.5 8,675 3.1 2,900 1.1 11,575 2.1
13 281,810 273,655 555,465 67,210 23.9 42,325 15.5 109,535 19.7 8,705 3.1 3,025 1.1 11,730 2.1
14 287,920 280,575 568,500 66,195 23.0 42,355 15.1 108,550 19.1 9,040 3.1 3,075 1.1 12,115 2.1
15 279,780 272,230 552,010 61,965 22.1 42,430 15.6 104,395 18.9 8,255 3.0 2,915 1.1 11,170 2.0
16 105,680 113,785 219,465 10,410 9.9 8,095 7.1 18,510 8.4 1,930 1.8 770 0.7 2,700 1.2
17 85,170 95,655 180,825 6,765 7.9 5,315 5.6 12,075 6.7 1,090 1.3 415 0.4 1,505 0.8
18 11,525 10,335 21,860 1,115 9.7 865 8.3 1,975 9.0 305 2.6 130 1.2 430 2.0
19+ 530 595 1,125 55 10.0 50 8.4 105 9.2 15 2.4 10 1.3 20 1.9
Total All Ages 1,629,675 1,605,205 3,234,875 360,000 22.1 231,990 14.5 591,985 18.3 46,560 2.9 16,070 1.0 62,630 1.9
Source: School Census
(1) Includes middle schools as deemed.
(2) Includes city technology colleges and secondary academies. Includes all-through schools. (3) Includes pupils who are sole or dual main registrations.
(4) Age as at 31 August 2011.
(5) The number of SEN pupils expressed as a percentage of the total number of pupils of the same age and gender.
Table 5C
SPECIAL SCHOOLS (1):
NUMBER OF PUPILS WITH SPECIAL EDUCATIONAL NEEDS (SEN) BY AGE AND GENDER (2)(3)
January 2012 England
All pupils Pupils with SEN without statements Pupils with statements
Boys Girls Total
Boys Girls Total Boys Girls Total
Number of pupils
% of school population (4)
Number of pupils
% of school population (4)
Number of pupils
% of school population (4)
Number of pupils
% of school population (4)
Number of pupils
% of school population (4)
Number of pupils
% of school population (4)
Pupils Aged:
2 and under 345 215 560 215 61.7 115 52.8 325 58.3 105 31.0 85 40.2 195 34.5
3 1,170 610 1,780 520 44.6 180 29.8 705 39.5 530 45.3 335 55.1 865 48.7
4 2,065 860 2,925 165 8.0 55 6.4 220 7.6 1,895 91.8 805 93.5 2,700 92.3
5 2,365 1,030 3,395 50 2.0 20 2.0 70 2.0 2,315 98.0 1,010 97.9 3,325 97.9
6 2,750 1,085 3,835 30 1.0 15 1.6 45 1.2 2,720 98.9 1,065 98.4 3,785 98.7
7 3,140 1,240 4,380 40 1.3 15 1.1 55 1.2 3,100 98.7 1,225 98.8 4,325 98.7
8 3,535 1,275 4,815 35 1.0 10 0.9 45 0.9 3,500 99.0 1,265 99.1 4,765 99.0
9 3,835 1,395 5,225 35 0.9 10 0.9 45 0.9 3,800 99.1 1,380 99.1 5,180 99.1
10 4,300 1,580 5,880 50 1.1 10 0.7 60 1.0 4,250 98.8 1,570 99.3 5,820 98.9
11 6,270 2,435 8,705 30 0.5 10 0.4 40 0.5 6,235 99.5 2,430 99.6 8,665 99.5
12 6,935 2,560 9,495 35 0.5 15 0.6 55 0.6 6,895 99.4 2,545 99.3 9,440 99.4
13 7,515 2,735 10,250 50 0.6 20 0.8 70 0.7 7,465 99.3 2,710 99.2 10,180 99.3
14 7,895 2,815 10,710 75 1.0 30 1.1 110 1.0 7,815 99.0 2,785 98.9 10,600 99.0
15 7,405 2,850 10,255 50 0.7 55 1.9 105 1.0 7,350 99.3 2,795 98.0 10,145 98.9
16 3,020 1,715 4,740 15 0.4 5 0.3 20 0.4 3,010 99.5 1,710 99.5 4,715 99.5
17 2,705 1,470 4,175 10 0.3 10 0.5 15 0.4 2,695 99.7 1,460 99.3 4,155 99.5
18 2,010 1,150 3,160 5 0.3 x x 5 0.2 2,005 99.7 1,145 99.7 3,150 99.7
19+ 180 115 295 5 2.2 5 2.6 5 2.4 130 73.7 80 69.6 210 72.1
Total All Ages 67,440 27,135 94,580 1,410 2.1 585 2.2 1,995 2.1 65,820 97.6 26,395 97.3 92,220 97.5
Source: School Census
(1) Includes maintained and non-maintained special schools and special academies. Excludes general hospital schools. (2) Includes pupils who are sole or dual main registrations.
(3) Age as at 31 August 2011.
(4) The number of SEN pupils expressed as a percentage of the total number of pupils of the same age and gender.
x 1 or 2 pupils, or a percentage based on 1 or 2 pupils.
Table 5D
STATE-FUNDED PRIMARY, STATE-FUNDED SECONDARY AND SPECIAL SCHOOLS (1)(2)(3)(4): NUMBER OF PUPILS WITH SPECIAL EDUCATIONAL NEEDS (SEN) BY AGE AND GENDER (5)(6)
January 2012 England
All pupils Pupils with SEN without statements Pupils with statements
Boys Girls Total
Boys Girls Total Boys Girls Total
Number of pupils
% of school population (7)
Number of pupils
% of school population (7)
Number of pupils
% of school population (7)
Number of pupils
% of school population (7)
Number of pupils
% of school population (7)
Number of pupils
% of school population (7)
Pupils Aged:
2 and under 20,215 19,965 40,180 795 3.9 380 1.9 1,175 2.9 125 0.6 100 0.5 225 0.6
3 136,640 132,055 268,700 11,565 8.5 5,175 3.9 16,745 6.2 970 0.7 565 0.4 1,535 0.6
4 313,000 297,885 610,885 37,525 12.0 17,495 5.9 55,020 9.0 5,230 1.7 2,230 0.7 7,460 1.2
5 305,020 290,430 595,450 61,060 20.0 29,960 10.3 91,020 15.3 6,830 2.2 2,780 1.0 9,615 1.6
6 299,115 285,075 584,190 71,935 24.0 37,450 13.1 109,390 18.7 8,030 2.7 3,160 1.1 11,195 1.9
7 292,560 278,550 571,110 74,555 25.5 40,565 14.6 115,120 20.2 9,405 3.2 3,510 1.3 12,915 2.3
8 284,375 270,415 554,785 74,525 26.2 41,615 15.4 116,145 20.9 10,300 3.6 3,770 1.4 14,070 2.5
9 273,845 260,590 534,440 72,215 26.4 41,275 15.8 113,495 21.2 11,370 4.2 4,045 1.6 15,415 2.9
10 275,520 263,685 539,205 71,375 25.9 42,605 16.2 113,980 21.1 12,795 4.6 4,645 1.8 17,440 3.2
11 278,735 266,025 544,760 70,585 25.3 43,945 16.5 114,530 21.0 14,470 5.2 5,190 2.0 19,660 3.6
12 286,810 273,020 559,830 69,780 24.3 43,215 15.8 112,995 20.2 15,575 5.4 5,450 2.0 21,025 3.8
13 289,340 276,410 565,745 67,260 23.2 42,345 15.3 109,610 19.4 16,175 5.6 5,735 2.1 21,910 3.9
14 295,835 283,410 579,240 66,275 22.4 42,390 15.0 108,665 18.8 16,855 5.7 5,860 2.1 22,715 3.9
15 287,195 275,095 562,290 62,020 21.6 42,485 15.4 104,510 18.6 15,610 5.4 5,705 2.1 21,315 3.8
16 108,705 115,500 224,205 10,425 9.6 8,100 7.0 18,525 8.3 4,940 4.5 2,480 2.1 7,420 3.3
17 87,875 97,125 185,000 6,770 7.7 5,320 5.5 12,090 6.5 3,785 4.3 1,875 1.9 5,660 3.1
18 13,535 11,485 25,020 1,120 8.3 865 7.5 1,985 7.9 2,310 17.1 1,275 11.1 3,585 14.3
19+ 710 710 1,420 55 8.0 55 7.5 110 7.8 145 20.4 90 12.4 235 16.4
Total All Ages 3,849,035 3,697,420 7,546,455 829,850 21.6 485,250 13.1 1,315,100 17.4 154,920 4.0 58,465 1.6 213,385 2.8
Source: School Census
(1) Includes middle schools as deemed.
(2) Includes all primary academies, including free schools.
(3) Includes city technology colleges and all secondary academies, including free schools. Includes all-through schools. (4) Includes maintained and non-maintained special schools and special academies. Excludes general hospital schools. (5) Includes pupils who are sole or dual main registrations.
(6) Age as at 31 August 2011.
(7) The number of SEN pupils expressed as a percentage of the total number of pupils of the same age and gender.
Table 6A
STATE-FUNDED PRIMARY SCHOOLS (1)(2):
NUMBER OF PUPILS WITH SPECIAL EDUCATIONAL NEEDS (SEN) BY NATIONAL CURRICULUM YEAR GROUP (3)
January 2012 England
Total number of pupils
Pupils with statements of SEN
Pupils with SEN without statements
Pupils at School Action Pupils at School Action Plus Total number of pupils with SEN without statements
Number % (4) Number % (4) Number % (4) Number % (4)
National Curriculum Year Group:
Nursery years 1 and 2 304,530 755 0.2 8,000 2.6 8,870 2.9 16,870 5.5
Reception 605,995 4,985 0.8 29,085 4.8 25,575 4.2 54,660 9.0
1 589,430 6,275 1.1 56,675 9.6 33,810 5.7 90,485 15.4
2 578,230 7,430 1.3 70,305 12.2 38,605 6.7 108,905 18.8
3 564,475 8,550 1.5 73,330 13.0 41,130 7.3 114,460 20.3
4 547,920 9,250 1.7 72,805 13.3 42,780 7.8 115,585 21.1
5 511,730 9,985 2.0 68,825 13.4 41,055 8.0 109,880 21.5
6 511,835 11,250 2.2 68,120 13.3 41,585 8.1 109,705 21.4
7 and above 2,805 55 1.9 345 12.2 225 8.1 570 20.3
Total (5) 4,217,000 58,535 1.4 447,485 10.6 273,635 6.5 721,120 17.1
Source: School Census
(1) Includes middle schools as deemed.
(2) Includes all primary academies, including free schools. (3) Includes pupils who are sole or dual main registrations.
(4) Number of pupils in each SEN provision expressed as a percentage of total pupils according to national curriculum year group. (5) Includes pupils who do not follow the National Curriculum.
Table 6B
STATE-FUNDED SECONDARY SCHOOLS (1)(2):
NUMBER OF PUPILS WITH SPECIAL EDUCATIONAL NEEDS (SEN) BY NATIONAL CURRICULUM YEAR GROUP (3)
January 2012 England
Total number of pupils
Pupils with statements of SEN
Pupils with SEN without statements
Pupils at School Action Pupils at School Action Plus Total number of pupils with SEN without statements
Number % (4) Number % (4) Number % (4) Number % (4)
National Curriculum Year Group:
Nursery, Reception and 1 to 4 13,580 170 1.3 1,470 10.8 905 6.7 2,375 17.5
5 17,610 275 1.6 2,325 13.2 1,295 7.4 3,620 20.5
6 21,520 420 1.9 2,745 12.8 1,490 6.9 4,235 19.7
7 533,525 10,935 2.0 75,725 14.2 38,235 7.2 113,960 21.4
8 550,430 11,605 2.1 74,650 13.6 38,285 7.0 112,935 20.5
9 556,085 11,765 2.1 71,735 12.9 38,005 6.8 109,740 19.7
10 569,710 12,150 2.1 70,530 12.4 38,220 6.7 108,750 19.1
11 551,800 11,185 2.0 68,555 12.4 35,840 6.5 104,395 18.9
12 and above 420,570 4,080 1.0 23,725 5.6 8,260 2.0 31,985 7.6
Total (5) 3,234,875 62,630 1.9 391,455 12.1 200,535 6.2 591,985 18.3
Source: School Census
(1) Includes middle schools as deemed.
(2) Includes city technology colleges and all secondary academies, including free schools. Includes all-through schools. (3) Includes pupils who are sole or dual main registrations.
(4) Number of pupils in each SEN provision expressed as a percentage of total pupils according to national curriculum year group. (5) Includes pupils who do not follow the National Curriculum.
Table 6C
SPECIAL SCHOOLS (1):
NUMBER OF PUPILS WITH SPECIAL EDUCATIONAL NEEDS (SEN) BY NATIONAL CURRICULUM YEAR GROUP (2)
January 2012 England
Total number of pupils
Pupils with statements of SEN
Pupils with SEN without statements
Pupils at School Action Pupils at School Action Plus
Total number of pupils with SEN without
statements
Number % (3) Number % (3) Number % (3) Number % (3)
National Curriculum Year Group:
Nursery years 1 and 2 2,320 1,065 45.8 115 5.0 890 38.4 1,005 43.3
Reception 2,930 2,695 92.0 10 0.4 220 7.5 230 7.9
1 3,445 3,375 97.9 10 0.2 60 1.8 70 2.0
2 3,790 3,745 98.7 x x 45 1.1 45 1.2
3 4,350 4,295 98.7 5 0.1 45 1.1 55 1.2
4 4,730 4,680 99.0 5 0.1 45 0.9 50 1.0
5 5,145 5,100 99.1 x x 40 0.8 45 0.8
6 5,805 5,745 98.9 5 0.1 55 1.0 60 1.0
7 8,700 8,655 99.5 x x 40 0.5 45 0.5
8 9,340 9,285 99.4 5 0.0 45 0.5 50 0.5
9 10,200 10,125 99.3 x x 70 0.7 70 0.7
10 10,625 10,515 99.0 5 0.0 100 1.0 105 1.0
11 10,160 10,050 98.9 x x 105 1.0 105 1.0
12 and above 11,590 11,545 99.6 5 0.0 35 0.3 40 0.3
NC not followed (4) 1,440 1,340 92.9 x x 25 1.7 25 1.7
Total 94,580 92,220 97.5 170 0.2 1,825 1.9 1,995 2.1
Source: School Census
(1) Includes maintained and non maintained special schools and special academies. Excludes general hospital schools. (2) Includes pupils who are sole or dual main registrations.
(3) Number of pupils in each SEN provision expressed as a percentage of total pupils according to national curriculum year group. (4) Pupils who do not follow the National Curriculum.
x 1 or 2 pupils, or a percentage based on 1 or 2 pupils.
Table 6D
STATE-FUNDED PRIMARY, STATE-FUNDED SECONDARY AND SPECIAL SCHOOLS (1)(2)(3)(4):
NUMBER OF PUPILS WITH SPECIAL EDUCATIONAL NEEDS (SEN) BY NATIONAL CURRICULUM YEAR GROUP (5)
January 2012 England
Total number of pupils
Pupils with statements of SEN
Pupils with SEN without statements
Pupils at School Action Pupils at School Action Plus
Total number of pupils with SEN without
statements
Number % (6) Number % (6) Number % (6) Number % (6)
National Curriculum Year Group:
Nursery years 1 and 2 308,720 1,825 0.6 8,175 2.6 9,800 3.2 17,975 5.8
Reception 611,670 7,705 1.3 29,240 4.8 25,935 4.2 55,175 9.0
1 595,375 9,680 1.6 56,950 9.6 34,040 5.7 90,990 15.3
2 584,250 11,200 1.9 70,630 12.1 38,825 6.6 109,455 18.7
3 571,020 12,880 2.3 73,690 12.9 41,375 7.2 115,070 20.2
4 554,685 13,975 2.5 73,130 13.2 43,005 7.8 116,135 20.9
5 534,490 15,365 2.9 71,150 13.3 42,390 7.9 113,540 21.2
6 539,160 17,415 3.2 70,865 13.1 43,130 8.0 113,995 21.1
7 544,845 19,640 3.6 76,060 14.0 38,495 7.1 114,555 21.0
8 559,860 20,895 3.7 74,655 13.3 38,330 6.8 112,990 20.2
9 566,320 21,895 3.9 71,740 12.7 38,070 6.7 109,810 19.4
10 580,370 22,665 3.9 70,535 12.2 38,325 6.6 108,860 18.8
11 561,985 21,235 3.8 68,555 12.2 35,950 6.4 104,505 18.6
12 and above 432,165 15,625 3.6 23,730 5.5 8,295 1.9 32,025 7.4
NC not followed (7) 1,550 1,385 89.4 x x 25 1.5 25 1.6
Total 7,546,455 213,385 2.8 839,110 11.1 475,995 6.3 1,315,100 17.4
Source: School Census
(1) Includes middle schools as deemed.
(2) Includes all primary academies, including free schools.
(3) Includes city technology colleges and all secondary academies, including free schools. Includes all-through schools. (4) Includes maintained and non-maintained special schools and special academies. Excludes general hospital schools. (5) Includes pupils who are sole or dual main registrations.
(6) Number of pupils in each SEN provision expressed as a percentage of total pupils according to national curriculum year group. (7) Pupils who do not follow the National Curriculum.
x 1 or 2 pupils, or a percentage based on 1 or 2 pupils.