Copyright © 2007, American Society for Microbiology. All Rights Reserved.
Comparative Study of Methods for Detecting Sequence
Compartmentalization in Human Immunodeficiency
Virus Type 1
䌤
Selene Za
´rate,
1* Sergei L. Kosakovsky Pond,
1Paul Shapshak,
2and Simon D. W. Frost
1Department of Pathology, University of California San Diego, La Jolla, California, 92093,1and Department of
Psychiatry and Behavioral Sciences, GeneTeam of the McDonald Foundation of the Department of Pediatrics, and Comprehensive Drug Research Center, University of
Miami Miller School of Medicine, Miami, Florida 331362
Received 16 October 2006/Accepted 26 March 2007
Human immunodeficiency virus (HIV) infects different organs and tissues. During these infection events, subpopulations of HIV type 1 (HIV-1) develop and, if viral trafficking is restricted between subpopulations, the viruses can follow independent evolutionary histories, i.e., become compartmentalized. This phenomenon is usually detected via comparative sequence analysis and has been reported for viruses isolated from the central nervous system (CNS) and the genital tract. Several approaches have been proposed to study the compart-mentalization of HIV sequences, but to date, no rigorous comparison of the most commonly employed methods has been made. In this study, we systematically compared inferences made by six different methods for detecting compartmentalization based on three data sets: (i) a sample of 45 patients with sequences gathered from the CNS, (ii) sequences from the female genital tract of 18 patients, and (iii) a set of simulated sequences. We found that different methods often reached contradictory conclusions. Methods based on the topology of a phylogenetic tree derived from clonal sequences were generally more sensitive in detecting compartmentaliza-tion than those that relied solely upon pairwise genetic distances between sequences. However, as the branch-ing structure in a phylogenetic tree is often uncertain, especially for short, low-diversity, or recombinant sequences, tree-based approaches may need to be modified to take phylogenetic uncertainty into account. Given the frequently discordant predictions of different methods and the strengths and weaknesses of each particular methodology, we recommend that a suite of several approaches be used for reliable inference of compartmen-talized population structure.
Understanding intrapatient human immunodeficiency virus (HIV) dynamics and evolution is crucial to the design of more efficient therapies for infected individuals. However, the pro-cesses shaping viral populations are complex and poorly un-derstood. The evolution of HIV is strongly affected by a num-ber of viral and host factors. During early infection, the virus colonizes different organs within the body and can form some-what separate viral populations, driven to adapt to their par-ticular environments and subjected to different selective pres-sures (22, 44). If trafficking and gene flow between viral subpopulations is significantly restricted, then each subpopu-lation can become genetically distinct from others, i.e., com-partmentalized. Compartmentalization has been defined in dif-ferent ways, for example, as genetic heterogeneity between subpopulations (1), as the result of independent micro-evolu-tion (8), as the result of restricted viral gene flow (39), or as the presence of distinct but phylogenetically related genotypes (43). Various mechanisms can contribute to the compartmen-talization of HIV populations. The high rate of mutation of HIV in vivo (53, 56) can rapidly increase the molecular dis-tance between subpopulations. Differences in selective pres-sures imposed by the immune system and disparities in local
concentrations of antiviral drugs can result in divergent evolu-tion of the virus (58, 61). Furthermore, compartmentalized viral populations have been shown to possess distinct pheno-typic characteristics, such as cellular tropism (68), drug resis-tance (58, 64, 69), and level of pathogenesis (14).
HIV type 1 (HIV-1) populations isolated from the genital tract in both men and women have been reported as compart-mentalized (12, 29, 43, 45, 47, 48, 65, 73) when compared to the viruses isolated from the blood or lymphoid tissue. Since the most common route of HIV transmission worldwide is genital exposure (52), the study of HIV populations replicating in the genital tract will help us develop strategies to prevent trans-mission. Several studies reported that the rate of transmission via genital exposure is related to the plasma viral load and the CD4⫹cell count in the source, as well as to the stage of the infection (21, 49, 71), suggesting a role for the immune system in the transmission and evolution of HIV populations replicat-ing in the genital tract. Moreover, differences in divergence and variability of the sequences (15), pattern of drug resistance (58), and coreceptor usage (29) have been reported for viruses isolated from the genital tract compared to those obtained from the bloodstream.
Different tissues in the central nervous system (CNS) can harbor distinct viral populations (1, 8, 20, 27, 32, 35, 38, 41, 42, 46, 51, 54, 57, 61, 62, 63, 64, 68, 69, 70). Samples of viral populations are collected either by examining brain tissue from infected individuals post mortem or by drawing samples from
* Corresponding author. Mailing address: Antiviral Research Cen-ter, 150 W Washington St., Ste. 100, San Diego, CA 92103. Phone: (619) 543-4727. Fax: (619) 543-5094. E-mail: [email protected].
䌤Published ahead of print on 11 April 2007.
6643
on November 8, 2019 by guest
http://jvi.asm.org/
the cerebrospinal fluid (CSF) in HIV-positive patients. The CNS offers a unique environment for HIV replication, because the presence of the brain barrier (BBB) and the blood-CSF barrier restricts viral trafficking between the bloodstream and the CNS, giving rise to at least two segregated HIV pop-ulations. In addition, antiretroviral drugs have different levels of permeability through the BBB and the blood-CSF barrier that largely depend on their biochemical characteristics, in-cluding lipo-solubility and molecular weight (16). For example, some nucleoside analogs can cross the BBB and hamper the replication of HIV in the CNS, whereas protease inhibitors are pumped out by P-glycoproteins present in the BBB (30) and their ability to reach the viruses replicating in the CNS may be impaired. However, in both cases suboptimal inhibitor concen-trations are attained. Furthermore, because the immune re-sponse in the CNS includes microglial and T cells as well as macrophage/monocytes (31, 72), changes in cellular tropism of the virus from CCR5 to CRCX4 receptors can confer a selec-tive advantage. Such shifts in receptor usage have been corre-lated with the rise of neurovirulent viruses in the CNS and development of AIDS-dementia complex (4, 13, 35, 51, 62, 68). Regrettably, analytical methods used to evaluate the degree of compartmentalization among viral populations lack consis-tency in rigor and selection of procedure across studies. In some cases, the mere observation that sequences obtained from the same compartment clustered together in a phyloge-netic tree has been interpreted as evidence of compartmental-ization, whereas others have relied upon more formal statisti-cal approaches, such as the Slatkin-Maddison (SM) test (60). To our knowledge, there has been no attempt to compare the performance of different methods available for testing com-partmentalization in HIV sequences and to investigate when and to what degree the methods agree. In this study we exam-ined published HIV sequences isolated from different com-partments within the same patient, focusing on sequences de-rived from the CNS and the female genital tract, and used six previously published methods to detect compartmentalization. For the purposes of our study we divided the methods in two categories: those which used a phylogenetic tree to detect compartmentalization (tree based) and those based on pair-wise genetic distances between viral clones (distance based). Based upon 92 biological data sets obtained from GenBank and 1,500 simulated data sets, we concluded that tree-based methods were more sensitive in detecting compartmentaliza-tion than distance-based methods. However, to guard against false positives due to the uncertainty in phylogenetic recon-struction, distance-based methods should also be taken into account.
MATERIALS AND METHODS
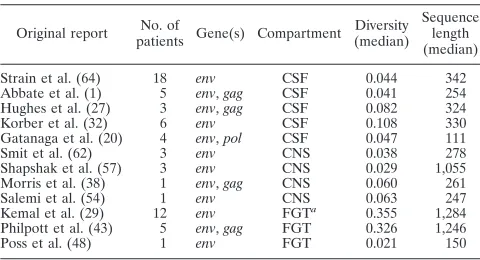
Sequence data.We downloaded all available (as of February 2006) HIV sequences isolated from the CNS and the female genital tract from GenBank. This sample contained 3,236 sequences from the CNS and 1,393 from the female genital tract. As a selection criterion for inclusion in this study, we required that sequences from at least two compartments with at least five sequences each be available from the same patient. Samples from 62 patients met these criteria and were included in the analyses. Aligned sequences and phylogenetic trees used in this study can be downloaded from http://www.hyphy.org/pubs/zarate_comp.tgz. The number of patients used in this work, the sources of the virus, the viral genes sequenced, and the medians of the diversity and of the length of the alignment, organized by publication, are shown in Table 1.
CNS data.We downloaded viral clones from 44 patients (1, 20, 27, 32, 38, 54, 57, 62, 64). Of those, 42 had developed some level of neuropsychiatric and/or neuropathologic diagnosis specifically related to HIV infection. Thirty-one pa-tients had received some antiretroviral treatment, and 10 of those were on therapy at the time of death or sampling. A total of 1,958 sequences from CNS and blood (with a median of 11 and a range of 5 to 27 sequences per patient per compartment) were grouped in 62 data sets by the source patient and the gene or gene region sequenced.
Female genital tract data.A total of 584 sequences (median of 7 and range of 5 to 11 sequences per patient per compartment) derived from 18 patients (29, 43, 48) were grouped in a total of 30 data sets by the source patient and the gene sequenced. Fourteen women included in this study were clinically asymptomatic, in 14 cases the infection risk was genital exposure, and 4 subjects had been treated with antiretrovirals.
Data analyses.We utilized three tree-based methods and three distance-based methods, briefly described below.
(i) Slatkin-Maddison test.The SM test (tree based) (60) determines the minimum number of migration events between the separated populations con-sistent with the structure of the reconstructed phylogenetic tree. Statistical sup-port is based on the number of migration events that would be expected in a randomly structured population, derived by permuting sequences between com-partments.
(ii) Simmonds association index.The Simmonds association index (AI; tree based) (70) assesses the degree of population structure in the phylogenetic tree by weighting the contribution of each internal node based on its depth in the tree (progressively less for nodes near the root) and evaluating the significance of the observed value using a bootstrap sample both over the structure of the population and the shape of the phylogenetic tree.
(iii) Correlation coefficients.Correlation coefficients (r,rb; tree based) (11) are
a way to correlate distances between two sequences in a phylogenetic tree with the information about whether or not they were isolated from the same com-partment. The distance between two sequences can be either the number of tree branches separating the sequences (rb) or the cumulative genetic distance
be-tween the sequences (r). To assess whether the computed coefficient was statis-tically significant, we estimated the distribution of these coefficients by permuting sequences between compartments. APvalue of 0.05 or less was considered statistically significant.
(iv) Wright’s measure of population subdivision.Wright’s measure of popu-lation subdivision (FST; distance based) (24, 25, 59) compares the mean pairwise genetic distance between two sequences sampled from different compartments to the mean distance between sequences sampled from the same compartment. Statistical significance is derived via a population-structure randomization test. We calculated this score using three different approaches, two estimates ofFST (25, 59) and an estimate ofKST(24), and did not observe any differences in the statistical significance of the results. For our analyses, the distance matrices were calculated using the TN93 genetic distance (66).
[image:2.585.301.541.88.218.2](v) Nearest-neighbor statistic.The nearest-neighbor statistic (Snn; distance based) (26) is a measure of how often the nearest neighbors of each sequence were isolated from the same or different compartments. The distance between sequences is measured using the TN93 metric (66) (not the number of sites in which two sequences differ, as in the original description).
TABLE 1. Sequences used for comparing compartmentalization detection methods
Original report No. of
patients Gene(s) Compartment
Diversity (median)
Sequence length (median)
Strain et al. (64) 18 env CSF 0.044 342 Abbate et al. (1) 5 env,gag CSF 0.041 254 Hughes et al. (27) 3 env,gag CSF 0.082 324 Korber et al. (32) 6 env CSF 0.108 330 Gatanaga et al. (20) 4 env,pol CSF 0.047 111
Smit et al. (62) 3 env CNS 0.038 278
Shapshak et al. (57) 3 env CNS 0.029 1,055 Morris et al. (38) 1 env,gag CNS 0.060 261 Salemi et al. (54) 1 env CNS 0.063 247 Kemal et al. (29) 12 env FGTa
0.355 1,284 Philpott et al. (43) 5 env,gag FGT 0.326 1,246
Poss et al. (48) 1 env FGT 0.021 150
a
FGT, female genital tract.
on November 8, 2019 by guest
http://jvi.asm.org/
(vi) AMOVA.Analysis of molecular variance (AMOVA; distance based) (18) calculates an association based on the genetic diversity of the sequences between and within compartments. AMOVA is an extension of Wright’sFstatistics, in which the distances are restricted to Euclidean and the variability is calculated from the sum of the squared distances between the sequences.
SM, AI,FST,Snn, and correlation indices tests were reimplemented and run using HyPhy (33). AMOVA was carried out using the package ADE4 (67).
Simulations.Using sequence data simulated with Serial Simcoal (3, 17), we studied the effects of the migration rate and the sample size on the abilities of the methods to detect compartmentalization. Based on two subpopulations with an effective population size of 5,000 each and 15 migration rates ranging from 0.00005 to 0.1 migrations per generation, we drew a random sample of 20 sequences per compartment. One hundred replicates were simulated for a given value of the migration rate. We also ran a series of simulations with the migration rate fixed at 0.0005 migrations per generation and set the sample size at 5, 10, 20, and 50 sequences, with 100 replicates for a fixed sample size. In addition, we ran simulations with a fixed migration rate of 0.0005 migrations per generation drawing a sample of 5 sequences from one compartment and 20 from the other. As a control, we simulated 100 data sets evolved over random trees using the program Seq-Gen (50). The sequences were generated using the substitution model HKY85 (23), equal nucleotide frequencies, and a transition/transversion ratio of 2. These data sets consisted of 40 sequences of 500 nucleotides in length, which were equally divided randomly between two compartments.
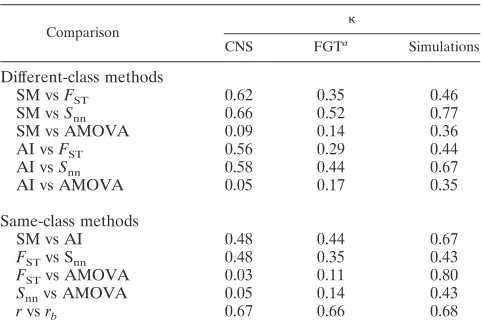
Comparisons between methods.In order to quantify the level of agreement obtained with the different approaches used in this study, we calculated the score (10) for each pair of methods. Briefly, if two procedures are used inde-pendently to produce a dichotomous (yes/no) classification ofNobservations, then ⫽(p0⫺pe)/(1⫺pe), wherep0is the proportion of times the methods
agree andpeestimates the probability that the two independent methods agree
by chance. Iffyyis the proportion ofNcases which both tests rate as “yes,”fnnis
the proportion of those which both methods rate as “no,” andfyn/fnyis the
proportion of discordant tests, thenp0⫽fyy⫹fnnandpe⫽(fyy⫹fyn)(fyy⫹fny)⫹
(fnn⫹fny)(fnn⫹fyn).ranges between⫺1 and 1, with positive values indicating
more agreement than expected by chance. We used a simple qualitative scale (2) to interpret the level of agreement: ⬍0.2, poor; 0.2ⱕ ⬍0.4, fair; 0.4ⱕ ⬍ 0.6, moderate; 0.6ⱕ ⬍0.8, good; 0.8ⱕⱕ1.0, excellent.
RESULTS
We begin by presenting side-by-side comparisons of com-partmentalization classification decisions made by the different methods.
Tree-based versus distance-based methods.For the 62 CNS data sets, SM andFSTclassified 38 data sets as
compartmen-talized and 14 as noncompartmencompartmen-talized. Hence, the SM test andFSTwere in good agreement, based on thescore of 0.62.
When applied to the female genital tract data, both methods agreed in 22/30 cases, finding compartmentalization in 18 data sets and rejecting compartmentalization for 4 data sets. The statistic value of 0.35 indicated fair agreement. When the re-sults from the SM analysis were compared to those obtained with AMOVA, we found poor agreement between the meth-ods. Thescore for the SM test and AMOVA in the CNS was 0.09, and in the genital tract it was 0.14. Meanwhile, the AI and FST comparison yielded scores of 0.56 (CNS, moderate
agreement) and 0.29 (genital tract, fair). For the CNS data, the degrees of agreement between SM or AI andSnnwere similar
to those between SM or AI andFST. However, for the female
genital tract data,Snnhad higher levels of agreement with the
tree-based methods than the other distance methods. Thescores for each pair of methods are shown in Table 2. In general, when comparing methods from different classes, the level of agreement was poor to fair for the female genital tract data sets. However, for theSnndistance-based method,
the level of agreement was moderate. For the CNS data sets, the level of agreement was fair to good when comparing
tree-based methods againstFSTorSnnand poor to fair when
com-paring against AMOVA.
Comparison between same-class methods.For comparisons between methods of the same class, first we compared the SM test with the AI. Both methods are based on measuring the degree of phylogenetic segregation between sequences from different compartments. SM and AI concurred to a moderate extent on both data sets. For the CNS sequences, SM and AI detected compartmentalization in 38 data sets and classified 11 sets as noncompartmentalized ( ⫽0.48). For the genital tract samples, both methods classified 22 data sets as compartmen-talized and only 3 as noncompartmencompartmen-talized ( ⫽0.44).
Second, we compared distance-basedFSTandSnnand found
that they agreed on 51 of the CNS data sets and on 26 of the female genital tract data sets. These results indicate moderate agreement for the CNS ( ⫽0.48) and fair agreement for the female genital tract ( ⫽0.35). When we comparedFSTand
AMOVA, we found poor agreement between the two meth-ods. In the CNS, both methods agreed that 9 of the cases were classified as compartmentalized and 16 were not, yielding a score of 0.03. For the genital tract, six cases were concordantly classified as compartmentalized and nine as not compartmen-talized ( ⫽0.11). Similar poor results were obtained between Snnand AMOVA, withvalues of 0.05 for the CNS and 0.14
for the female genital tract.
The poor agreement observed forFSTandSnnwhen
com-pared with AMOVA can be attributed to the propensity of the AMOVA test to reject compartmentalization (80 of all the analyzed data sets), which in turn raised the level of disagree-ment withFSTandSnn. This phenomenon of observer bias (9)
is known to lowerscores. AMOVA may lack power to detect compartmentalization when the level of sequence divergence is low, as was the case in many of the test cases analyzed here.
[image:3.585.301.542.88.251.2]Effect of branch lengths. One possible cause for disagree-ment between tree-based and distance-based methods is that the former ignore branch length information when computing compartmentalization scores. SM treats the topology as given, and AI performs bootstrapping to incorporate the uncertainty in tree topology, but the actual scoring does not incorporate branch lengths. This can be misleading, because short interior
TABLE 2. Levels of agreement between methods as measured by pairwisescores
Comparison
CNS FGTa
Simulations
Different-class methods
SM vsFST 0.62 0.35 0.46
SM vsSnn 0.66 0.52 0.77
SM vs AMOVA 0.09 0.14 0.36
AI vsFST 0.56 0.29 0.44
AI vsSnn 0.58 0.44 0.67
AI vs AMOVA 0.05 0.17 0.35
Same-class methods
SM vs AI 0.48 0.44 0.67
FSTvs Snn 0.48 0.35 0.43
FSTvs AMOVA 0.03 0.11 0.80
Snnvs AMOVA 0.05 0.14 0.43
rvsrb 0.67 0.66 0.68
aFGT, female genital tract.
on November 8, 2019 by guest
http://jvi.asm.org/
branches cannot be unequivocally resolved and have a low degree of phylogenetic support and, when not taken into con-sideration, can lead to the overestimation of the topological distance (i.e., the degree of segregation) between the se-quences. To investigate possible effects of short branch lengths, we calculated two coefficients which correlated the ordinal variable measuring whether or not two sequences are from the same compartment with either the genetic distance between them in the tree,r, or the number of branches separating the sequences in the tree,rb(11). We found thatrandrbwere in
good agreement when used to classify sequences as compart-mentalized ( ⫽0.67 for CNS and ⫽0.66 for genital tract), suggesting that the inclusion of branch lengths does not sys-tematically alter the classification.
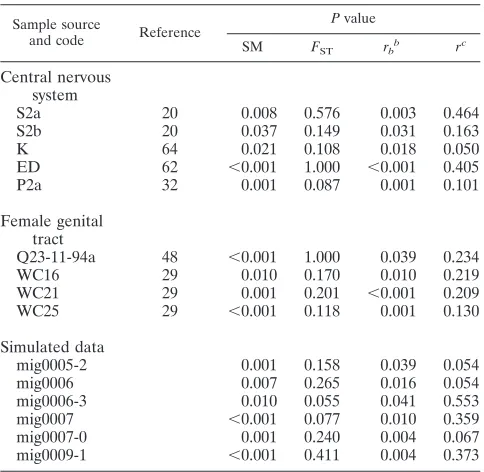
Despite broad agreement between the correlation coeffi-cients, in certain “difficult” cases, when other classifications strongly disagreed, we found discordance between r and rb
(Table 3), suggesting that inclusion of branch lengths can have a strong effect on the conclusions of compartmentalization analyses in certain situations.
Effect of recombination.Recombination is known to occur during HIV infection, and this phenomenon can interfere with the detection of compartmentalization. The rationale behind this is that if the sequences obtained from an infected patient were a product of recombination, this would result in a lower power to detect compartmentalization because the clades of the tree would appear to be mixed and the phylogenetic re-construction would be uncertain. With this in mind, we ana-lyzed all data sets for recombination using a genetic algorithm approach (34). We found evidence of recombination in 36 of
92 data sets, 19 from the CNS and 17 from the female genital tract. Next, we took the alignments and trees of the nonrecom-binant fragments and analyzed each of the fragments sepa-rately for compartmentalization. We show two examples of how recombination can affect compartmentalization detection. We found recombination breakpoints at nucleotides 171 and 215 of the alignments of theenvviral sequences obtained from patients C and J, respectively (64). After analyzing the two fragments of the alignments separately, we found no evidence of compartmentalization in the 5⬘ segment, whereas the 3⬘ section was compartmentalized. The results are shown in Table 4. We stress that it is imperative that recombination screening be a part of careful compartmentalization analyses.
Simulated data.In analyzing simulated data, first we mea-sured the power of all competing methods to detect compart-mentalization as the function of the migration rate between the two compartments. We found that tree-based methods were more powerful in detecting compartmentalization at low mi-gration compared with distance-based AMOVA and FST,
whereasSnnbehaved very similar to SM regardless of being a
[image:4.585.43.285.88.324.2]distance-based method. As shown in Fig. 1, tree-based SM and
TABLE 3. Examples of different results obtained with correlation coefficientsrandrband with SM andFSTa
Sample source
and code Reference
Pvalue
SM FST rb
b
rc
Central nervous system
S2a 20 0.008 0.576 0.003 0.464
S2b 20 0.037 0.149 0.031 0.163
K 64 0.021 0.108 0.018 0.050
ED 62 ⬍0.001 1.000 ⬍0.001 0.405
P2a 32 0.001 0.087 0.001 0.101
Female genital tract
Q23-11-94a 48 ⬍0.001 1.000 0.039 0.234
WC16 29 0.010 0.170 0.010 0.219
WC21 29 0.001 0.201 ⬍0.001 0.209
WC25 29 ⬍0.001 0.118 0.001 0.130
Simulated data
mig0005-2 0.001 0.158 0.039 0.054
mig0006 0.007 0.265 0.016 0.054
mig0006-3 0.010 0.055 0.041 0.553
mig0007 ⬍0.001 0.077 0.010 0.359
mig0007-0 0.001 0.240 0.004 0.067
mig0009-1 ⬍0.001 0.411 0.004 0.373
aThe table showsPvalues obtained from the randomization test. APvalue of
⬍0.05 was considered evidence of compartmentalization. The patient codes are the ones used in the original report. The simulated sequences are named by migration rate and the number of the replicate.
br
[image:4.585.303.542.88.179.2]b, correlation coefficient by number of branches. cr, correlation coefficient by length of branches.
TABLE 4. Examples of the effect of recombination on compartmentalization detectiona
Patient
Pvalue
AI
Pvalue
SM FST r
b
rb c
C 0.460 0.061 86 0.403 0.238
C1–171 0.657 0.442 47 0.600 0.684
C172–339 0.008 0.021 96 0.144 0.069
I 0.108 0.011 99 0.010 0.022
I1–215 0.212 0.120 68 0.290 0.394
I216–342 0.050 0.007 99 0.016 0.001
aThe table showsPvalues obtained from the randomization test. APvalue of
⬍0.05 (for the association index, a value of⬎95) was considered evidence of compartmentalization. Sequences from patients C and I were reported by Strain et al. (64).
br, correlation coefficient by length of branches. cr
b, correlation coefficient by number of branches.
FIG. 1. Compartmentalization on the simulated data sets. The graphic shows the proportion of data sets classified as compartmen-talized plotted against the migration rate (migration events per gen-eration) used to run the simulation. The curve corresponding to each method is specified in the figure.
on November 8, 2019 by guest
http://jvi.asm.org/
[image:4.585.301.543.511.676.2]AI and distance-based Snnwere able to detect
compartmen-talization in at least 80% of the simulated replicates with mi-gration rates not exceeding 0.0007 mimi-grations per generation. FSThad at least an 80 power for migration rates lower than
0.0003. AMOVA performed poorly, only detecting compart-mentalization in 80% of the replicates at migration rates lower than 0.0001, with the power to detect compartmentalization falling quickly after that point. Interestingly,FSTandrbehaved
almost identically, butrb outperformedr when the migration
rate was between 0.0001 and 0.005. This finding suggests that relatively weakly segregated sequences may be better classified using topological structure alone, since mean pairwise dis-tances within and between compartments may be more difficult to distinguish. When the migration rate exceeded 0.0009, all methods experienced a precipitous drop in the proportion of samples classified as compartmentalized. To rule out the pos-sibility that the tree-based methods could show higher power because they are too liberal, i.e., suffer from high rates of false positives, we simulated 100 data replicates using an unstruc-tured population and randomly assigning sequences to two compartments with 20 sequences each. We found that none of the methods detected compartmentalization in any of the 100 replicates (data not shown), suggesting that all six tests are conservative and, hence, unlikely to suffer from a high rate of false positives.
Pairwise comparisons between the methods on simulated data (Table 2) tended to show moderate to good agreement and to exceed the correlations calculated from biological data sets, especially when comparing distance-based AMOVA to
FSTorSnn.
Second, we examined the effect of sample size for a fixed migration rate of 0.0005 migrations per generation. Predict-ably, larger sample sizes increased the detection power of all methods. For example, replicates with 50 sequences per com-partment were consistently classified as comcom-partmentalized by all the methods, whereas those with 20 sequences were cor-rectly classified only by tree-based methods and, lastly, samples with 5 sequences could not be consistently classified by any method (results not shown).
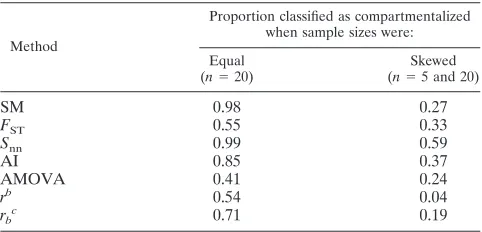
Finally, we evaluated the effect of having very different sam-ple sizes for each compartment by running simulations of two subpopulations at a fixed migration rate of 0.0005 migrations per generation and drawing a sample of 5 sequences from one compartment and 20 from the other. One hundred replicates were run, and the results were compared with those obtained in the simulations where the sample size in both compartments was the same (20 sequences). As shown in Table 5, the pro-portion of samples classified as compartmentalized by all the methods is lower when the sample sizes are very different compared to the ones observed for equal sample sizes, indi-cating that the power to detect compartmentalization of all the methods tested can be affected by having skewed sample sizes.
DISCUSSION
A complete picture of HIV evolution, pathogenesis, and epidemiology must necessarily include a comprehensive char-acterization of how the virus colonizes, adapts to, and migrates between various tissues and organs in the host. To date, most
published molecular studies of HIV have focused on the virus circulating in the bloodstream (19).
When samples from multiple organs or tissues are available, it is useful to investigate whether the viral population is struc-tured and, if this is the case, whether compartment-specific evolutionary pressures contribute to viral diversity and diver-gent evolution within the host. Reliable detection of viral com-partmentalization is nontrivial. Comcom-partmentalization can be transient, and at certain points during infection the virus may be more likely to migrate between the compartments, e.g., when the viral load increases dramatically in one of the com-partments, increasing the chances of migration to other compartments. Possible temporal fluctuation in the degree of compartmentalization can introduce sampling bias and con-found our ability to detect population structure. For example, disease progression and sampling time can both have a strong effect on the structure of sampled populations. In addition, because it is easier to isolate viruses when the viral load is high, viral samples may be biased toward time points in which the compartmentalization signal is weakened.
[image:5.585.301.542.98.214.2]Our analyses of two distinct samples of viral sequences, one coming from the CNS, including brain tissues of primarily late-stage disease or fatal cases, and the other from the genital tract of asymptomatic or stable cases, revealed surprising sim-ilarities between the distributions of compartmentalized and noncompartmentalized patients. The majority of women in the female genital tract cohort did not show lesions or inflamma-tion in the genital tract, whereas most of the patients from whom the CNS data were obtained showed symptoms of neu-rological impairment, as well as neuropathology (inflamma-tion). Hence, compartmentalization of HIV populations is not necessarily confined to any specific stage of disease. Further-more, compartmentalization also may not be related to in-creased pathogenicity of viruses in a particular compartment, since compartmentalization was detected in patients with no lesions (genital tract) or at an advanced stage of pathogenesis (patients that developed neuro-AIDS). However, it should be noted that some suggestive correlations, e.g., between com-partmentalization of HIV sequences in the CNS and dementia (57, 62), have been reported. While it is intuitive to consider that adaptation of HIV to replicate more efficiently in the CNS
TABLE 5. Proportion of simulated data sets classified as compartmentalized when equal and different sample
sizes are drawn from the compartmentsa
Method
Proportion classified as compartmentalized when sample sizes were:
Equal (n⫽20)
Skewed (n⫽5 and 20)
SM 0.98 0.27
FST 0.55 0.33
Snn 0.99 0.59
AI 0.85 0.37
AMOVA 0.41 0.24
rb 0.54 0.04
rbc 0.71 0.19
aA migration rate of 0.0005 migrations per generation was used to simulate
both data sets.
br, correlation coefficient by length of branches. cr
b, correlation coefficient by number of branches.
on November 8, 2019 by guest
http://jvi.asm.org/
may be responsible for neurovirulence and that adaptive mu-tations are more likely to reach high frequencies within a compartmentalized subpopulation, it is yet to be established that the correlation between compartmentalization and de-mentia is present in a significant number of cases. Additionally, a sampling bias towards patients with clinical neuropathologi-cal symptoms may influence such correlational studies.
There is no reason to believe that tissue-specific adaptations in HIV are limited to the CNS. For example, a difference in transmission rates through genital exposure between men and women has been documented (37), a potential effect of viral evolution specific to the male and female genital tracts that includes factors such as virus load of donor and cell and tissue type of recipient. Differences in the patterns of drug resistance in viruses localized in the genital tract and circulating in the blood have also been reported (12). Hence it is possible that certain compartments can act as reservoirs for drug-resistant viruses, especially if optimal concentrations of drugs cannot be attained in those compartments. Suboptimal pharmacokinetics have been reported for both the female genital tract (58) and the CNS (4, 61, 69). Well-documented differences between viruses sampled from different compartments reinforce the need for more comprehensive analyses of within-host viral populations.
Given the difficulty and cost of obtaining representative viral clones from multiple organs and tissues, it is imperative to select the best available methods for subsequent molecular studies. Presently, there is no accepted “gold standard” for detecting compartmentalization in viral populations; hence, the need for a rigorous comparison between cited methodol-ogies is obvious. When fundamentally different approaches arrive at the same conclusion, we may be more confident in the results. Our results showed that different methods to detect compartmentalization frequently disagree. In order to justify giving preference to the conclusions of one method or class of methods, we benchmarked them on a set of simulated se-quence alignments. Overall, we found that the sensitivity of the methods fell as the rate of migration between two compart-ments increased. For a fixed migration rate, up to a certain threshold (in the case of our simulated data this threshold is 0.0007 migrations per generation, but this is not necessarily related to actual migration rates), methods based on examining the shape of the phylogenetic tree (the SM test and AI) had more power to detect compartmentalization than the methods based solely on pairwise genetic distances between sequences (FST and AMOVA). However, tree-based methods can be
sensitive to topological uncertainty or recombination and place too much weight on phylogenetic segregation achieved via poorly supported short interior branches. Phylogenies con-structed from within-host viral samples are often poorly re-solved, and choosing a particular branching order may overes-timate the extent of phylogenetic separation.
Small sample size can also adversely affect power to detect compartmentalization. For instance, when we analyzed simu-lated data with five sequences per compartment, all methods performed poorly. Consequently, we argue that more than five sequences per compartment are needed to gain any confidence in the results and, therefore, future studies should aim to exceed this threshold. Based our simulation results, we con-sider 20 sequences per compartment to be an adequate sample
size, at least for sequences with a level of diversity and length similar to those included in this study. It is also important to analyze similar numbers of clones from each compartment, because highly skewed samples can reduce power and accu-racy of the methods. As the techniques for isolating viral clones and sequencing improve and more sequences per compartments are routinely included in molecular studies, we expect that uncertainty due to small sample sizes will become less common.
Finally, the strategy employed to obtain clonal sequences is critically important. In most previous studies, sequence sam-ples were gathered by isolating the genetic material from a tissue sample, performing PCR, and sequencing multiple clones. In two cases (27, 43), limiting dilution PCR was used, whereby one clone from each PCR was sequenced. Other authors (20, 57, 64) reported pooling multiple PCR products before cloning and sequencing. To what extent the sample is representative of the viral diversity will clearly be affected by the number of independent PCRs and the procedures used for clone selection. For instance, if several samples are taken from the compartment but only one sequence from each aliquot is obtained, the most prevalent sequence is likely to be detected repeatedly without adding new information about the lower-frequency viruses present in the population. On the other hand, if multiple clones are extracted from a sample, we can gain more knowledge in the diversity of the viral population infecting a specific compartment. Ideally, longitudinal samples are preferable so that a dynamic picture of the compartmen-talization status of a patient can be resolved. A universally accepted procedure for sampling a viral population does not exist, and we shall not endeavor to propose one, apart from the general recommendation that one has to choose a sampling method that is best suited to a particular problem and to weigh these requirements against the cost and the amount of work needed to obtain the most appropriate samples.
We examined the level of agreement between methods using the standardstatistic. In general, we found that all methods had better pairwise agreement on simulated data than they did on biological samples. This finding was not unexpected, since simulated data sets were generated under the same simple model of structured populations, whereas within-host evolu-tion is likely to be much more complex and variable between patients. The length and level of diversity of the sequences obtained are likely to play a role in the ability to detect com-partmentalization. Interestingly, the CNS data sets had in gen-eral lower diversity and shorter length than the female genital tract data, and the levels of agreement of the methods were in general higher for the CNS. However, there was no correlation between diversity and the classification of any specific data set as compartmentalized (data not shown). Tree-based and dis-tance-based methods were more congruent with methods from the same class than with those from the other class. The ex-ception to this observation isSnn; while this method behaved
similarly toFSTwhen applied to the CNS data sets, the results
obtained with the female genital tract and the simulated data indicated that it was more sensitive thanFSTand had a power
similar to that of tree-based SM, consistent with the previous suggestion thatSnnis a more powerful statistic than otherFST
metrics (26). However, small sample size combined with high diversity can affect its performance.
on November 8, 2019 by guest
http://jvi.asm.org/
Even though distance-based methods appeared to be less sensitive, positive compartmentalization results based on pair-wise distance alone reflect substantial accumulation of com-partment-specific mutations in different subpopulations. In many cases, however, a few point mutations can drastically alter viral phenotype, for instance, conferring resistance to fusion (36) or to nucleoside (28, 55) and nonnucleoside (40) reverse transcriptase inhibitors. If the populations are segre-gated by only a few key mutations, fixed in one of the popu-lations, there may be insufficient signal for distance-based methods to detect compartmentalization, but because such mutations can result in complete phylogenetic segregation of samples from different compartments, tree-based methods are able to detect population structure with confidence.
Other methods to detect segregation and differentiation be-tween two subpopulations exist and have been employed in the study of population dynamics of various organisms. For in-stance, MIGRATE (5, 7) can be used to infer population parameters such as effective population size and migration rates, while LAMARC (6) can also incorporate recombination. In this study we focused on the analysis of those methods that have been applied to the study of intrapatient compartmental-ization of HIV, but a further investigation of alternative tech-niques may prove fruitful.
In summary, we observed that many published samples that were reported as compartmentalized or not compartmental-ized might have been classified differently using an alternative method. In light of this finding, we espouse a method consen-sus approach, where all available tools are used to classify a given sample. When discordant results are obtained, further analysis, or additional sampling, may be recommended. Screening for recombination and evaluating different substitu-tion models can also help to discern some of the contradic-tions. If a reliable phylogenetic tree (with well-supported in-ternal branches) can be inferred for an entire sample, then tree-based methods such as the SM test or association index appear to be preferable to distance-based methods (FSTand
AMOVA), due to better power to detect stabilizing selection within compartments. The combined use of different methods will result in a more reliable determination of intrapatient viral compartmentalization status, which is required for a better understanding of virus infection dynamics and pathogenesis as well as molecular epidemiology.
ACKNOWLEDGMENTS
This research was supported in part by the National Institutes of Health (AI43638, AI47745, and AI57167), the University of California Universitywide AIDS Research Program (grant number IS02-SD-701), and by a University of California, San Diego Center for AIDS Research/ NIAID Developmental Award to S.D.W.F. and S.L.K.P. (AI36214). In addition, P.S. was supported by NIH grants DA14533, DA12580, and GM056529.
REFERENCES
1.Abbate, I., G. Cappiello, R. Longo, A. Ursitti, A. Spano, S. Calcaterra, F. Dianzani, A. Antinori, and M. R. Capobianchi.2005. Cell membrane pro-teins and quasispecies compartmentalization of CSF and plasma HIV-1 from AIDS patients with neurological disorders. Infect. Genet. Evol.5:247–253. 2.Altman, D.1997. Practical statistics for medical research. Chapman and Hall,
London, England.
3.Anderson, C. N. K., U. Ramakrishnan, Y. L. Chan, and E. A. Hadly.2005. Serial SimCoal: a population genetics model for data from multiple popu-lations and points in time. Bioinformatics21:1733–1734.
4.Antinori, A., A. Cingolani, M. L. Giancola, F. Forbici, A. De Luca, and C. F. Perno.2003. Clinical implications of HIV-1 drug resistance in the neurolog-ical compartment. Scand. J. Infect. Dis.35:41–44.
5.Beerli, P.2006. Comparison of Bayesian and maximum-likelihood inference of population genetic parameters. Bioinformatics22:341–345.
6.Beerli, P., and J. Felsenstein.1999. Maximum-likelihood estimation of mi-gration rates and effective population numbers in two populations using a coalescent approach. Genetics152:763–773.
7.Beerli, P., and J. Felsenstein.2001. Maximum likelihood estimation of a migration matrix and effective population sizes in n subpopulations by using a coalescent approach. Proc. Natl. Acad. Sci. USA98:4563–4568. 8.Burkala, E., J. He, J. West, C. Wood, and C. Petito.2005.
Compartmental-ization of HIV-1 in the central nervous system: role of the choroid plexus. AIDS19:675–684.
9.Byrt, T., J. Bishop, and J. Carlin.1993. Bias, prevalence and kappa. J. Clin. Epidemiol.46:423–429.
10.Cohen, J.1960. A coefficient of agreement for nominal scales. Educ. Psych. Meas.20:37–46.
11.Critchlow, D. E., S. Li, K. Nourijelyani, and D. K. Pearl.2000. Some statis-tical methods for phylogenetic trees with application to HIV disease. Math. Comput. Model.32:69–81.
12.De Pasquale, M. P., A. J. Leigh Brown, S. C. Uvin, J. Allega-Ingersoll, A. M. Caliendo, L. Sutton, S. Donahue, and R. T. D’Aquila.2003. Differences in HIV-1polsequences from female genital tract and blood during antiretro-viral therapy. J. Acquir. Immune Defic. Syndr.34:37–44.
13.Di Stefano, M., L. Monno, J. Fiore, G. Buccoliero, A. Appice, L. Perulli, G. Pastore, and G. Angarano.1998. Neurological disorders during HIV-1 in-fection correlate with viral load in cerebrospinal fluid but not with virus phenotype. AIDS12:737–743.
14.Donaldson, Y. K., P. Simmonds, A. Busuttil, J. E. Bell, J. W. Ironside, R. P. Brettle, and J. R. Robertson.1994. Redistribution of HIV outside the lym-phoid system with onset of AIDS. Lancet343:382–385.
15.Ellerbrock, T. V., J. L. Lennox, K. A. Clancy, R. F. Schinazi, T. C. Wright, M. Pratt-Palmore, T. Evans-Strickfaden, C. Schnell, R. Pai, L. J. Conley, E. E. Parrish-Kohler, T. J. Bush, K. Tatti, and C. E. Hart.2001. Cellular repli-cation of human immunodeficiency virus type 1 occurs in vaginal secretions. J. Infect. Dis.184:28–36.
16.Enting, R. H., R. M. Hoetelmans, J. M. Lange, D. M. Burger, J. H. Beijnen, and P. Portegies.1998. Antiretroviral drugs and the central nervous system. AIDS12:1941–1955.
17.Excoffier, L., J. Novembre, and S. Schneider. 2000. Computer note. SIMCOAL: a general coalescent program for the simulation of molecular data in interconnected populations with arbitrary demography. J. Hered.
91:506–509.
18.Excoffier, L., P. E. Smouse, and J. M. Quattro.1992. Analysis of molecular variance inferred from metric distances among DNA haplotypes: Applica-tion to human mitochondrial DNA restricApplica-tion data. Genetics131:479–491. 19.Frost, S. D. W., M.-J. Dumaurier, S. Wain-Hobson, and A. J. Leigh Brown.
2001. Genetic drift and withhost metapopulation dynamics of HIV-1 in-fection. Proc. Natl. Acad. Sci. USA98:6975–6980.
20.Gatanaga, H., S. Oka, S. Ida, T. Wakabayashi, T. Shioda, and A. Iwamoto.
1999. Active HIV-1 redistribution and replication in the brain with HIV encephalitis. Arch. Virol.144:29–43.
21.Gray, R. H., M. J. Wawer, R. Brookmeyer, N. K. Sewankambo, D. Serwadda, F. Wabwire-Mangen, T. Lutalo, X. Li, T. vanCott, and T. C. Quinn.2001. Probability of HIV-1 transmission per coital act in monogamous, heterosex-ual, HIV-1-discordant couples in Rakai, Uganda. Lancet357:1149–1153. 22.Haase, A. T., K. Henry, M. Zupancic, G. Sedgewick, R. A. Faust, H. Melroe,
W. Cavert, K. Gebhard, K. Staskus, Z. Q. Zhang, P. J. Dailey, H. H. J. Balfour, A. Erice, and A. S. Perelson.1996. Quantitative image analysis of HIV-1 infection in lymphoid tissue. Science274:985–989.
23.Hasegawa, M., H. Kishino, and T. A. Yano.1985. Dating of the human ape splitting by a molecular clock of mitochondrial-DNA. J. Mol. Evol.22:160– 174.
24.Hudson, R., D. Boos, and N. Kaplan.1992. A statistical test for detecting geographic subdivision. Mol. Biol. Evol.9:138–151.
25.Hudson, R., M. Slatkin, and W. P. Maddison.1992. Estimation of levels of gene flow from DNA sequence data. Genetics132:583–589.
26.Hudson, R.2000. A new statistic for detecting genetic differentiation. Ge-netics155:2011–2014.
27.Hughes, E., J. Bell, and P. Simmonds.1997. Investigation of the dynamics of the spread of human immunodeficiency virus to brain and other tissues by evolutionary analysis of sequences from the p17gagandenvgenes. J. Virol.
71:1272–1280.
28.Kavlick, M. F., T. Shirasaka, E. Kojima, J. M. Pluda, F. Hui, Jr., R. Yarchoan, and H. Mitsuya.1995. Genotypic and phenotypic characterization of HIV-1 isolated from patients receiving (⫺)-2⬘,3⬘-dideoxy-3⬘-thiacytidine. Antivir. Res.28:133–146.
29.Kemal, K. S., B. Foley, H. Burger, K. Anastos, H. Minkoff, C. Kitchen, S. M. Philpott, W. Gao, E. Robison, S. Holman, C. Dehner, S. Beck, W. A. Meyer, A. Landay, A. Kovacs, J. Bremer, and B. Weiser.2003. HIV-1 in genital tract
on November 8, 2019 by guest
http://jvi.asm.org/
and plasma of women: compartmentalization of viral sequences, coreceptor usage, and glycosylation. Proc. Natl. Acad. Sci. USA100:12972–12977. 30.Kim, R. B., M. F. Fromm, C. Wandel, B. Leake, A. J. Wood, D. M. Roden,
and G. R. Wilkinson.1998. The drug transporter P-glycoprotein limits oral absorption and brain entry of HIV-1 protease inhibitors. J. Clin. Investig.
101:289–294.
31.Koenig, S., H. E. Gendelman, J. M. Orenstein, M. C. Dal Canto, G. H. Pezeshkpour, M. Yungbluth, F. Janotta, A. Aksamit, M. A. Martin, and A. S. Fauci.1986. Detection of AIDS virus in macrophages in brain tissue from AIDS patients with encephalopathy. Science233:1089–1093.
32.Korber, B. T., K. J. Kunstman, B. K. Patterson, M. Furtado, M. M. McEvilly, R. Levy, and S. M. Wolinsky.1994. Genetic differences between blood- and brain-derived viral sequences from human immunodeficiency virus type 1-infected patients: evidence of conserved elements in the V3 region of the envelope protein of brain-derived sequences. J. Virol.68:7467– 7481.
33.Kosakovsky Pond, S. L., S. D. W. Frost, and S. V. Muse.2005. HyPhy: hypothesis testing using phylogenies. Bioinformatics21:676–679. 34.Kosakovsky Pond, S. L., D. Posada, M. B. Gravenor, C. H. Woelk, and S. D.
Frost.2006. Automated phylogenetic detection of recombination using a genetic algorithm. Mol. Biol. Evol.23:1981–2001.
35.Langford, D., A. Grigorian, R. Hurford, A. Adame, R. Ellis, L. Hansen, and E. Masliah.2004. Altered P-glycoprotein expression in AIDS patients with HIV encephalitis. J. Neuropathol. Exp. Neurol.63:1038–1047.
36.Lohrengel, S., F. Hermann, I. Hagmann, H. Oberwinkler, L. Scrivano, C. Hoffmann, D. von Laer, and M. T. Dittmar.2005. Determinants of human immunodeficiency virus type 1 resistance to membrane-anchored gp41-de-rived peptides. J. Virol.79:10237–10246.
37.Long, M. E., H. L. Martin, J. K. Kreiss, S. M. J. Rainwater, L. Lavreys, D. J. Jackson, J. Rakwar, K. Mandaliya, and J. Overbaugh.2000. Gender differ-ences in HIV-1 diversity at time of infection. Nat. Med.6:71–75. 38.Morris, A., M. Marsden, K. Halcrow, E. S. Hughes, R. P. Brettle, J. E. Bell,
and P. Simmonds.1999. Mosaic structure of the human immunodeficiency virus type 1 genome infecting lymphoid cells and the brain: evidence for frequent in vivo recombination events in the evolution of regional popula-tions. J. Virol.73:8720–8731.
39.Nickle, D. C., M. A. Jensen, D. Shriner, S. J. Brodie, L. M. Frenkel, J. E. Mittler, and J. I. Mullins.2003. Evolutionary indicators of human immuno-deficiency virus type 1 reservoirs and compartments. J. Virol.77:5540–5546. 40.Nunberg, J. H., W. A. Schleif, E. J. Boots, J. A. O’Brien, J. C. Quintero, J. M. Hoffman, E. A. Emini, and M. E. Goldman.1991. Viral resistance to human immunodeficiency virus type 1-specific pyridinone reverse transcriptase in-hibitors. J. Virol.65:4887–4892.
41.Ohagen, A., A. Devitt, K. Kunstman, P. Gorry, P. Rose, B. Korber, J. Taylor, R. Levy, R. Murphy, S. Wolinsky, and D. Gabuzda.2003. Genetic and functional analysis of full-length human immunodeficiency virus type 1env genes derived from brain and blood of patients with AIDS. J. Virol.77:
12336–12345.
42.Petito, C.2004. Human immunodeficiency virus type 1 compartmentalization in the central nervous system. J. Neurovirol.10:21–24.
43.Philpott, S., H. Burger, C. Tsoukas, B. Foley, K. Anastos, C. Kitchen, and B. Weiser.2005. Human immunodeficiency virus type 1 genomic RNA se-quences in the female genital tract and blood: compartmentalization and intrapatient recombination. J. Virol.79:353–363.
44.Pilcher, C. D., D. C. Shugars, S. A. Fiscus, W. C. Miller, P. Menezes, J. Giner, B. Dean, K. Robertson, C. E. Hart, J. L. Lennox, J. J. J. Eron, and C. B. Hicks.2001. HIV in body fluids during primary HIV infection: impli-cations for pathogenesis, treatment and public health. AIDS15:837–845. 45.Pillai, S. K., B. Good, S. Kosakovsky Pond, J. K. Wong, M. C. Strain, D. D.
Richman, and D. M. Smith.2005. Semen-specific genetic characteristics of human immunodeficiency virus type 1env. J. Virol.79:1734–1742. 46.Pillai, S. L., S. L. Kosakovsky Pond, Y. Liu, B. M. Good, M. C. Strain, R. J.
Ellis, S. Letendre, D. M. Smith, H. F. Gunthard, I. Grant, T. D. Marcotte, J. A. McCutchan, D. D. Richman, and J. K. Wong.2006. Genetic attributes of cerebrospinal fluid-derived HIV-1env.Brain129:1872–1883.
47.Ping, L.-H., M. S. Cohen, I. Hoffman, P. Vernazza, F. Seillier-Moiseiwitsch, H. Chakraborty, P. Kazembe, D. Zimba, M. Maida, S. A. Fiscus, J. J. Eron, R. Swanstrom, and J. A. E. Nelson.2000. Effects of genital tract inflamma-tion on human immunodeficiency virus type 1 V3 populainflamma-tions in blood and semen. J. Virol.74:8946–8952.
48.Poss, M., A. G. Rodrigo, J. J. Gosink, G. H. Learn, D. de Vange Panteleeff, J. Martin, L. Harold, J. Bwayo, J. K. Kreiss, and J. Overbaugh.1998. Evolution of envelope sequences from the genital tract and peripheral blood of women infected with clade A human immunodeficiency virus type 1. J. Virol.72:8240–8251.
49.Quinn, T. C., M. J. Wawer, N. Sewankambo, D. Serwadda, C. Li, F. Wabwire-Mangen, M. O. Meehan, T. Lutalo, R. H. Gray, and T. R. P. S. Group.2000. Viral load and heterosexual transmission of human immunodeficiency virus type 1. N. Engl. J. Med.342:921–929.
50.Rambaut, A., and N. C. Grassly.1997. Seq-Gen: an application for the Monte Carlo simulation of DNA sequence evolution along phylogenetic trees. Comput. Appl. Biosci.13:235–238.
51.Ritola, K., K. Robertson, S. A. Fiscus, C. Hall, and R. Swanstrom.2005. Increased human immunodeficiency virus type 1 (HIV-1)env compartmen-talization in the presence of HIV-1-associated dementia. J. Virol.79:10830– 10834.
52.Royce, R. A., A. Sena, W. Cates, and M. S. Cohen.1997. Sexual transmission of HIV. N. Engl. J. Med.336:1072–1078.
53.Saag, M. S., B. H. Hahn, J. Gibbons, Y. Li, E. S. Parks, W. P. Parks, and G. M. Shaw.1988. Extensive variation of human immunodeficiency virus type-1in vivo.Nature334:440–444.
54.Salemi, M., S. L. Lamers, S. Yu, T. de Oliveira, W. M. Fitch, and M. S. McGrath.2005. Phylodynamic analysis of human immunodeficiency virus type 1 in distinct brain compartments provides a model for the neuropatho-genesis of AIDS. J. Virol.79:11343–11352.
55.Schinazi, R. F., R. M. Lloyd, Jr., M. H. Nguyen, D. L. Cannon, A. McMillan, N. Ilksoy, C. K. Chu, D. C. Liotta, H. Z. Bazmi, and J. W. Mellors.1993. Characterization of human immunodeficiency viruses resistant to oxathio-lane-cytosine nucleosides. Antimicrob. Agents Chemother.37:875–881. 56.Shankarappa, R., J. B. Margolick, S. J. Gange, A. G. Rodrigo, D. Upchurch,
H. Farzadegan, P. Gupta, C. R. Rinaldo, G. H. Learn, X. He, X.-L. Huang, and J. I. Mullins.1999. Consistent viral evolutionary changes associated with the progression of human immunodeficiency virus type 1 infection. J. Virol.
73:10489–10502.
57.Shapshak, P., D. M. Segal, K. A. Crandall, R. K. Fujimura, B.-T. Zhang, K.-Q. Xin, K. Okuda, C. K. Petito, C. Eisdorfer, and K. Goodkin.1999. Independent evolution of HIV type 1 in different brain regions. AIDS Res. Hum. Retrovir.15:811–820.
58.Si-Mohamed, A., M. D. Kazatchkine, I. Heard, C. Goujon, T. Prazuck, G. Aymard, G. Cessot, Y. H. Kuo, M. C. Bernard, B. Diquet, J. E. Malkin, L. Gutmann, and L. Belec.2000. Selection of drug-resistant variants in the female genital tract of human immunodeficiency virus type 1-infected women receiving antiretroviral therapy. J. Infect. Dis.182:112–122. 59.Slatkin, M.1993. Isolation by distance in equilibrium and non-equilibrium
populations. Evolution47:264–279.
60.Slatkin, M., and W. P. Maddison.1989. A cladistic measure of gene flow inferred from the phylogenies of alleles. Genetics123:603–613.
61.Smit, T., B. Brew, W. Tourtellotte, S. Morgello, B. Gelman, and N. Saksena.
2004. Independent evolution of human immunodeficiency virus (HIV) drug resistance mutations in diverse areas of the brain in HIV-infected patients, with and without dementia, on antiretroviral treatment. J. Virol.78:10133– 10148.
62.Smit, T. K., B. Wang, T. Ng, R. Osborne, B. Brew, and N. K. Saksena.2001. Varied tropism of HIV-1 isolates derived from different regions of adult brain cortex discriminate between patients with and without AIDS dementia complex (ADC): evidence for neurotropic HIV variants. Virology279:509– 526.
63.Staprans, S., N. Marlowe, D. Glidden, T. Novakovic-Agopian, R. Grant, M. Heyes, F. Sweeka, S. Deeks, and R. Price.1999. Time course of cerebrospinal fluid responses to antiretroviral therapy: evidence for variable compartmen-talization of infection. AIDS13:1051–1061.
64.Strain, M. C., S. Letendre, S. K. Pillai, T. Russell, C. C. Ignacio, H. F. Gunthard, B. Good, D. M. Smith, S. M. Wolinsky, M. Furtado, J. Marquie-Beck, J. Durelle, I. Grant, D. D. Richman, T. Marcotte, J. A. McCutchan, R. J. Ellis, and J. K. Wong.2005. Genetic composition of human immuno-deficiency virus type 1 in cerebrospinal fluid and blood without treatment and during failing antiretroviral therapy. J. Virol.79:1772–1788.
65.Sullivan, S. T., U. Mandava, T. Evans-Strickfaden, J. L. Lennox, T. V. Ellerbrock, and C. E. Hart.2005. Diversity, divergence, and evolution of cell-free human immunodeficiency virus type 1 in vaginal secretions and blood of chronically infected women: associations with immune status. J. Vi-rol.79:9799–9809.
66.Tamura, K., and M. Nei.1993. Estimation of the number of nucleotide substitutions in the control region of mitochondrial-DNA in humans and chimpanzees. Mol. Biol. Evol.10:512–526.
67.Thioulouse, J., D. Chessel, S. Dole´dec, and J.-M. Olivier.1997. ADE-4: a multivariate analysis and graphical display software. Stat. Comput.7:75–83. 68.Thompson, K., M. Churchill, P. Gorry, J. Sterjovski, R. Oelrichs, S. Wesselingh, and C. McLean.2004. Astrocyte specific viral strains in HIV dementia. Ann. Neurol.56:873–877.
69.Venturi, G., M. Catucci, L. Romano, P. Corsi, F. Leoncini, P. Valensin, and M. Zazzi.2000. Antiretroviral resistance mutations in human immunodefi-ciency virus type 1 reverse transcriptase and protease from paired cerebro-spinal fluid and plasma samples. J. Infect. Dis.181:740–745.
70.Wang, T. H., Y. K. Donaldson, R. P. Brettle, J. E. Bell, and P. Simmonds.
2001. Identification of shared populations of human immunodeficiency virus type 1 infecting microglia and tissue macrophages outside the central ner-vous system. J. Virol.75:11686–11699.
71.Wawer, M. J., R. H. Gray, N. K. Sewankambo, D. Serwadda, X. Li, O.
on November 8, 2019 by guest
http://jvi.asm.org/
Laeyendecker, N. Kiwanuka, G. Kigozi, M. Kiddugavu, T. Lutalo, F. Nalugoda, F. Wabwire-Mangen, M. P. Meehan, and T. C. Quinn.2005. Rates of HIV-1 transmission per coital act, by stage of HIV-1 infection, in Rakai, Uganda. J. Infect. Dis.191:1403–1409.
72.Wiley, C. A., R. D. Schrier, J. A. Nelson, P. W. Lampert, and M. B. Oldstone.
1986. Cellular localization of human immunodeficiency virus infection within
the brains of acquired immune deficiency syndrome patients. Proc. Natl. Acad. Sci. USA83:7089–7093.
73.Zhu, T., N. Wang, A. Carr, D. Nam, R. Moor-Jankowski, D. Cooper, and D. Ho.1996. Genetic characterization of human immunodeficiency virus type 1 in blood and genital secretions: evidence for viral compartmentalization and selection during sexual transmission. J. Virol.70:3098–3107.