Environment, genes and the effects of genotype by environment (G x E) interactions, on the expression of commercially important traits in the silver-lipped pearl oyster, Pinctada maxima (Jameson)
116
0
0
Full text
(2) Environment, genes and the effects of genotype by environment (G x E) interactions, on the expression of commercially important traits in the Silver-lipped pearl oyster, Pinctada maxima (Jameson).. Thesis submitted by Renate Kvingedal, BApSc October, 2011. For the degree of Doctor of Philosophy in the School of Marine and Tropical Biology, James Cook University, Townsville, Queensland, Australia.
(3) Acknowledgements I am indebted to many wonderful people who have guided, encouraged and supported me throughout this journey. Firstly, I am heartily thankful to my primary supervisor Associate Professor Dean Jerry whose genuine encouragement, guidance, support and for without his amazing mentor skills this thesis would not have been achievable. I am truly blessed to have had Dean as my mentor and I will cherish the professional relationship, but also the genuine friendship gained, for this I am forever grateful. I would also like to show my gratitude to my other supervisor, Dr Brad Evans for his continual support and valuable advice throughout this project. I would like to show my gratitude to all my wonderful colleagues in the molecular genetics lab and the amazing assistance given by Dr Brad Evans, Curtis Lind, Christian de Santis, Erin McGinty and wholehearted thanks to Dr Carolyn SmithKeune for all her time, help and knowledge that opened my eyes to the wonderful world of applied molecular genetics. A special thanks to my fellow postgraduate student, May Helen Holme, for always listening and helpful advice over countless cups of coffee. I would like to thank Dr Joseph Taylor, Dr Jens Knauer, Jan Jorgensen, the Penyabangan hatchery staff and Alyui pearl farm staff at Atlas South Sea Pearl Ltd./P.T. Cendana Indopearls for their facilitation and care-taking of my experimental oysters in Bali and West Papua. Without their advice and helpful assistance this research would not have been possible. Finally, I must thank my family, close friends and the love of my life, Cris. Your endless love and support from the initial to the final step of this project got me over the line. To my amazing parents, Jane and Bengt, who have always believed in me and given me the strength and support to follow my dreams. And to Cris, words cannot describe what you mean to me and without you this would not have been possible, thank you..
(4) Abstract The silver-lipped pearl oyster, Pinctada maxima, is cultivated in Australia and throughout South East Asia for the production of "South Sea pearls". Pearls from P. maxima are the largest and most valuable pearl produced out of all pearl producing oyster species, with the industry being valued at ~US$ 412 million farm-gate globally. The commercial production of pearls from this species is well established and hatchery techniques have been developed to the stage where the life cycle is considered closed. A standard commercial pearl production cycle takes 4 years from the time oysters are spawned in the hatchery to the harvesting of pearls. The first two years is a "prepearl" grow-out phase for the oyster that will become the host oyster, and then a further two years in a "pearl growth" phase whereby the oyster is ‘seeded” and the pearl nacre is laid down. After this 4 year cycle only ~20% of pearls harvested fall within the category of being "gem quality", where the combination of the commercially important traits lustre, size, shape, weight, colour and complexion are all within the accepted standards. It is this long phase of production and the low proportion of gem quality pearls harvested that makes it very attractive for pearling companies to improve the consistency of production through the use of genetic breeding approaches. A current impediment to adoption of genetic approaches, however, is a lack of knowledge on the role additive genetic factors play in the realization of a pearl quality trait. Another consideration for future breeding programs is that pearl companies generally have several farm sites situated in geographically distinct locations, with one hatchery supplying all the seedstock to these locations. As such, as well as understanding the genetic basis underpinning pearl traits, it is important for companies to determine the effect disparate environmental influences due to site location may have on both oyster growth and pearl quality, and to establish whether the realization of genetic potential in improved oysters will be affected by genotype by environment (G x E) interactions. Like that for genetic parameters governing pearl quality and growth traits, however, data on the potential impact G x E may have on selected oysters reared under different environmental conditions is lacking. In response to this critical missing information this thesis aimed to establish genetic parameters and estimate genotype by environment interactions for both growth traits and pearl quality in the silver-lipped pearl oyster. Investigations commenced in this thesis by considering the effect long-line location (and perceived differences in micro-environment) at four sites within a pearl farm have on the realization of growth and pearl quality. Variance of these traits due to genetic differences as a consequence of using different cohorts of broodstock was also considered. In this experiment long-line site was shown to have a significant impact on the overall growth rate of oysters, with oysters reared on long-lines at the Sasanaflapo site growing significantly faster than those at the other three sites examined. These growth differences were also shown to manifest regardless of the age or genetic composition of the cohort evaluated. This shows that oyster growth is a trait that may be influenced by environmental parameters within farm locations, and that long-line location may override individual genetic effects on growth. The influence site has within a farm on pearl quality was, however, less conclusive. Only.
(5) differences in pearl colour overtones and lustre appeared to be modified by site effects within a farm. For example, pearl colour and lustre could be both partitioned using classification tree analyses by site, with the Duyef and Wulu sites producing on average more white pearls with pink overtones, while Maratlap and Sasanaflapo produced higher numbers of silver pearls with pink overtones. Likewise for lustre, splits in classification trees were related to the fact that the Wulu site produced more pearls exhibiting higher lustre grades. Despite these differences though no disparities were found in the economic value of pearls harvested from the various sites within the farm evaluated. With the suggestion that local-scale environmental effects may modify oyster growth traits the thesis then goes on to test if genetic differences represented by oysters from different families could be easily modified through the manipulation of defined environmental parameters. Here the relative performance in shell growth of spat from five full-sib families when spat were communally reared at different salinities (29, 34 and 40 ppt), food availability (high, medium and low), food quality (high, medium and low), and in a hatchery vs. ocean environment for 43 days, were compared. In support of the first experiment, rearing environment was again found to significantly influence growth expression, with significant differences evident when spat were reared at different salinities, in the ocean instead of hatchery, or when fed algae of differing nutritional quality. Additionally, comparative family growth was also altered when the environment changed, with significant environment by family interactions (G x E) apparent under food quality, food availability and hatchery vs. ocean rearing conditions. These results indicate, that at least during early oyster growth phases, that growth and relative family performance in P. maxima may change dependent on local environmental conditions. To further examine the effect environment and genetics has on oyster growth, spat were produced for a large commercial scale trial using broodstock originating from three distinct Indonesian populations (Bali, West Papua, Aru Islands). These spat from different genetic backgrounds were communally on-grown to adult sizes for two years at each of two Indonesian commercial farming locations (Bali and Lombok). Microsatellite based parentage determination analyses were used to retrospectively sort out oysters to both their family and population of origin. Significant size differences were observed in all shell growth traits measured (dorsal-ventral measurement DVM, anterior-posterior measurement APM, shell width SW and wet weight WW), with oysters originating from Bali and West Papua (DVM (mm) = 103.7±0.9 and 101.0±0.6 respectively) growing faster than those from the Aru population (93.5±0.5) at both grow-out locations. Family level differences within these populations were also present for shell traits, indicating a large amount of genetic variability present for potential breeding programs. However, although there were significant familial size differences for shell traits, unlike the earlier spat growth experiment, genetic correlation analyses showed little evidence for re-ranking of family performance among the two culture sites (rg = 0.89–0.99). This implies that under the commercial conditions oysters were evaluated that insignificant genotype by environment deviations among sites were evident. Heritability analyses based on these families were also conducted for shell traits, with DVM and APM found to be moderately heritable (0.15 ±0.00 (DVM), 0.23 ±0.03 (APM)). Thus selection for faster growing host oysters should be possible which would advantage the industry by.
(6) decreasing the amount of time it takes to grow oysters to a size suitable for nucleus implantation. The final experiment undertaken in this thesis estimated for the first time genetic parameters and G x E for pearl quality traits when multiple families were again reared at Bali and Lombok. Here significant differences in the size and value of pearls produced at the two locations were observed, with pearls produced at Lombok generally bigger and more valuable than their Bali counterparts. Comparisons of pearls produced by the various families jointly reared at these two sites also indicated adverse genetic correlations for size (rg = -0.22), colour (rg = 0.28) and weight (rg = 0.38), and less so shape (rg = 0.56) and lustre (rg = 0.59); thus the occurrence of genotype by environment modifications for these pearl quality traits needs to be factored into improvement programs. Heritability analyses based on the donor-oyster additive genetic contribution showed that all pearl traits except that of shape exhibited low to moderate heritabilities (size h2 = 0.13, lustre h2 = 0.14, weight h2 = 0.15, colour h2 = 0.15 and complexion h2 = 0.25). As a consequence these traits could be improved through the practice of selection. The findings of this thesis have substantially advanced our knowledge of the respective role genetics and the environment play in the realization of commercially important traits in the pearl oyster P. maxima. Pearl quality and oyster growth traits have been shown to have a heritable basis, thereby making them amiable to improvement through selection approaches. Results also have shown that when designing future breeding programs considerations of large-scale site induced environmental effects and associated genotype by environment modifications will need to be factored. Through implementation of the information gathered in this thesis the P. maxima pearling industry now has a sound basis for the future design of efficient selection programs aimed at improving the productivity and profitability of their industry..
(7) Table of Contents Acknowledgements ........................................................................................................ 2 Abstract .......................................................................................................................... 3 List of figures ................................................................................................................. 9 List of Tables ............................................................................................................... 10 Chapter 1. General introduction ................................................................................... 12 1.1 Prerequisites of Selective Breeding ................................................................... 12 1.1.1 Heritability .................................................................................................. 14 1.1.2 Gene by environment interaction ................................................................ 15 1.2 Pearl culture and aquaculture ............................................................................. 17 1.3 Thesis aims and structure ................................................................................... 21 Chapter 2. The effect of site selection on shell growth and pearl quality traits of the silver/gold-lipped pearl oyster, Pinctada maxima. ...................................................... 25 2.1 Introduction ........................................................................................................ 25 2.2 Materials and Methods ....................................................................................... 26 2.2.1 Experimental animals................................................................................. 26 2.2.2 Experimental design and site selection ...................................................... 27 2.2.3 Effects of site selection on pearl quality .................................................... 29 2.2.4 Statistical analysis and classification trees ................................................. 31 2.3 Results ................................................................................................................ 31 2.3.1 Effect of site selection on oyster shell growth traits ................................... 31 2.3.2 Effect of site selection on pearl traits .......................................................... 32 2.3.3 Pearl quality traits ....................................................................................... 33 2.3.4 Effect of site selection on pearl economic value ........................................ 37 2.3.5 Other analyses ............................................................................................. 38 2.4 Discussion .......................................................................................................... 39 2.4.1 Effect of site selection within a farm on important pearl oyster growth traits .............................................................................................................................. 39 2.4.2 Effects of site selection within a farm on pearl quality traits and economic outcome ................................................................................................................ 41 2.5 Conclusion ......................................................................................................... 43 Chapter 3. Growth and genotype by environment interactions in Silver-lipped pearl oyster (Pinctada maxima) spat reared under disparate environments. ........................ 45 3.1 Introduction ........................................................................................................ 45 3.2 Materials and methods ....................................................................................... 47 3.2.1 Experimental animals.................................................................................. 47 3.2.2 Experimental setup...................................................................................... 48 3.2.3 Effects of food availability on family growth traits .................................... 49.
(8) 3.2.4 Effects of food quality on family growth traits ........................................... 49 3.2.5 Effects of salinity on family growth traits .................................................. 50 3.2.6 Effects of hatchery vs. ocean rearing on family growth traits .................... 50 3.2.8 Measurements and statistical analyses ........................................................ 51 3.3 Results ................................................................................................................ 52 3.3.1 Effects of food availability on family growth traits .................................... 52 3.3.2 Effects of food quality on family growth traits ........................................... 57 3.3.3 Effects of salinity on family growth traits .................................................. 58 3.3.4 Effects of hatchery vs. ocean rearing environment on family growth traits .............................................................................................................................. 58 3.4 Discussion .......................................................................................................... 59 3.5 Summary ............................................................................................................ 61 Chapter 4. Population and family growth response to disparate rearing sites and genotype x environment interaction in the Silver-lipped pearl oyster (Pinctada maxima)........................................................................................................................ 63 4.1 Introduction ........................................................................................................ 63 4.2 Materials and Methods ....................................................................................... 66 4.2.1. Experimental animals................................................................................. 66 4.2.2. Markers and genotyping ............................................................................ 68 4.2.3 Parentage analyses ...................................................................................... 69 4.2.4 Measurements and statistical analysis ........................................................ 70 4.3 Results ................................................................................................................ 71 4.3.1 Parentage assignment .................................................................................. 71 4.3.2 Shell growth trait analyses .......................................................................... 73 4.3.2.1. Population differences ............................................................................ 73 4.3.2.2 Family differences ................................................................................... 74 4.3.3. Genetic parameters..................................................................................... 76 4.4 Discussion .......................................................................................................... 77 4.4.1 Population growth differences .................................................................... 78 4.4.2 Family growth differences and genotype-environment interactions .......... 79 4.4.3 Effect of site location .................................................................................. 80 4.4.4 Heritability and genetic correlations ........................................................... 80 Chapter 5. Heritability estimates and the effect of genotype x environment interaction on the production of pearl quality traits in the Silver-lipped pearl oyster, Pinctada maxima ......................................................................................................................... 82 5.1 Introduction ........................................................................................................ 82 5.2 Materials and Methods ....................................................................................... 85 5.2.1 Experimental animals and site selection ..................................................... 85.
(9) 5.2.2 Initial oyster grow-out and pearl nuclei seeding ......................................... 86 5.2.3 Measurement of pearl quality ..................................................................... 87 5.2.4 Markers and genotyping ............................................................................. 88 5.2.4 Parentage analyses ...................................................................................... 89 5.2.5 Measurements and statistical analysis ........................................................ 90 5.3 Results ................................................................................................................ 92 5.3.1 Family assignment ...................................................................................... 92 5.3.2 Site and population effects on pearl quality ................................................ 92 5.3.3 Heritability and genetic correlations ........................................................... 94 5.4 Discussion .......................................................................................................... 95 Chapter 6 General Discussion ...................................................................................... 99 6.1 Constraints in the South Sea pearl industry in relation to implementing a selective breeding program .................................................................................... 100 6.2 Understanding of heritability of important shell growth and pearl traits and the importance of determining G x E interactions. ...................................................... 102 6.3 Future direction and concluding remarks ........................................................ 104 References .................................................................................................................. 106.
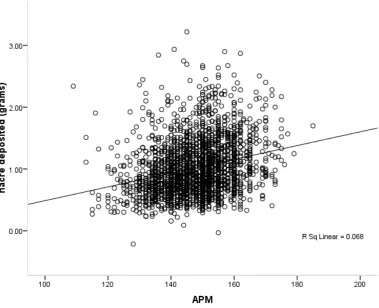
(10) List of figures Chapter 2 Figure 2.1: Location of the experimental sites within the P. maxima pearl farm site in West Papua. Modified from Lee et al., (2008)…………………….……33 Figure 2.2: Classification tree for cohort 1a with the effect of site selection on pearl colour (a) and lustre (b). Note D=Duyef, M=Maratlap, S=Sasanaflapo and W=Wulu………………………………………………...…………….…40 Figure 2.3: Scatterplot showing correlation between host oyster APM (mm) and pearl nacre deposited (grams)……………………………..…………………..42 Chapter 3 Figure 3.1: Variation in average anterior posterior measurements (APM) (mm ± SE) for five families reared in a) three different food availability treatments, b) three disparate food quality treatments, c) three different salinity treatments and d) the hatchery vs. ocean reared treatments. Notes: graph shows deviation from the mean of the control (commercial feeding or hatchery conditions) treatment. Means with the same superscript do not differ significantly (P>0.05). Bar represents SE………………………...58 Chapter 4 Figure 4.1: Mean monthly seawater temperature at 5 m depth at the two Indonesian grow-out locations. Bali (unbroken line) and Lombok (dotted line)…….72 Figure 4.2: Comparison for a) dorsal-ventral measurements, b) anterior-posterior measurements, Shell width and d) wet weight, for Pinctada maxima families reared at 18 months in Bali and Lombok. Note: ♦ = Aru families, ■ = Bali families, ▲ = West Papuan families…………………………...79.
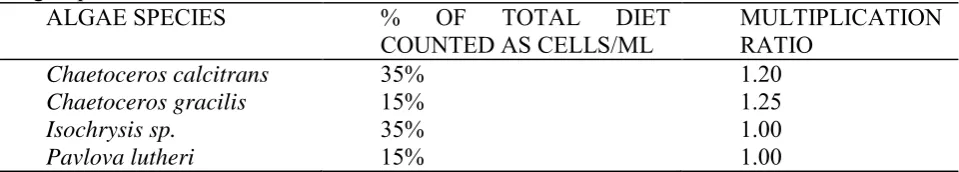
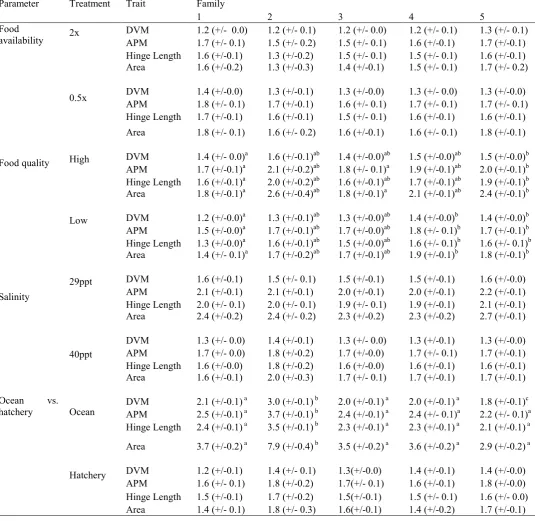
(11) List of Tables Chapter 2 Table 2.1: Grading system for P. maxima pearls. A summary version from Atlas South Sea Pearls Inc (Taylor 2007 …………….………………………..34 Table 2.2: Mean growth (±SE) for shell characters measured in two cohorts evaluated between four Indonesian grow-out sites (Duyef, Maratlap, Sasanaflapo and Wulu). APM = Shell anterior-posterior measurement (mm), DVM = shell dorsal-ventral measurement (mm)……………………………..….36 Table 2.3: Total oysters seeded from each cohort at each evaluation grow-out site, the number of pearls produced per site, percentage pearls harvested as a proportion of total seeded per site, and percentage of pearls harvested which were reject quality per site ………………………………………37 Table 2.4: Mean (±SE) pearl size (mm) and pearl weight (g) measured in three cohorts evaluated at four grow-out sites within a large Indonesian farm……….38 Table 2.5: Mean nacre deposited (g) between cohorts within the culture sites. Mean nacre was measured as the final weight of pearls harvested minus the corresponding initial weight of the seed nucleus………..…………..… 39 Table 2.6: Average pearl price (US$) ± SE measured within each cohort from the four sites evaluated. Means with the same superscript do not differ significantly within cohorts (P<0.05)……………………………….………………….41 Table 2.7: Mean pearl size (mm) between silver and gold nacre colour host oysters, for each pearl seed nucleus size implanted………………………………43 Chapter 3 Table 3.1: The four different algae species used to rear spat in the experimental trials. Note: stocking rates were adjusted to compensate for differences in biomass among algal species to achieve a 1:1:1:1 biomass ratio……………..…...52 Table 3.2: Mean (+/- SE) growth for shell characters measured in five Pinctada maxima families evaluated under the different parameters of food availability, food quality, salinity, and ocean vs hatchery rearing environment. DVM = shell dorso-ventral measurement (mm), APM = shell anterior-posterior measurement (mm), area = total shell area, tracing landmark point of shell (mm2). Subscripts indicate significant differences between families at P<0.05)………………………………………………57 Table 3.3: Univariate (ANOVA) and multivariate (MANOVA) analyses on the effect of food availability, food quality, salinity, and ocean vs hatchery rearing environment on the expression of four Pinctada maxima shell growth traits; dorsal ventral shell length (DVM), anterior posterior shell length (APM), shell hinge length and shell area……………………………………….59-60 10.
(12) Chapter 4 Table 4.1: Number of alleles (k), polymorphic information content (PIC), expected heterozygosity (H), average non-exclusion probability for a candidate parent pair (NE-PP) and estimates of null alleles (Null) of P. maxima progeny from the Aru, Bali and Raja Empat populations………………..76 Table 4.2: Sample size and population of origin means (± standard deviation) for the four growth traits measured in P. maxima when grown at two sites (Bali and Lombok). n = number of oysters analyzed from each population…..77 Table 4.3: Heritability (h2) and genotype by environment (rg) estimates for P. maxima shell growth traits measured at two sites (Bali and Lombok) at 14 and 18 months of age. DVM = shell dorsal-ventral measurement, APM = shell anterior-posterior measurement, SW = shell width and WW = wet weight……………………………………………………………………...80 Table 4.4: Genetic correlations (phenotypic correlation in parentheses) between shell growth traits at 14 months (below diagonal) and 18 months (above diagonal) in the Silver- lipped pearl oyster P. maxima. DVM = shell dorsalventral measurement, APM = shell anterior-posterior measurement, SW = shell width and WW = wet weight………………………………………..81 Chapter 5 Table 5.1: Grading system for P. maxima pearls. A summaries version from Atlas South Sea Pearls inc …………………………………………………..…..94 Table 5.2: Significance of the fixed effects of nucleus size, grow-out location, cohort and technician on pearl quality traits……………………………………..96 Table 5.3: Sample size and means (± SD) for two growth traits and pearl value in P. maxima when grown at two sites (Bali and Lombok)…………………….97 Table 5.4: Sample size and saibo population of origin means (± SD) for the two growth traits measured and pearl value in P. maxima when grown at two sites (Bali and Lombok). n = number of oysters analyzed from each population…………………………………………………………..……..97 Table 5.5: Heritability (diagonal), Genetic (below diagonal) and phenotypic (above diagonal) correlations and their standard errors for pearl traits………….98 Table 5.6: Genetic correlations and their standard errors between same traits at two different locations……………..…………………………………………..99. 11.
(13) Chapter 1. General introduction A fundamental requirement in the design and conduct of efficient selective breeding programs is an understanding of the genetic basis of traits under selection. In aquaculture, acquisition of genetic knowledge over the last three decades has permitted the development of industrial-scale breeding programs in several commercial species, including Atlantic salmon (Salmo salar), rainbow trout (Oncorhynchus mykiss), marine shrimp (family Penaeidae) and tilapia (tilapiine cichlids) (Gjedrem, 2005). However, for many other aquaculture species, targeted improvement programs are still impeded by a basic paucity of data on the quantitative genetic basis of traits. One such aquaculture industry that is interested in applying selection to improve profitability, but for which there are currently gaps in genetic understanding of traits, is that of South Sea pearl farming, an industry based on the culture and harvest of pearls from the silver-lipped pearl oyster, Pinctada maxima.. 1.1 Prerequisites of Selective Breeding Historically, pearl production of the silver-lipped pearl oyster, Pinctada maxima, was based on the harvest of oysters from the wild and their subsequent rearing on commercial long-lines (Gervis and Sims, 1992). It is only in the last 20 years that hatchery techniques have been developed to the point where the life-cycle could be considered closed and reliable hatchery production of seedstock has occurred. Closure of the life-cycle has allowed the possibility for selective breeding programs to be instigated and recently there has been increased interest from pearling companies in the application of quantitative genetic breeding methodologies to the improvement of. 12.
(14) traits of economic interest, such as survival, growth rate and pearl quality (Knauer, et al., 2007; Rose and Baker, 1994; Wada and Jerry, 2008). To enable P. maxima pearlers to exploit the improvement potential that selective breeding can bring there is an urgent need to understand the fundamental genetic mechanisms determining commercially important pearl and shell traits. In particular there is a requirement to determine the heritability and genetic correlations of important pearl quality traits, as well as providing species-specific heritability estimates for shell growth characters. This information is essential since there is no way of determining beforehand whether phenotypic variability observed in a trait is a result of heritable gene effects (ie. additive genetic variation), non-heritable genetic interactions such as dominance and/or epistasis, or a dissimilar environment. Also of interest is whether the genetic potential of an individual will be realized under disparate local environmental conditions (so called genotype by environment (G x E) interactions). Quantitative genetic theory predicts that phenotypic variation within a population is determined largely by both genetic and environmental factors according to the equation; VP = VG + VE + VGE, where VP is the total phenotypic variation for a trait within a population, VG is the amount of phenotypic variation attributable to genetic potential of an individual, VE is the modification of genetic potential due to environmental variation, and VGE is the variation attributable to environment specific interactions between the genotype of an animal and its local environment (G x E interactions) (Dunham, 2004). Most selection programs aim to improve the contribution of the VG component of phenotypic expression through targeted breeding of individuals possessing favourable genes for a trait of interest. Commonly, given 13.
(15) infrastructure requirements, this selection will proceed in a single environment and often possible modifications of genetic potential by local culture environments (ie G x E interactions) are ignored. As such it is important to obtain important genetic information both in determining heritability of important pearl oyster growth and pearl traits and also to estimate the effect of genotype by environment interaction for the species under selection. 1.1.1 Heritability. Heritability is the proportion of phenotypic variation in a population that is due to additive genetic variation between individuals (i.e VG) (Falconer and Mackay, 1996). Most heritability studies conducted in aquaculture species have been with fish (Gjedrem, 2005), with reports of heritability estimates for growth rate ranging from 0.10 to 0.20 (Gjedrem and Baranski, 2009). Although no heritability studies have been conducted with the silver-lipped pearl oyster, Pinctada maxima, a selective breeding study in the Akoya pearl oysters (Pinctada fucata), found realized heritability of two shell traits, shell width and convexity, to be 0.47 and 0.35, respectively (Wada, 1986). Velayudhan et. al., (1996) estimated rather higher realized heritability of the same traits in Akoya pearl oysters from India over four generations as did He et. al., (2008) (0.71 ± 0.21). Heritability estimates for growth traits in closely related pearl oyster species to that of P. maxima highlight the potential genetic gains that can be realized for shell growth traits through selective breeding. However, as heritability dictates what breeding scheme would be most effective in a selective breeding program (Falconer and Mackay, 1996) heritability for shell traits of interest in P. maxima will need to be estimated before breeding programs can be commenced in this species. At present there are no heritability estimates for pearl quality in any pearl producing oyster species. 14.
(16) 1.1.2 Gene by environment interaction. Genotype by environment (G x E) interactions occur when genotypes of the cultured species express their phenotypes differently when reared under diverse environments (Sheridan, 1997), i.e. the genetic potential of the animal is modified depending on the specific genotype of the animal and its response to the environmental influence exerted on it - most commonly as a consequence of differing selective pressures (Dunham, et al., 1990). Numerous studies from terrestrial animal industries and several aquaculture species demonstrate that G x E effects commonly are present and that the genetic potential of an individual is not always realized when animals are reared under different environments. As an example, Wohlfarth et. al., (1983) found that Chinese and European carp each have adapted to the conditions in which they were initially domesticated. For the trait growth rate, in a good environment (moderate stocking density and good diet) the European carp was dominant over the Chinese carp. Conversely, in a poor environment (high stocking density and poor diet) the Chinese strain produced a superior growth rate over the European carp (Wohlfart, et al., 1983). Significant genotype by environment interactions have also been identified in bivalves by Newkirk (1978), who found significant differences in the growth rates of four different populations of Crassostrea virginica larvae reared in different salinities (Newkirk, 1978, 1980).. There are two different types of G x E interactions that can be detected in aquaculture situations (Dunham, 2004). The first type of G x E interaction is observed when the relative performance rank of two or more genotypes changes when compared in two. 15.
(17) or more environments, as in the above two examples of carp and C. virginica. The other G x E effect observed which is not as severe in terms of impact on breeding programs, is not where ranking of genotypes change in the disparate environments, but is due to magnitude effects among genotypes (Dunham, 2004). Here superior performing families may still be superior for the trait of interest, but the difference between their performances compared to other families may be much smaller or greater due to the particular environmental challenge.. In aquaculture species, most studies on G x E interaction have been with high production fish species (i.e. salmonids, tilapia, catfish and some marine finfish) with G x E interactions found to vary in importance. Several studies found evidence for low G x E interactions (Eknath, et al., 1993; Gjerde, et al., 1994; Kolstad, et al., 2006; Ponzoni, et al., 2008; Saillant, et al., 2006; Sylven, et al., 1991), whilst other studies have conversely found significant G x E effects (Dunham, et al., 1990; Dupont-Nivet, et al., 2008; Imsland, et al., 2005; Imsland, et al., 2000; Iwamoto, et al., 1986; Wohlfart, et al., 1983). In pearl aquaculture the determination of possible disruption of genetic performance of families due to G x E interactions is of major importance to breeding programs, as pearling companies often rely on a few hatcheries to produce seedstock which are subsequently reared at several geographically distinct grow-out sites. Thus, the information on whether selectively bred oysters genetically improved at one location will produce offspring that perform well at other locations is of great consequence. Sheridan, (1997) states that there is considerable experimental evidence that the growth rate of oysters is sensitive to apparently small environmental differences. If this is true than an understanding of potential G x E impacts are essential before targeting breeding begins. 16.
(18) Commonly the magnitude of G x E interaction increases with genetic distance between genotypes and disparity in environments. When G x E interactions are considerable, a breeding program should be developed for each of the different environments in which the animals are to be reared (Gjedrem, 2005). The development of several breeding lines generally involves more labour and cost for the industry, however, their presence might not be all bad. Rawson and Hilbish, (1991) surmised that if a G x E interaction is significant it should preserve any heritable variation associated with the growth trait in their experimental animal the hard clam Mercenaria mercenaria, and they also indicated that G x E might lead to the development of phenotypic plasticity for growth (Rawson and Hilbish, 1991). This indicates that G x E interactions can act to maintain or help against the removal of genetic variation.. 1.2 Pearl culture and aquaculture. The silver-lipped pearl oyster, Pinctada maxima, is the largest of the Pteriidae pearl oysters and is cultured throughout south-east Asia and Australia for the production of South Sea Pearls, with the industry worldwide valued at US$412 million (Wada and Jerry, 2008). Cultured pearl production began in full-scale for this species in Australia in 1949 based on the “seeding” of wild adult oysters. Pearl oysters of an adequate size were collected by divers from the seafloor using hard-hat diving suits and then implanted with a small bead nucleus and placed into nets suspended from long-lines. For the next 40 years cultured pearls were produced this way based solely on harvest of wild stocks. However, over-exploitation of oysters and the consequent instigation 17.
(19) of strict heavily regulated quotas led in the early 1980’s to the development of hatchery culture techniques. Nowadays the majority of cultured pearls are derived from hatchery sources. Modern cultured pearl production is consequently divided into three distinct culture phases, each requiring different production technologies and expertise. The first phase, that of hatchery or larval rearing, is the most demanding, requiring cultivation of algae as feed for the larvae and providing substrate for the spat to settle on. For P. maxima, Tanaka and Kumeta, (1981) first published accounts of successful spat production as early as 1981, while the Western Australian Department of Fisheries and Wildlife (FIRTA) developed and published a hatchery manual nine years later (Rose and Baker, 1994; Tanaka and Kumeta, 1981). However, fears of over-production resulted in the manuals limited distribution and routine production of P. maxima spat in commercial hatcheries really only became commonplace in the early 2000’s (Minaur, 1996). Since these early days in hatchery production, a gradual change of attitude has developed and there are now a number of commercial hatcheries producing P. maxima spat.. Several studies has been conducted on optimal larval conditions for P. maxima and the other two main commercial pearl producing species P. margaritifera and P. fucata (Doroudi and Southgate, 2000; Doroudi, et al., 1999a; O'Connor and Lawler, 2002, 2004; Rose and Baker, 1994; Taylor, 1999; Taylor, et al., 2004; Taylor, et al., 1997). These studies described optimal food density, larval density, salinity and temperature for the hatchery phase. In research studies into the hatchery culture of pearl oysters survival has been looked at as an important factor in assessing different culture conditions, however, growth seems to be the predominant factor when evaluating physiological condition (Doroudi and Southgate, 2000). Studies have found that 18.
(20) larvae fed high food rations had lower growth (Doroudi, et al., 1999b, c; Riisgard, 1991). This has been explained with an increase in microbial activity and resulting poor water quality, but another explanation is that the reduction in clearance rate was associated with reaching maximum gut retention, leading to valve closure and reduced metabolism (Riisgard, 1991). Rose and Baker, (1994) pointed out in the hatchery protocol that P. maxima larvae should not be overfed and algal densities should be adjusted based on their clearance rate to maximize growth and survival. Live food is one of the major costs in running a hatchery and optimizing the algal density is key for both health of the animal and keeping the running costs down. Stocking densities of the larvae is another important factor, and the different species of Pinctada seem to vary a lot in their ability to tolerate high stocking densities, with P. maxima needing to be reared at lower larvae densities than P. fucata (Doroudi and Southgate, 2000; Rose and Baker, 1994). If the stocking densities are too high it might decrease the water quality causing low survival and growth of the larvae, however, if the larvae density is too low it might increase the running cost making the hatchery unprofitable (Doroudi and Southgate, 2000). Despite the difference in the ability to tolerate high larval densities, studies found that these three species, P. maxima, P. margaritifera and P. fucata, settle at the same time (20-23 days after fertilization) and at the same size (230-266 μm) (Alagarswami, et al., 1989). Temperature seems to be major factor in survival with the highest survival being at lower temperatures, however, this is not the best condition for increased growth (Doroudi, et al., 1999b). The success in producing P. maxima spat means the life-cycle is closed for this species and a selective breeding program is possible to establish.. 19.
(21) The second production phase, the grow-out phase is a relatively simple procedure since the animals are filter feeders, with pearl oysters able to filter water at rates up to 25 l h−1 g−1 of dry wt. tissue (Gifford, et al., 2004). Hence, no artificial feeding is required with their main diet being phytoplankton and particulate matter (Lucas, 2003). In the grow-out phase oysters are simply placed into pockets of panel nets suspended from long-lines. However, it takes almost two years until oysters are large enough for pearl nuclei seeding and during this time they have to be regularly cleaned to maintain them free of biofouling organisms. Biofouling control throughout the growth phase is not only labor intensive, but one of the major costs to commercial operators. For example, in Indonesia the cost of undertaking these activities equates to ~US$0.40/month/oyster (Joseph Taylor, unpublished data). A typical large pearling farm may carry 300,000+ pre-implantation oysters. Therefore reducing the time taken for oysters to grow to a size suitable for nuclei implantation by as little as one month will provide significant cost savings to companies. Genetic selection for fast growth is one option available to reduce the time farmers have to grow oysters till implantation size.. Nuclei implantation and the subsequent growth of the pearls comprise the third and final culture phase. A piece of mantle tissue from a donor (or saibo) oyster is inserted into the gonad of a host oyster along with a bead nucleus honed from the shell of Mississippi mud clam. The donor oysters are selected for their nacre colour and are sacrificed and the mantle tissue (nacre producing organ of the oyster) are dissected out and cut into smaller pieces. The host oysters are gently opened up, and an incision is made into the gonad and a bead nucleus is implanted together with a piece of the donor mantle tissue. If the grafting surgery is successful the piece of mantle tissue will 20.
(22) grow around the nucleus and form what is called a pearl sac where the tissue will start to lay down nacre, creating the pearl. As such the formation of cultured South Sea pearls result from a complex man-made process incorporating two different oysters to produce a single pearl.. The value of the pearls produced are based on five quality traits or virtues; size, shape, colour, lustre and surface complexion. Although there is no world recognized standard for the grading of pearls; the larger, rounder, smoother and brighter the pearl is the higher its value (Taylor and Strack, 2008).. Unlike other pearl producing species such as P. fucata, silver-lipped pearl oysters are usually only seeded with a single nucleus. However, the overall larger size of the silver-lipped oyster means that a larger nucleus can be implanted resulting in pearls between 10 mm and 20 mm (average of 13 mm) in diameter. A single host oyster can be seeded at least three times during its productive life, producing a pearl on average every two years. Repetitive seeding of adult oysters is a way companies compensate for the long initial grow-out phase to seeding size, however, usually after the 2nd pearl has been produced nacre quality deteriorates due to the age of the oyster (Dr Joseph Taylor pers. com.).. 1.3 Thesis aims and structure This thesis was undertaken as part of the Australian Research Council Linkage Project LP0560298; “Towards selective breeding of the Silver-lipped pearl oyster, Pinctada maxima”, and was a research collaboration with the commercial pearling company. 21.
(23) Atlas South Sea Pearl Ltd. The main objective of this study was to produce essential genetic information to allow the company to commence a genetic selection program for P. maxima. For this to be successful, the program needed to establish for the first time the genetic basis of oyster growth and pearl quality traits, as well as how the phenotypic variance in these traits varied due to population and/or location of culture (i.e. G x E).. Chapter 2 provides an insight into how site selection within a pearl oyster farm can primarily affect host pearl oyster growth and variation in pearl quality. The chapter highlights the role of multiple environmental factors and determines whether pearl quality and value were significantly influenced by grow-out location within a pearl farm when a selective breeding program was not instigated. From this starting point the subsequent aim of the thesis was to estimate genetic parameters for important traits through the various phases of the production cycle (from spat to harvest of pearls). As highlighted earlier there are three distinct stages in pearl aquaculture (1) the hatchery phase, 2) pearl oyster grow-out to seeding and 3) pearl production. Chapter 3-5 incorporates each of these stages and looks at heritability estimates and G x E interaction for families produced from three distinct Indonesian populations when reared at two commercial sites.. Chapter 3 examined whether the environment significantly influenced growth differences among pearl oyster families in the final stages of hatchery production and whether there is any evidence of genotype by environment effects operating on growth early in production. It achieved this aim by assessing the relative performance. 22.
(24) in oyster spat shell growth traits in five full-sib families communally reared under different salinities, algae diet and hatchery vs. ocean environment for 43 days.. Chapter 4 follows 32 full sib and 80 half-sib families produced from broodstock originating from three populations from spat until they reach the required size for seeding. This grow-out period takes up to two years and the industry currently faces problems with different growth rates and the amount of time it takes until the animals are ready to be used for seeding. This chapter estimated heritability and G x E of important pearl oyster shell growth traits and lays the fundamentals for commencing a selective breeding program for increased host oyster growth.. Chapter 5 unravels in a pearl producing species for the first time the complexity of pearl formation and provides valuable information on genetic parameters of pearl quality traits. Heritability and the effect of genotype x environment interactions are estimated and the interplay between the host and donor oyster and their contribution to pearl formation are highlighted. The importance of estimating genetic correlations between pearl quality traits and especially to determine how traits of interest are correlated is of critical importance before setting breeding goals for this industry.. Together, these chapters provide important genetic information on all three production stages in pearl oyster aquaculture and will aid in the development of a selective breeding program for the silver-lipped pearl oyster, Pinctada maxima.. Each of the data chapters in the thesis contains a stand-alone Introduction, Materials & Methods, Results and Discussion section formatted for scientific journal 23.
(25) publication. At the time of thesis submission, three of these chapters have been accepted for publication in peer-reviewed journals and are presented with minimal modification and minor re-formatting as they were published.. 24.
(26) Chapter 2. The effect of site selection on shell growth and pearl quality traits of the silver/gold-lipped pearl oyster, Pinctada maxima.. 2.1 Introduction The silver/gold-lip pearl oyster, Pinctada maxima, is cultured throughout south-east Asia and Australia for the production of South sea pearls. In P. maxima, as in other mollusks, the shell is a comprehensive product of biomineralization formed through the deposition of aragonite CaCO3 crystals by the oyster mantle tissue (Dix, 1972; Gong, et al., 2008a; Gong, et al., 2008b; Miyamoto, et al., 1996). The production of a cultured pearl occurs through the same biomineralization process, except in this instance a piece of mantle tissue from a donor oyster is inserted into the gonad of a host oyster along with a “seed” nucleus. Over time, this implanted mantle tissue grows to encompass the seeded nuclei in what is referred to as a pearl sac and lays down a nacreous covering comprising aragonite to form a pearl.. The physical composition of nacre is mostly comprised of biomineralized CaCO3 (91.50%), with traces of organic substances (3.83%), water (3.97%) and finally residual elements (0.01%) (ie. Ba, Mg, P, Mn, Fe, Al, Cu, Zn, Ag, Hg, Li and Sr) (Taylor & Strack, 2008). Recent evidence from the freshwater bivalve, Elliptio complanata, suggests that micro-environmental factors like variation in water trace element levels can influence the mineral composition of pearl nacre, with levels of Mn, Sr and Ba in the water correlating with levels of these same elements observed in the nacre (Carroll and Romanek, 2008). Whether or not these changes in microchemistry lead to quantifiable differences in pearl quality traits, or pearl value, is not known however. In fact there is a paucity of data relating to culture site effects 25.
(27) on pearl quality, with the reported effects restricted to industry manuals and other grey literature which state that site factors such as disparate temperature and food availability impact on the rate of nacre deposition, see (Saucedo and Southgate, 2008).. Studies which have examined site effects in pearl oyster culture have been restricted to examining impact on growth. For instance, mathematical modeling of P. maxima growth was performed to determine the growth requirements of pearl oysters during the various production stages (ie. spat, juvenile and seeded oysters) (Lee, et al., 2008). Lee, et al., (2008) found that control over environmental factors that influence growth of the pearl oyster (water temperature, salinity and food availability) can be somewhat exerted through careful selection of culture sites within a farm. However, the role that the site, and thus the change in multiple environmental factors, play in determining the quality of the pearls harvested has not been explored. In response to this gap in our understanding, a study was instigated whereby pearl oysters from two genetically differentiated spawnings were each reared at four geographically isolated sites within a large P. maxima pearl farm in Indonesia. Data were collected on oyster shell growth traits, along with pearl size and quality traits, to determine if pearl quality and value were significantly influenced by grow-out location within a pearl farm.. 2.2 Materials and Methods 2.2.1 Experimental animals. Mass spawnings involving 50 broodstock oysters were conducted in October 2003 and March 2004 in a commercial hatchery resulting in the production of two separate genetic cohorts of P. maxima. The broodstock for these two cohorts were selected for 26.
(28) their silver/white nacre colour (Atlas South Sea Pearl, Bali, Indonesia). Before spawning, all broodstock were individually tagged using DymoTM labels with an identification number and the sex of the animal. To encourage spawning, the broodstock were initially placed in the sun for ~20 min, then positioned upright in racks situated in a 600 L spawning tank. This tank was then filled and aerated for 30 min for acclimation, alternately drained, and refilled. The animals were allowed to mass-spawn and the fertilized eggs were passed through a 200 µm screen and collected in 10 L buckets and then stocked into separate 400 L larval tanks.. After 48 hours, tanks were drained, larvae collected onto 45 µm screens and transferred into 3000 L rearing tanks where they were reared under standard commercial conditions until settlement. Once the larvae approached plantigrade metamorphosis, polypropylene ropes were placed into tanks to provide a substrate for settlement. The spat were then transferred to long-lines until they reached the required size for seeding.. 2.2.2 Experimental design and site selection. Host oysters were selected to be a similar size at seeding, while donor (saibo) oysters were selected based on their white nacre coloration. It is important to condition the gonad of host oysters prior to seeding so that they are not in an active phase of gametogenesis, this will lessen the incidence of rejection after the pearl nuclei are inserted. Consequently, host oysters were covered with mesh-cloth 3 weeks prior to seeding operations. Oysters were seeded with pearl nuclei during two operation periods. The first pearl seeding was undertaken in September 2005 using the fastest. 27.
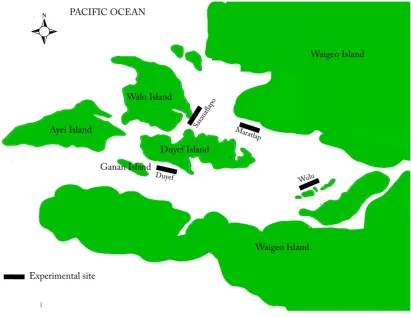
(29) growing oysters from the 2003 spawning (Cohort 1a, n=959). Pearl nuclei sizes (and weight in brackets) used for this seeding were 6.1 mm (0.33 g), 6.7 mm (0.44 g) and 7.3 mm (0.57 g). The second pearl seeding was conducted in March 2006 using both the remaining oysters from the 2003 spawning (Cohort 1b, n= 1113) and those spawned in 2004 (Cohort 2, n=1076). Nucleus sizes utilized for seeding in these two oyster cohorts were 7.6 mm (0.65 g), 7.9 mm (0.73 g) and 8.2 mm (0.82 g) for cohort 1b and 7.3 mm (0.57 g), 7.6 mm (0.65 g) and 7.9 mm (0.73 g) for cohort 2. As the surgical technique and hygiene used by grafting technicians may influence pearl quality, all seeding operations were undertaken using only two technicians. Oysters seeded by each technician made up half of each 16 pocket net panel to minimize bias due to technician experience.. Once all oysters had been seeded they were transported to a single recovery site for 10 weeks post-operation. After this time they were randomly split into four groups (average 400 animals per cohort per site) and relocated to their respective grow-out sites within a single farm located in West Papua. The four sites utilized in this experiment were; Duyef (0°11. 607’S, 130°15.288’E), Maratlap (0°09.450’S, 130°17.410’E), Sasanaflapo (0°10.514’S, 130°16.468’E), and Wulu (0°11.995’S, 130°18.804’E). Sites were located 3-7 kms apart with water depths ranging from 3545 m. Sites varied in water current and surrounding topography (Figure 2.1), however, environmental parameters were not specifically measured during this trial. Once established in their grow-out locations the seeded oysters were placed in 32 pocketpanels and cleaned according to commercial farm practices until pearls were harvested 22 months later. The animals were moved into larger 16 pocket-panels are they grew. 28.
(30) Figure 2.1. Location of the experimental sites within the P. maxima pearl farm site in West Papua. Modified from Lee et al., (2008).. 2.2.3 Effects of site selection on pearl quality. At harvest, anterior posterior (APM) and dorsal ventral (DVM) shell growth measurements were taken from the host oyster and the host shell nacre colour recorded. Pearls, if present, were harvested and placed into an individually labeled bag for grading. If hosts did not contain a pearl, or if a keshi pearl had formed (a small irregular shaped pearl resulting after nuclei have been rejected), this was also recorded. After cleaning, pearl size (mm), weight (g), shape, lustre, surface complexion and colour were measured and commercially graded according to the criteria outlined in Table 2.1. As six different nucleus sizes were utilized for this experiment, harvested pearl size and weight were initially adjusted to determine if. 29.
(31) actual nacre deposition values differed among pearls seeded with similar sized nuclei. However, analyses showed that the trends of these two data sets did not vary with or without inclusion of initial nucleus information. The value of each individual pearl was calculated from a proprietary formula which simultaneously evaluated all pearl quality traits (Atlas South Sea Pearl, unpublished data). Table 2.1 Grading system for P. maxima pearls. A summary version from Atlas South Sea Pearls Inc. (Taylor 2007) Characteristics Grading description Size: How a pearl is The position for measuring pearl diameter relative to the pearl shape measured is dependent on shape. Shape: In order to assist Round, Near Round, Semi Round, Oval, Drop, Semi Drop, High in pearl classification and Button, Flat Button, Semi Button, Semi Baroque, Baroque, Circle valuation some broad shape categories are utilized Colour: like shape, colour can only be broadly defined. White, White with silver overtone, White with pink overtone, White with fancy overtone, Silver, Silver with pink overtone, Silver with fancy overtone, Pink, Cream, Cream with pink overtone, Cream with fancy overtone, Yellow, Light Gold, Metallic Gold, Metallic Gold with fancy overtone, Fancy colour; i.e. apricot, purple, chocolate and platinum. Complexion: A blemish is an imperfection in the surface of a pearl, the cleaner the complexion, the higher the grade. A1=no blemishes or 1 small blemish, B1=1-3 very small blemishes, B2=3 or more blemishes, C1=minor blemishes all over the pearls surface, C2=blemished but still demonstrating lustre that is not appropriate for retail sale, D1=blemished low quality pearl. Lustre: a combination of reflection and refraction of light from the surface of a pearl. 1=gem/brilliant: pearls appear very bright, light appears to reflect from within the pearl, 2=excellent: pearls are bright and have a good inner reflection, 3=high: pearls are bright on the surface but have minimal inner reflection, 4=modest: reflection is not clear and the pearls appear slightly opaque, 5=poor: opaque appearing “milky”. 30.
(32) 2.2.4 Statistical analysis and classification trees. Shell APM and DVM were compared amongst the grow-out sites within each spawning cohort using ANOVA (Zar, 1999), as implemented in the SPSS 16.0 software program (Coakes, et al. 2008). When ANOVA indicated significant differences (P<0.05) between sites, Tukey’s HSD post-hoc multiple comparison test was used as the means separation procedure (Zar, 1999). Homogeneity of variances was confirmed using Levene’s Test (Zar, 1999). A bivariate Pearson product-moment correlation was used to look at the relationship between APM and nacre deposited (Zar, 1999). To estimate the importance of site selection for categorical pearl quality traits (ie colour, lustre, shape, complexion), a classification tree analysis was undertaken using Treesplus (Breiman, et al., 1984). Classification tree analysis was chosen as it can be used for interactive exploration of categorical datasets and for description and prediction of variance patterns (De'ath & Fabricius, 2000).. 2.3 Results 2.3.1 Effect of site selection on oyster shell growth traits. Site was found to significantly influence pearl oyster shell growth traits (Table 2.2). Cohort 1a oysters exhibited significant differences among sites in APM (F3, 36.25, P <0.001) and DVM (F3,. 715. 715. =. = 25.61, P <0.001), with the Sasanaflapo site. producing the oysters with the largest overall shell growth. The Sasanaflapo site also produced oysters with the largest DVM for cohorts 1b and 2, as well as APM in cohort 2. As the superior growth differences at the Sasanaflapo site were observed across all three cohorts, including two distinct genetic spawnings, these results suggest that the environmental conditions at this site were the most conducive for fast 31.
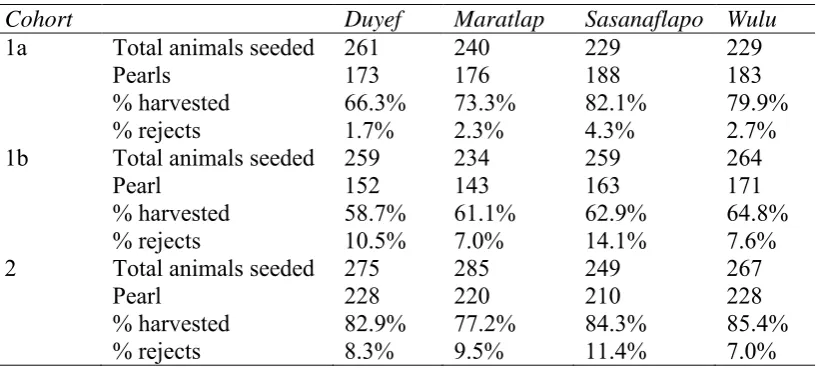
(33) oyster shell growth. Conversely, the Maratlap site was found to produce the slowest growing oysters for all three cohorts.. Table 2.2. Mean growth (±SE) for shell characters measured in two cohorts evaluated between four Indonesian grow-out sites (Duyef, Maratlap, Sasanaflapo and Wulu). APM = Shell anterior-posterior measurement (mm), DVM = shell dorsal-ventral measurement (mm). Traits Duyef Maratlap Sasanaflapo Wulu a b Cohort 1a APM 135.6±0.78 132.9±0.79 143.7±0.79c 136.2±0.72ab DVM 146.6±0.78a 144.2±0.77b 152.7±0.68c 148.5±0.60a Cohort 1b APM 141.7±0.81a 140.5±0.83a 138.8±0.83a 141.4±0.82a DVM 151.2±0.74ab 150.2±0.84ab 153.2±0.82a 150.1±0.81b Cohort 2 APM 133.7±0.67a 132.5±0.61 a 136.2±0.61 b 136.4±0.65b DVM 143.6±0.67a 143.1±0.65a 148.6±0.64b 145.1±0.61a Means with the same superscript do not differ significantly within cohorts (P <0.05). 2.3.2 Effect of site selection on pearl traits. 2.3.2.1 Pearls harvested Significant differences were observed among cohorts in the percentage of pearls harvested (F2,. 6. = 33.8; P <0.05), with oysters in cohort 2 producing the highest. percentage of pearls (Cohort 1a 75.4%, Cohort 1b 61.9% and Cohort 2 82.5%) (Table 2.3). Differences were also evident between the percentage of pearls harvested from Cohorts 1a and 1b, despite the fact that these oysters originated from the same genetic stock. Within each cohort, there was minimal effect of site on the proportion of oysters that produced a pearl. However, among the pearls produced site had a significant impact on the percentage considered as being of low quality, or rejected for sale (F3, 6 = 7.9, P <0.05). The Sasanaflapo site had the highest percentage of reject pearls (mean = 9.9%), while the Wulu site had the least (mean = 5.7%). Differences were also observed in proportion of reject pearls due to cohort (F2, 6 = 40.6, P <0.001),. 32.
(34) with cohorts 1b and 2 exhibiting a significantly higher number of reject pearls than cohort 1a.. Table 2.3. Total oysters seeded from each cohort at each evaluation grow-out site, the number of pearls produced per site, percentage pearls harvested as a proportion of total seeded per site, and percentage of pearls harvested which were reject quality per site. Cohort Duyef Maratlap Sasanaflapo Wulu 1a Total animals seeded 261 240 229 229 Pearls 173 176 188 183 % harvested 66.3% 73.3% 82.1% 79.9% % rejects 1.7% 2.3% 4.3% 2.7% 1b Total animals seeded 259 234 259 264 Pearl 152 143 163 171 % harvested 58.7% 61.1% 62.9% 64.8% % rejects 10.5% 7.0% 14.1% 7.6% 2 Total animals seeded 275 285 249 267 Pearl 228 220 210 228 % harvested 82.9% 77.2% 84.3% 85.4% % rejects 8.3% 9.5% 11.4% 7.0%. 2.3.3 Pearl quality traits. 2.3.3.1 Pearl size and weight Table 2.4 summarizes the mean pearl size and weight between the grow-out sites for all cohorts evaluated. Site selection significantly affected pearl size (F3, 766 = 4.1, P <0.05) and weight (F3, 766 = 3.3, P <0.05) for cohort 1a, and pearl weight for cohort 1b (F3,. 690. = 2.8, P <0.05), but not pearl size in cohort 1b (F3,. 690. = 1.8, P>0.05). For. cohort 2 no significant differences in pearl weight and pearl size between grow-out sites were established. Although, pearl size across sites followed a similar trend to that of shell growth of the host oysters, with the largest pearls harvested at the Sasanaflapo site coming from the oysters that exhibited overall fastest growth. Likewise, pearls from Maratlap were significantly lower in size and weight in cohort 1a, however, in 33.
(35) cohort 1b Duyef was significantly lower in pearl weight compared to the other sites evaluated. Table 2.4 Mean (±SE) pearl size (mm) and pearl weight (g) measured in three cohorts evaluated at four grow-out sites within a large Indonesian farm. Trait Duyef Maratlap Sasanaflapo Wulu Pearl size 10.15±0.09ab 9.93±0.08a 10.30±0.08b 10.18±0.08ab ab a b Pearl weight 1.64±0.04 1.54±0.04 1.68±0.04 1.64±0.04ab Cohort 1b Pearl size 10.33±0.06a 10.43±0.07a 10.55±0.06a 10.40±0.06a a ab b Pearl weight 1.69±0.03 1.74±0.03 1.81±0.03 1.74±0.03ab Cohort 2 Pearl size 10.13±0.05a 10.12±0.05a 10.05±0.06a 10.05±0.06a a a a Pearl weight 1.58±0.03 1.60±0.02 1.57±0.03 1.56±0.03a Means with the same superscript do not differ significantly within cohorts (P>0.05) Cohort 1a. Cohort effects in pearl size and weight as determined by nacre deposition (mm) were also observed (Table 2.5). Nacre deposition was observed to be higher in Cohort 1a, than 1b at all sites, despite oysters from these two cohorts being of the same genetic stock. Cohort 1a oysters were seeded at a younger age than those from Cohort 1b, and given the same genetic background of these two cohorts, the differences observed are likely to be due to differences in nacre deposition rate as a factor of oyster seeding age, or possibly environmental temporal differences between seeding dates due to earlier seeding of Cohort 1a. The Sasanaflapo site produced the heaviest nacre deposition for both cohort 1a and 1b, indicating that site performance did not change over time with oysters comprising the same genetic background.. 34.
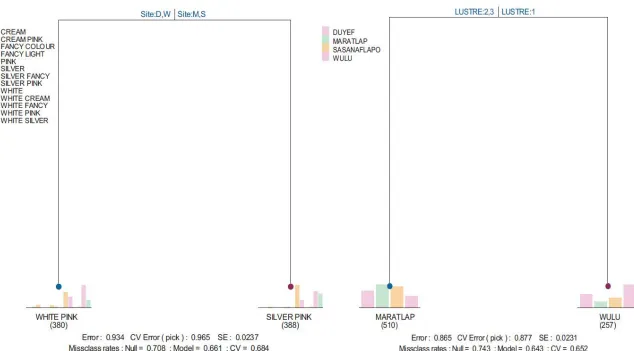
(36) Table 2.5.Mean nacre deposited (g) between cohorts within the culture sites. Mean nacre was measured as the final weight of pearls harvested minus the corresponding initial weight of the seed nucleus. Nacre deposited Cohort 1a Cohort 1b Cohort 2 a b Duyef 1.20 ± 0.04 0.94 ± 0.02 0.93 ± 0.03b Maratlap 1.09 ± 0.04a 0.98 ± 0.03ab 0.95 ± 0.02b a Sasanaflapo 1.24 ± 0.04 1.07 ± 0.03b 0.91 ± 0.03c Wulu 1.20 ± 0.04a 0.98 ± 0.03b 0.90 ± 0.03b Means with the same superscript do not differ significantly (P<0.05). 2.3.3.2 – Pearl colour, lustre, shape and complexion Classification tree analyses for the categorical pearl quality traits suggest that except for Cohort 1a, site location had little influence on pearl colour, lustre, shape or complexion, with no significant splits due to site effects being evident within the trees. However, for cohort 1a, analyses indicated that substantial amounts of the variance observed in both pearl colour and lustre could be partitioned by site, with the Duyef and Wulu sites producing on average more white pearls with pink overtones (n = 380), while Maratlap and Sasanaflapo produced higher numbers of silver pearls with pink overtones (n = 388). Likewise for lustre a split was formed in Cohort 1a whereby the Wulu site produced more pearls exhibiting the highest lustre grade (Grade 1, n = 257) (Figure 2.2).. 35.
(37) Figure 2.2. Classification tree for cohort 1a with the effect of site selection on pearl colour (a) and lustre (b). Note D=Duyef, M=Maratlap, S=Sasanaflapo and W=Wulu. 36.
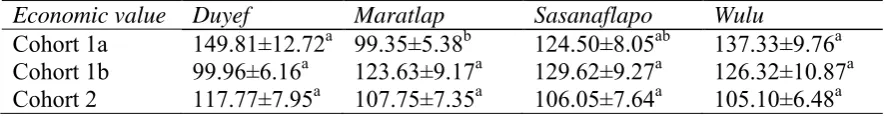
(38) 2.3.4 Effect of site selection on pearl economic value. In cohort 1a, pearls significantly differed in their average value (US$) between growout sites (F3, 696 = 2.9, P <0.05)(Table 2.6), with the Maratlap site producing pearls of average lower value than the other three sites. Overall, pearls from Duyef were of the highest value for cohorts 1a and 2, but in cohort 1b the trend was reversed with pearls produced at the Duyef site being of the lowest value. It is not known why this is the case as the oysters in cohort 1b were the same genetic stock as in cohort 1a; however one hypothesis might be that older animals were seeded as host oysters in cohort 1b and age impacted on the quality of the pearl. For cohort 1b, Sasanaflapo produced pearls with the highest average value, however, these differences were not significant across sites (F3, 628 = 2.1, P >0.05) despite pearls being on average $30 higher in value between Sasanaflapo and Duyef. Cohort 2 followed the same trend as cohort 1a, with Duyef producing pearls with the highest value; again across all sites these differences were not statistically significant (F3,. 768. = 3.5, P > 0.05) (Table 2.6). These results. indicate that site selection within our trial farm did not have a major impact on the overall value of pearls produced, however, it seems the genetic composition and age of the host oysters may be of higher importance.. Table 2.6 Average pearl price (US$) ± SE measured within each cohort from the four sites evaluated. Means with the same superscript do not differ significantly within cohorts (P <0.05) Economic value Duyef Maratlap Sasanaflapo Wulu a b ab Cohort 1a 149.81±12.72 99.35±5.38 124.50±8.05 137.33±9.76a Cohort 1b 99.96±6.16a 123.63±9.17a 129.62±9.27a 126.32±10.87a a a a Cohort 2 117.77±7.95 107.75±7.35 106.05±7.64 105.10±6.48a Means with the same superscript do not differ significantly within cohorts (P<0.05). 37.
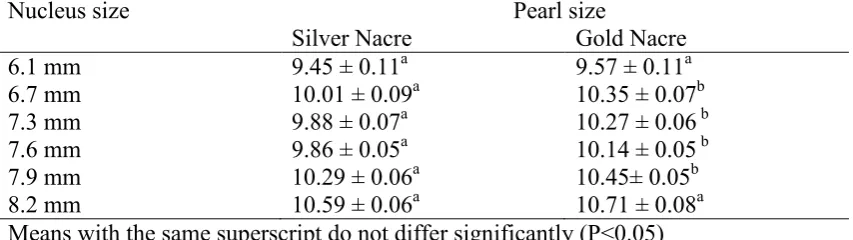
(39) 2.3.5 Other analyses. To further explore the effect of host oyster growth on nacre deposition a bivariate correlation was performed. Here a weak positive correlation was found whereby oysters with larger APM produced pearls with thicker nacre (r = 0.262, P < 0.05; Figure 2.3).. Figure 2.3. Scatterplot showing correlations between host oyster APM (mm) and pearl nacre deposited (grams). Finally, as nacre colour of the host oysters used in this study could be classified into two distinct P. maxima phenotypes (gold-lipped and Silver-lipped) we examined if host nacre colour was associated with pearl nacre deposition. When pearls were grouped within nucleus sizes implanted, gold nacre coloured host oysters produced on average larger pearls for the same nucleus size than silver nacred hosts (e.g. nucleus 38.
(40) size 6.7 mm (F1, 359 = 8.2; P <0.05), 7.3 mm (F1, 434 = 13.8; P<0.001), 7.6 mm (F1, 433 = 12.2; P<0.001) and 7.9 mm (F1,. 574. = 4.2; P <0.05) (Table 2.7). However, size. differences were not significantly different for the smallest and largest nucleus sizes used (e.g. 6.1 mm (F1, 213 = 1.0; P>0.0.05) and 8.2 mm (F1, 324 = 1.8; P>0.05), although gold-nacred hosts were observed to still produce slightly larger pearls for these nucleus sizes.. Table 2.7 Mean pearl size (mm) between silver and gold nacre colour host oysters, for each pearl seed nucleus size implanted Nucleus size Pearl size Silver Nacre Gold Nacre a 6.1 mm 9.45 ± 0.11 9.57 ± 0.11a 6.7 mm 10.01 ± 0.09a 10.35 ± 0.07b a 7.3 mm 9.88 ± 0.07 10.27 ± 0.06 b 7.6 mm 9.86 ± 0.05a 10.14 ± 0.05 b a 7.9 mm 10.29 ± 0.06 10.45± 0.05b a 8.2 mm 10.59 ± 0.06 10.71 ± 0.08a Means with the same superscript do not differ significantly (P<0.05). 2.4 Discussion. 2.4.1 Effect of site selection within a farm on important pearl oyster growth traits. Growth of oysters destined to be hosts is an important trait in pearl farming. Generally, the faster the growth the less time needed for oysters to be cultured to a shell size where they can be seeded. As this phase of culture takes approximately 2 years in P. maxima, substantial cost savings could be achieved if site location was shown to significantly influence shell growth. In this case, sites could be chosen specifically for the purpose of culturing fast growing host oysters, expediting the total time taken to produce a pearl. Accordingly, our results indicate that site location does have a significant impact on host oyster shell growth. We found that oysters at one. 39.
Figure


+7
Related documents
Hence in the present investigation, we documented the important families, number of the genera and species and the medicinal uses of medicinally important plants which
Firms already empanelled with PFC Consulting Limited (earlier Consultancy Services Group) vide letter no. Foreign firms not having an office in India may also apply with
Critically, reduction in TbERD2 expression results in secretion of the BiPN:KQDL reporter, confirming that localization of endogenous soluble ER proteins such as TbPDI2 and BiP
Bernoulli’s principle states that The pressure of a moving liquid decreases as the speed of the fluid increases and vice versa. Describe activity to show
Pulmonary delivery of AAV [2/2]CC10-TNFR:Fc vector resulted in increased transduction of the airway epithelium compared with animals treated with AAV[2/2]CMV-TNFR:Fc vector, but
Preservation of renal function by thyroid hormone replacement therapy in chronic kidney disease patients with subclinical hypothyroidism : Korea; Published
They could feel the thrill of dangerous situa- tions, experience the forbidden (allusions to excesses in drugs and alcohol, illicit sexual rela-.. tions) which, however, was
Our framework emphasizes data-owner specified user and host (property) based access control policies, to ensure that privacy sensitive information is only made accessible
