City, University of London Institutional Repository
Citation
:
Andongabo, A. & Gashi, I. (2017). vepRisk - A Web Based Analysis Tool for Public Security Data. Paper presented at the 13th European Dependable Computing Conference, 4-8 Sep 2017, Geneva, Switzerland.This is the accepted version of the paper.
This version of the publication may differ from the final published
version.
Permanent repository link:
http://openaccess.city.ac.uk/17584/Link to published version
:
Copyright and reuse:
City Research Online aims to make research
outputs of City, University of London available to a wider audience.
Copyright and Moral Rights remain with the author(s) and/or copyright
holders. URLs from City Research Online may be freely distributed and
linked to.
City Research Online: http://openaccess.city.ac.uk/ [email protected]
vepRisk - A Web Based Analysis Tool for Public
Security Data
Ambrose Andongabo, Ilir Gashi
Centre for Software Reliability City, University of London
London, UK
{Ambrose.Andongabo.1, Ilir.Gashi.1}@city.ac.uk
Abstract— We present vepRisk (Vulnerabilities, Exploits and Patches Risk analysis tool): a web-based tool for analyzing publically available security data. The tool has a backend modules that mine, extract, parse and store data from public repositories of vulnerabilities, exploits and patches; and a frontend web-based application that provides functionality for analyzing the data. The frontend uses shinyR, hence allowing integration with the R statistical analysis package and seamless use of R functions. We also present initial analysis we have done with the tool, and outline the extensions and future development we plan to integrate into the tool in the near future.
Keywords— Security; Security data analysis; Security analysis tools; Data analysis
I. INTRODUCTION
There are many publically available security data sources, which are actively used by researchers and industry (e.g. the National Vulnerability Database, exploitdb1, patch databases from the vendors etc.) to analyze current trends and assess their security exposure. Most of these resources provide an Application Programming Interface (API) that allows for the data to be mined and analyzed.
Many quantitative studies have been carried out using public security data (e.g. [1], [2]). The main focus has been on the vulnerability lifecycle and studying individual vulnerability metrics. Others, such as the work from Frei et al. [3] have provided analysis of multiple risk factors (vulnerabilities, exploits and patches), but they considered a particular period of time (up to 2009 in [3]). This makes it difficult for an organization to assess their current risk exposure. What may benefit them is an online tool using the most up-to-date information on public security data, which has integrated multiple disparate but publically available data sources on security. For this reason, we built vepRisk2: a web based tool that provides a data integration platform with a frontend to allow researchers to analyze up-to-date publically available security datasets at any time online.
vepRisk serves as a knowledgebase for public security data and provides a web interface for analyzing and visualizing the underlying data. It provides functionality for analyzing relationships between the different security risk factors in public
1https://nvd.nist.gov/, https://www.exploit-db.com/
security data. So far we have mainly looked at the relationships in time (e.g. looking at the time series of the different events), but we plan to extend the tool with functionality informed by our research into data mining, machine learning and predictive probabilistic models (such as security growth models [4]) and to find trends and relationships in security data.
The rest of the paper is organized as follows: section II describes the architecture of vepRisk; section III describes initial results obtained with vepRisk; section IV references related work and finally section V outlines the conclusions and next steps in the vepRisk development.
II. ARCHITECTURE OF THE VEPRISK TOOL
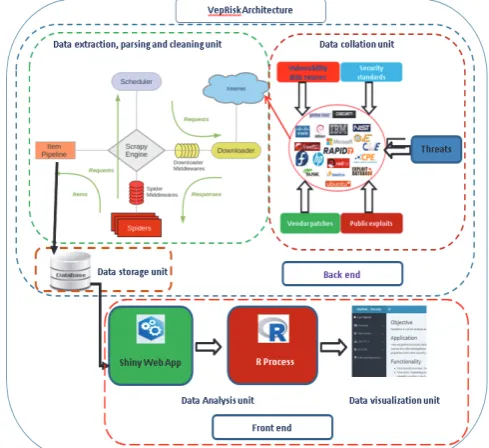
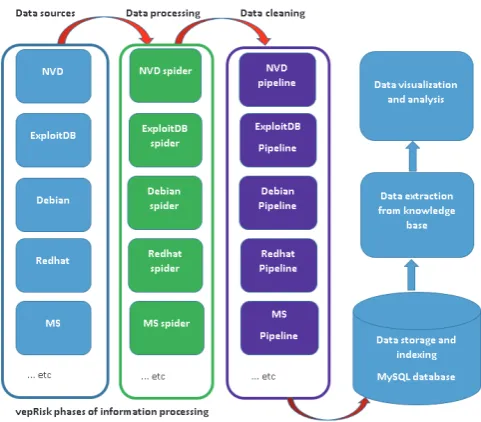
The vepRisk tool is a collection of interactive components. These components make up the backend and the frontend of the tool. They are used to collate, process, store and analyze public security data. Figure 1 shows a high level architectural view of the tool, and Figure 2 a more detailed view of the phases of data processing, analysis and visualization. We will explain them in more detail in the next two sub-sections.
FIG 1: VEPRISK ARCHITECTURE: A HIGH LEVEL VIEW
[image:2.595.306.551.458.682.2]
FIG 2: VEPRISK ARCHITECTURE: PHASES OF INFORMATION PROCESSING,
ANALYSIS AND VISUALIZATION
A. Backend
The backend is made of three different modules: namely the data collation unit, the data extraction, parsing and cleaning unit and the data storage unit. These three modules work closely together to generate the data (stored in a MySQL database) that is then processed in the frontend.
The configuration of the various data sources for which parsers will be developed is defined in the data collation unit. This configuration holds the links to the various data sources and configuration information such as login details to the database, location of temporary file directories etc. Gathering public security data using crawlers or spiders has some drawbacks because links to data sources might change or might not be available, the structure of the page might also change and cause spiders to break etc. These issues are resolved using modular structuring of the backend as shown in Figure 2. Each data source is a module. This modular structure provides the advantage of updating only data sources whose parsers are fully functional. Error messages generated by faulty parsers are used to diagnose the modules that failed and correct the errors before running the individual parsers.
The data extraction, parsing and cleaning unit is made up of data parsers for each vulnerability, exploit and patch data source. Parsers are crawlers or scrapers designed to crawl the web and extract specific information about vulnerabilities, patches and exploits from the selected data sources. Currently we have parsers for six different vulnerability data sources (National Vulnerability Database data source3, Security database data source4, CVE data source5, CVE Details data source6, Security
3https://nvd.nist.gov/
4https://www.security-database.com/ 5http://cve.mitre.org
6http://www.cvedetails.com/ 7http://www.securityfocus.com/ 8https://cxsecurity.com/
9https://technet.microsoft.com/en-us/security/bulletins.aspx
focus data source7 and CXSECURITY data source8), various vendor patch sources (e.g. Microsoft9, Debian10, SUSE linux11, Cisco12 etc.,) and exploits from Exploit database13 (illustrated by the left-most column in Figure 2). Due to the modular structure of the data collation framework, more parsers for other security data sources can easily be added.
The data extraction, parsing and cleaning unit receives input from the data collation module and follows the links to download and process the data from these sources. It converts the data into a format that is defined in the database. For example, the vulnerability published date extracted from a vulnerability data source is converted into the date format in MySQL. It also processes and “cleans” text data by removing symbols (brackets and quotation marks) before storing the information in the database. Data validation is also performed in this module (e.g. the format of the Common Vulnerability Enumeration identifiers and the format of patch and exploit identifiers). These modules are represented by the second and third columns in Figure 2.
The extracted data from various vulnerability, patch and exploit sources is stored in a MySQL database running in the data storage unit. Tables are created with referential integrity constraints between vulnerabilities, patches and exploits using the Common Vulnerability Enumeration (CVE) identifier, patch identifiers and exploit identifiers.
B. Frontend
To fully exploit the information collated, processed and stored by the vepRisk backend, we designed an easy to use frontend system for analyzing the data. The frontend has applications designed for the graphical overview of the data in the database, the analysis of inter-vulnerability, inter-patch and inter-exploit time series and using reliability models to find trends and correlations and also applications for the analysis of the vulnerability life cycle. These applications are designed using shiny14 from RStudio thus making use of powerful statistical and graphical libraries from the R project15.
III. EXPLORATORY ANALYSIS USING VEPRISK
We now show some examples of the analysis that are supported by the current version of the vepRisk tool. The tool offers various counts of vulnerabilities by year, type etc. These features are not new to vepRisk – they are also available in many other sites that offer simple statistics. Nevertheless, they are a useful way for an analyst to start the analysis.
Most of the current functionality offered in the tool is for time-series analysis per event type (i.e. times between vulnerabilities, exploits and patches), and between events (times between: a vulnerability and an exploit; a vulnerability and a patch; and an exploit and a patch). These are also subdivided by vendors, operating systems and applications. The data can also
10https://www.debian.org/security/ 11https://www.suse.com/security/cve/
12https://tools.cisco.com/security/center/publicationListing.x 13 https://www.exploit-db.com/
[image:3.595.45.286.51.262.2]be filtered by vulnerability type, vulnerability severity score and can be selected for any given period of time (using the slider provided on the tool).
A. Time-series analysis per event type
Security analysts may be interested in analyzing the times between vulnerabilities of their chosen products so that they can assess and forecast vulnerabilities that could affect these products in the future. In vepRisk the inter-vulnerability time series shows scatter plots of times between vulnerability reporting dates. The vulnerabilities are ordered by reporting date and each point in the plot is the difference (in calendar days, shown in the y-axis) between two adjacent vulnerabilities in the ordered list (shown in the x-axis). If vulnerabilities are reported on the same day, the difference is 0. The graph also shows a cumulative series. An example for all Apple operating system vulnerabilities is shown in Figure 3-a. The different types of vulnerabilities, as classified by NVD, are shown by the different colors on the right of the graph. The graph is interactive and the security analyst can, for example, choose to show just one (or more) of the vulnerabilities that they are interested in analyzing further. This is shown in figure 3-b, where the analyst has selected only the “Execute Code” (ExeC) vulnerabilities to be plotted. The analyst can then drill deeper and analyze vulnerabilities of different versions of Apple operating systems or applications.
a) b)
FIG. 3: APPLE INTER-VULNERABILITY TIME SERIES A) FOR VARIOUS VULNERABILITY TYPES B) FOR EXECUTE CODE VULNERABILITY TYPE ONLY
The analyst can also plot these series side by side with (currently) up to four other vendors’ products to enable the analyst to easily compare and contrast the vulnerabilities reporting rates of different vendors for the same types of systems. This is shown in Figure 4.
B. Inter-event time series analysis
We have also added functionality to enable analysis of the inter-event times between vulnerabilities, patches and exploits. This analysis is inspired by the work from Frei et al [3]. It allows an analyst to check how long it would take for a vulnerability to be exploited, for it to be patched, or for an exploited vulnerability to be patched. Since the inter-event times are calculated from public reporting dates, then some of these inter-event times can be negative (e.g. a patch for a vulnerability can be reported earlier than the details of that vulnerability were made public in a vulnerability repository).
Figure 5 shows an example of this analysis for Apple denial of service vulnerabilities. Sub-figure a) shows an ordered list of vulnerabilities by reporting date (x-axis) showing the days
a) b)
c) d)
FIG.4: INTER-VULNERABILITY TIME SERIES FOR OPERATING SYSTEMS OF FOUR DIFFERENT VENDORS.
a) b)
c) d)
FIG 5: TIME (IN DAYS) BETWEEN VULNERABILITIES, EXPLOITS AND PATCHES FOR APPLE DENIAL OF SERVICE VULNERABILITIES.
For Apple DoS vulnerabilities we see from sub-figure b) that there are a large number of zero-day vulnerabilities (i.e. the public vulnerability data and the exploit report date for that vulnerability is the same, as shown by the large cluster of blue dots on the 0 vale in the x-axis), and, worryingly, many of these vulnerabilities have patch dates published in some cases many months and years afterwards (as shown by blue dots in the y-axis. Sub-figure c) gives a more detailed view on the “competing risks” between exploits and patches. The fact that only one Apple DoS vulnerability is below 0 in the y-axis tells us that, according to publically available data from these sources, this is the only vulnerability for which a patch was available before an exploit was reported. A system owner would prefer all these dots to be below 0 in the y-axis.
IV. RELATED WORK
There have been several studies that have used public security data for various types of analysis. Examples include the work in [5] (statistical analysis and trends), [1] (application of vulnerability discovery models to vulnerability data), [2] (competing risk model using vulnerabilities, patches and exploits), [3] (analysis of trends and inter-event times between vulnerabilities, patches and exploits).
In all of these studies the authors had to first download the data from multiple security repositories (in some cases using custom-made tools) and then do the analysis offline. The advantage of the vepRisk tool we are presenting here is to allow the data to be available from one place, to allow for online analysis with the most up-to-date datasets.
Software Vulnerability Extraction and Analyzer (VEXA) [6] is an automated on-line tool that extracts information on vulnerabilities from different databases. However, compared with vepRisk, VEXA does not provide information for exploits or patches, or inter-event analysis functionality, and the tool is no longer available online.
vFeed16 is tool that provides a similar functionality to vepRisk. It crawls and integrates multiple data-sources together into one database. It also provides an API for accessing the data. However, it does not have the inter-event time frontend functionality that vepRisk provides and neither does it provide integration with ShinyR and ability to call R package functions. Nevertheless, there is scope for integrating vepRisk frontend functionality with vFeed which we will explore in the future.
V. CONCLUSIONS AND FURTHER WORK
We presented vepRisk: a tool for public-security data integration and analysis. We have made vepRisk publically available for other researchers to use.
The current functionality of vepRisk is primarily geared towards inter-event time analysis. Our current focus is on integrating functionality that allows for traditional reliability growth models to be used with the tool. Some initial integration with the R package “Reliability”17 has already been implemented in vepRisk. Next steps are to integrate more models, including those that have been specifically adapted for security, as well as more advanced features of reliability
16https://github.com/toolswatch/vFeed
modelling (such as u-plots and recalibration [7]) that allow for prediction accuracy to be assessed and for predictions to be calibrated.
Since the frontend of vepRisk is built on top of ShinyR we can easily call R statistical package functions. We hence plan to build various frontend extensions to show statistical summaries such as averages, standard deviations, box and whisker plots etc., as well as statistical significance tests.
There are limitations to using public security data for analysis and predictions, and hence conclusions that can be drawn from such analysis. The reporting dates of these events are the ones reported in the public sources from where the data is collected. Attackers and other nefarious actors may know about some of these vulnerabilities much earlier than when they are publically available. Hence the predictions that can be made using this data are limited to when events (vulnerabilities, patches, exploits) will first appear on these public sources. There are efforts from other researchers (e.g. in [8]) to incorporate early warnings about vulnerabilities and exploits from social networking sites. We plan to explore further how this research from other authors would allow for event information in vepRisk to be updated so that it more accurately reflects first known dates for these events.
Other functionality we expect to integrate in vepRisk in the future includes: support for clustering analysis (such as principal component analysis) and other forms of machine learning; improve the way the information presented in vepRisk is communicated to the end users through data visualization - for this part we plan to collaborate more closely with colleagues in the giCentre (gicentre.net) at our university.
ACKNOWLEDGMENT
This research is supported by the UK EPSRC project D3S (Diversity and defence in depth for security: a probabilistic approach).
REFERENCES
[1] Alhazmi, O.H. and Y.K. Malaiya, Application of Vulnerability Discovery Models to Major Operating Systems. IEEE Transactions on Reliability, 2008. 57(1): p. 14-22.
[2] Okamura, H., M. Tokuzane, and T. Dohi. Optimal Security Patch Release Timing under Non-homogeneous Vulnerability-Discovery Processes. in ISSRE-2009, 2009.
[3] Frei, S., et al., Modeling the Security Ecosystem - The Dynamics of (In)Security, in Economics of Information Security and Privacy, 2010, Springer p. 79-106.
[4] Lyu, M.R., ed. Handbook of Software Reliability Engineering. 1996, IEEE Computer Society Press and McGraw-Hill.
[5] Shahzad, M., M.Z. Shafiq, and A.X. Liu. A large scale exploratory analysis of software vulnerability life cycles. in IEEE ICSE-2012, 2012. [6] Mendes, N., et al. Benchmarking the Security of Web Serving Systems
Based on Known Vulnerabilities. in LADC-2011. 2011.
[7] Brocklehurst, S. and B. Littlewood, New ways to get accurate reliability measures. IEEE Software, 1992. 9(4): p. 34-42.
[8] Sabottke, C., et al, Vulnerability disclosure in the age of social media: exploiting twitter for predicting real-world exploits, in USENIX-2015 p. 1041-1056.