City, University of London Institutional Repository
Citation
:
Mitseas, I., Kougioumtzoglou, I., Giaralis, A. and Beer, M. (2018). A novel stochastic linearization framework for seismic demand estimation of hysteretic MDOF systems subject to linear response spectra. Structural Safety, 72, pp. 84-98. doi: 10.1016/j.strusafe.2017.12.008This is the accepted version of the paper.
This version of the publication may differ from the final published
version.
Permanent repository link: http://openaccess.city.ac.uk/18750/
Link to published version
:
http://dx.doi.org/10.1016/j.strusafe.2017.12.008Copyright and reuse:
City Research Online aims to make research
outputs of City, University of London available to a wider audience.
Copyright and Moral Rights remain with the author(s) and/or copyright
holders. URLs from City Research Online may be freely distributed and
linked to.
Structural Safety 72 (2018) 84–98
A novel stochastic linearization framework for seismic demand estimation
of hysteretic MDOF systems subject to linear response spectra
Ioannis P. Mitseas1*, Ioannis A. Kougioumtzoglou2, Agathoklis Giaralis3, Michael
Beer1,4,5
1Institute for Risk and Reliability,
Faculty of Civil Engineering and Geodetic Science
Leibniz University Hannover,
Callinstr. 34, 30167, Hannover, Germany
e-mail: *[email protected], [email protected]
2Department of Civil Engineering and Engineering Mechanics,
The Fu Foundation School of Engineering and Applied Sciences,
Columbia University,
500 West 120th Street, New York, NY 10027, USA.
e-mail: [email protected]
3Department of Civil Engineering,
City, University of London,
Northampton Square, EC1V 0HB, London, UK
e-mail: [email protected]
4Institute for Risk and Uncertainty and School of Engineering,
University of Liverpool,
Peach Street, Liverpool L69 7ZF, UΚ
5School of Civil Engineering and Shanghai Institute of Disaster Prevention and Relief,
Tongji University,
Structural Safety 72 (2018) 84–98
Abstract
This paper proposes a novel computationally economical stochastic dynamics framework to estimate the peak inelastic response of yielding structures modelled as nonlinear multi degree-of-freedom (DOF) systems subject to a given linear response spectrum defined for different damping ratios. This is accomplished without undertaking nonlinear response history analyses (RHA) or, to this effect, constructing an ensemble of spectrally matched seismic accelerograms. The proposed approach relies on statistical linearization and enforces pertinent statistical conditions to decompose the inelastic d-DOF system into d linear single DOF oscillators with effective linear properties (ELPs): natural frequency and damping ratio. Each such oscillator is subject to a different stationary random process compatible with the excitation response spectrum with damping ratio equal to the oscillator effective critical damping ratio. This equality is achieved through a small number of iterations to a pre-specified tolerance, while peak inelastic response estimates for all DOFs of interest are obtained by utilization of the excitation response spectrum in conjunction with the ELPs. The applicability of the proposed framework is numerically illustrated using a 3-storey Bouc-Wen hysteretic frame structure exposed to the Eurocode 8 elastic response spectrum. Nonlinear RHA involving a large ensemble of non-stationary Eurocode 8 spectrum compatible accelerograms is conducted to assess the accuracy of the proposed approach in a Monte Carlo-based context. It is found that the novel feature of iterative matching between the excitation response spectrum damping ratio and the ELP damping ratio reduces drastically the error of the estimates (i.e., by an order of magnitude) obtained by non-iterative application of the framework.
Keywords: seismic response spectrum analysis, nonlinear stochastic dynamics, stochastic processes, statistical linearization, hysteretic MDOF structure, Bouc-Wen model
1 INTRODUCTION
Practical design and assessment of structures for earthquake resistance commonly involves defining the seismic action through uniform hazard spectra (UHS) derived from probabilistic seismic hazard analysis based on ground motion prediction equations for spectral acceleration [1]. UHS provide the peak seismic response of linear viscously damped single-degree-of-freedom (SDOF) oscillators having a pre-specified probability to be exceeded in a given time period as a function of the natural period, T. They are developed for a nominal critical viscous damping ratio ζο, usually taken equal to 5%, and are complemented by damping adjustment
factors [2] which reduce linear spectral ordinates in case a higher damping level from the nominal one needs to be adopted. Still, the vast majority of (ordinary) structures are expected to yield under the design seismic action since seismic codes and National regulatory agencies allow for structures to resist severe earthquakes through ductile behavior to achieve cost-effective design for reduced strength [3]. In this setting, the problem of estimating the peak inelastic response (i.e., seismic demand) for structures modelled as multi-degree-of-freedom
(MDOF) systems subject to smooth linear response UHS arises naturally in code-compliant
seismic structural design and assessment.
Structural Safety 72 (2018) 84–98
(i.e., is in close agreement with) the linear UHS within a certain range of natural periods centered at the fundamental structural natural period [4]. In this respect, putting the need for dependable inelastic FE modelling aside, code-compliant nonlinear RHA requires considering artificial UHS compatible accelerograms [5], and/or judicial GM selection from large databanks of recorded accelerograms which are further scaled/modified to match a given linear UHS [6]. Such steps necessitate specialized software, are subject to subjective preferences and experience, and are cumbersome for everyday seismic design (or assessment) of ordinary structures. Further, nonlinear RHA is computationally demanding itself, especially if a sufficiently large number of GMs are considered in the analysis to reduce the variability of peak inelastic response data observed [7] when only the minimum number of GMs allowed by current seismic codes (typically 7 pairs or less) is used [8].
In view of the above challenges, seismic codes and guidelines [9-12] favor the use of simplified methodologies for routine seismic design and assessment involving less demanding structural analysis steps compared to nonlinear RHA. In particular, the long-standing force-based seismic design methodology utilizes modal response spectrum-force-based analyses applied to linear MDOF FE models in conjunction with modal combination rules without requiring explicit structural seismic performance assessment [3]. Further, displacement-based seismic design and assessment methodologies supporting modern performance-based earthquake engineering utilize nonlinear static (pushover) analyses applied to MDOF FE models to derive detailed pushover curves. Structural capacity is then quantified through surrogate inelastic SDOF oscillators characterized by idealized backbone capacity curves fitted to the detailed pushover curves [13-16 and references therein]. In this context, design seismic demand is specified by scaling the linear UHS ordinates through modification factors derived by considering the peak seismic response of inelastic SDOF oscillators following idealized force-deformation hysteretic relationships, commonly following bilinear hardening backbone curves, to safeguard general applicability. Specifically, UHS ordinates are scaled by strength modification (or behavior) factors, R, in the traditional force-based design approach to derive constant-ductility inelastic spectra [17]. These spectra provide seismic design forces compatible with a pre-determined ductility μ (ratio of peak inelastic over yielding deformation) expected under the design seismic action. Initiated by the work of Veletsos and Newmark [18], R factors are specified through R-μ-Τ relationships (e.g., [19]) derived by application of nonlinear RHA to inelastic viscously damped SDOF oscillators with initial (pre-yield) natural period T and damping ratio ζο for large ensembles of judicially selected GMs [20]. Despite the availability of R-μ-Τ relationships for several different hysteretic force-deformation laws, codes of practice adopt R values pertaining to elastic perfectly-plastic SDOF oscillators known to yield conservative results for design purposes [21,22].
Structural Safety 72 (2018) 84–98
application of RHA for large ensembles of GMs [26] commonly considering bilinear hysteretic SDOF oscillators [27] consistent with capacity curves obtained from pushover analyses of MDOF systems [16]. On the other hand, damping adjustment factors for inelastic seismic demand estimation are derived through linearization techniques seeking to determine an equivalent linear SDOF system (ELS) with effective linear properties (ELPs), natural period Tef>T, (or, equivalently, natural frequency ωef=2π/Tef), and damping ratio ζef>ζο, such that its
peak response under seismic excitation matches the peak response of an inelastic SDOF oscillator with pre-yield period T and damping ζο under the same excitation. Early linearization techniques assumed ductility-dependent secant stiffness at maximum displacement to define Tef using the geometry of bilinear force-deformation loops reaching some ductility μ under harmonic excitation (e.g., [24,28]). Then, ductility-dependent ζef is defined by enforcing equality criteria between the dissipated energy in the inelastic oscillator and in the ELS (e.g., [29 and references therein]). Nevertheless, secant stiffness-based linearization techniques were found to be deficient for displacement-based design and assessment (e.g., [14,30]). Therefore, numerous alternative linearization approaches yielding larger effective stiffness values from the secant stiffness have been developed for the task based on RHA of inelastic SDOF oscillators for large ensembles of recorded GMs (see e.g., [31,32,33 and references therein]). Some of these linearization approaches apply signal processing tools to the nonlinear response time-histories to define Tef such as Fourier-based peak picking [34] and wavelet analysis [35], while others consider statistical fitting of heavily damped linear response spectra to inelastic spectra (e.g., [25,30,36-38]).
Structural Safety 72 (2018) 84–98
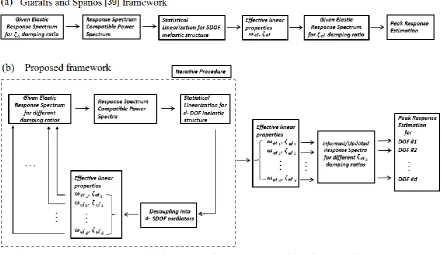
Figure 1. (a) Stochastic dynamics framework for SDOF inelastic oscillators (Giaralis and Spanos 2010), (b) Proposed stochastic dynamics framework for MDOF inelastic structures.
[image:6.595.73.516.77.332.2]Structural Safety 72 (2018) 84–98
the basic definition of the response/design spectrum which necessitates the considered linear/linearized oscillators and the imposed elastic response UHS to share the same damping premises. Clearly, the proposed approach treats in a rigorous and consistent manner, this well-detected critical point which has not received so far the appropriate attention in the literature. This is achieved by using different damping modification factors for each DOF j (see Figure 1(b)). The achieved consistency of the damping ratio of the input heavily damped spectrum with the damping ELPs enhances the accuracy of the inelastic seismic demand estimates as demonstrated in the numerical part of this work through pertinent nonlinear RHA in a Monte Carlo-based context.
It is noted in passing that the scope and steps involved of the herein developed framework are very different from the reliability-based tail statistical linearization approach proposed by Der Kiureghian and Fujimura [45]. The latter approach admits as input stochastic models consistent with magnitude-epicentral distance earthquake scenarios used to define the seismic action in beyond-codes-of-practice seismic design and assessment. On the other hand, the herein framework is tailored to facilitate code-compliant seismic demand estimation using linear UHS along with the well-established concept of damping modification factors to specify the seismic input action and aims to relax heuristic approximating assumptions made by current code-prescriptive simplified methods while being considerably less computationally demanding compared to nonlinear RHA for UHS compatible GMs.
In the remainder of this paper Section 2 reviews the mathematical background supporting the proposed framework, Section 3 presents an implementation algorithm of the framework and furnishes pertinent comments on its assumptions and practical usage, Section 4, presents a numerical application of the framework to a yielding building frame exposed to the Eurocode 8 UHS [11] and assesses its accuracy against nonlinear RHA data, and Section 5 summarizes main conclusions.
2 MATHEMATICAL BACKGROUND
This section reviews the mathematical details involved in undertaking the steps of (i) defining a power spectrum compatible in the median sense with a given seismic response spectrum, of (ii) applying the standard statistical linearization to a d-DOF inelastic structure to derive an equivalent linear d-DOF system, and of (iii) decoupling the previous equivalent linear system into d number of linear SDOF oscillators. Special attention is focused on discussing the various simplifications and assumptions made in support of numerical efficiency. The latter consideration is important in minimizing the computational cost/time of the framework in Figure 1(b) which requires the iterative application of the above three steps.
2.1Derivation of response spectrum compatible power spectra
Structural Safety 72 (2018) 84–98
[46], and utilized by Giaralis and Spanos [39,42] to obtain response spectrum compatible power spectra utilized in the statistical linearization-based approach summarized in Figure 1(a). It theoretically stems from the work of Vanmarcke [47] and relies on well-established concepts from the theory of linear random vibrations.
Specifically, consider the response displacement process 𝑋𝑖(𝑡) of a quiescent linear damped
SDOF oscillator base excited by the process α̈g(t). The nth order steady-state response spectral moment reads as (e.g., [48])
𝜆𝑛,𝑋𝑖 = ∫ 𝜔𝑛
∞
0
1
(𝜔𝑖2− 𝜔2)2+ (2𝜁
𝑜𝜔𝑖𝜔)2𝐺𝑋𝑖
𝜁𝑜(𝜔)𝑑𝜔, (1)
where 𝜔𝑖 and 𝜁𝑜 are the natural frequency and the critical damping ratio of the SDOF oscillator,
respectively, while 𝐺𝑋𝜁𝑖𝑜(𝜔) is the one-sided power spectrum of the excitation process. Note that the above spectral moments do not account for the transient part of the response process. However, it has been numerically shown (e.g., [42]) that for SDOF oscillators with damping ratios 𝜁𝑜≥ 5% and natural periods 𝑇𝑖 = 2𝜋/𝜔𝑖 < 1.5𝑠, which are mostly pertinent in the
analysis of ordinary low-to-mid-rise building structures, the response spectral moments determined via Eq.(1) are accurate as long as a sufficiently long duration of Ts≥15s is assumed for the underlying stochastic process. Under this assumption, the time-limited power spectrum
𝐺𝑋
𝑖
𝜁𝑜(𝜔) can be related to 𝑆
𝑎(𝜔𝑖, 𝜁𝑜) in a statistical manner via the concept of the “peak factor”
𝜂𝛸𝑖 as in (e.g., [47])
𝑆𝑎(𝜔𝑖, 𝜁𝑜) = 𝜂𝛸𝑖𝜔𝑖
2√𝜆
0,𝑋𝑖 . (2)
In view of the above equation, the peak factor 𝜂𝛸𝑖can be interpreted as the scalar by which the steady-state standard deviation of the process 𝑋𝑖(𝑡) needs to be multiplied to estimate the threshold 𝑆𝑎(𝜔𝑖, 𝜁𝑜)/𝜔𝑖2 below which the peak deformation of the considered stochastically excited SDOF oscillator remains with some pre-specified probability 𝑝. The determination of the peak factor 𝜂𝛸𝑖 requires knowledge of the first-passage probability, that is, the probability that the response process 𝑋𝑖(𝑡) crosses a predetermined threshold for the first time over a given time window. This has been a persistent mathematical problem in stochastic dynamics, but a number of sufficiently accurate for engineering purposes approximations exist. To this end, the peak factor can be estimated by the semi-empirical expression [47]
𝜂𝛸𝑖(𝑇𝑠, 𝑝) = √2 ln{2 𝑣𝛸𝑖[1 − exp [−𝛿𝛸𝑖
1.2√𝜋 ln(2 𝑣
𝛸𝑖)]]}, (3)
where the mean zero crossing rate 𝑣𝛸𝑖 and the spread factor 𝛿𝛸𝑖 of the stochastic response
process 𝑋𝑖(𝑡) are defined as
𝑣𝛸𝑖 = 𝑇𝑠
2𝜋 √
𝜆2,𝑋𝑖
𝜆0,𝑋𝑖(− ln 𝑝) −1 , (4)
Structural Safety 72 (2018) 84–98
𝛿𝛸𝑖 = √1 − 𝜆1,𝑋𝑖
2
𝜆0,𝑋𝑖 𝜆2,𝑋𝑖 , (5)
respectively. For the purposes of this work, it is reasonable to set the probability 𝑝 in Eq.(4) equal to 0.5, such that 𝑆𝑎(𝜔𝑖, 𝜁𝑜) in Eq.(2) is interpreted as the “median” pseudo-acceleration
response spectrum. That is, half of the displacement response spectral ordinates of an ensemble
of stationary samples of duration 𝑇𝑠 compatible with the power spectrum 𝐺𝑋𝑖
𝜁𝑜(𝜔)
lie below
𝑆𝑎(𝜔𝑖, 𝜁𝑜)/𝜔𝑖2 [39,47].
Note that the pseudo-acceleration response spectrum 𝑆𝑎(𝜔𝑖, 𝜁𝑜) appearing in Eq.(2) can
be estimated in a straightforward manner using Eqs. (1-5), given power spectrum 𝐺𝑋 𝑖
𝜁𝑜(𝜔),
duration 𝑇𝑠, and probability p. However, the derivation of a power spectrum 𝐺𝑋𝑖
𝜁𝑜(𝜔)
compatible
in the median sense (i.e., p=0.5) with a given response spectrum 𝑆𝑎(𝜔𝑖, 𝜁𝑜)is appreciably more difficult and requires the solution of the “inverse” stochastic dynamics problem expressed by Eq.(2) (see e.g., [46,49-52]). Herein, the above aim is facilitated by adopting the following approximate formula for obtaining a reliable estimate of the variance of the response process
𝑋𝑖(𝑡) [47]
𝜆0,𝑋𝑖= 𝐺𝑋𝑖
𝜁𝑜(𝜔
𝑖)
𝜔𝑖3 (
𝜋
4𝜁𝑜− 1) +
1
𝜔𝑖4 ∫ 𝐺𝑋𝑖
𝜁𝑜(𝜔)𝑑𝜔
𝜔𝑖
0
. (6)
By substituting Eq.(6) to Eq.(2) and algebraically manipulating yields
𝑆𝛼2(𝜔
𝑖, 𝜁𝑜) = 𝜂𝛸2𝑖𝜔𝑖𝐺𝑋𝑖
𝜁𝑜(𝜔
𝑖) (
𝜋 − 4𝜁𝑜
4𝜁𝑜 ) + 𝜂𝛸2𝑖∫ 𝐺𝑋𝑖
𝜁𝑜(𝜔)𝑑𝜔
𝜔𝑖
0
. (7)
Next, the integral in Eq.(7) is approximated by a sum over the uniform grid of M frequency points 𝜔𝑖 = 𝜔𝑏𝑙 + (𝑖 − 0.5)𝛥𝜔; 𝑖 = 1,2, … M within the range (𝜔𝑏𝑙, 𝜔𝑏𝑢). Finally, the
following formula is reached by solving for the power spectrum evaluated at any frequency point 𝜔𝑖 [46]
𝐺𝑋
𝑖
𝜁𝑜(𝜔
𝑖) =
{
4𝜁𝑜
𝜔𝑖𝜋 − 4𝜁𝑜𝜔𝑖−1(
𝑆𝛼2(𝜔
𝑖, 𝜁𝑜)
𝜂𝛸2𝑖 − 𝛥𝜔 ∑ 𝐺𝑋𝑖
𝜁𝑜(𝜔
𝑞) 𝑖−1
𝑞=1
) , 𝜔𝑏𝑙 < 𝜔𝑖 < 𝜔𝑏𝑢
0, 𝜔𝑖 ≤ 𝜔𝑏𝑙
. (8)
The above formula can be recursively applied for 𝑖 = 1,2, … M to evaluate the ordinates of the
power spectrum 𝐺𝑋𝜁𝑖𝑜(𝜔) at the M-1 frequency points 𝜔𝑖lying 𝛥𝜔 apart in the range (𝜔𝑏𝑙, 𝜔𝑏𝑢). In practice, the lower bound of this range, 𝜔𝑏𝑙, is set equal to the lowest frequency for which Eq.(3) can be defined as discussed in [39]. Further, the upper bound, 𝜔𝑏𝑢 ≥ 𝜔
𝑀, is the cut-off
frequency above which 𝐺𝑋 𝑖
𝜁𝑜(𝜔) attains negligible values. Lastly, it is important to note that the
recursive application of Eq. (8) to obtain 𝐺𝑋 𝑖
𝜁𝑜(𝜔
𝑖) requires an estimate of the peak factor, 𝜂𝛸𝑖
2 ,
for SDOF oscillators with 𝜁𝑜 damping ratio and 𝜔𝑖 natural frequency. Reasonable estimates of
Structural Safety 72 (2018) 84–98
used as a proxy of 𝐺𝑋 𝑖
𝜁𝑜(𝜔) in Eq. (1).Conveniently, both the crossing rate and the spread factor
are independent of the amplitude of spectrum N(ω). Further, they are insensitive to the shape of N(ω) provided that it is sufficiently broad-band compared to the magnitude of the frequency response function (FRF) of the SDOF oscillators with 𝜔𝑖 and 𝜁𝑜 properties (see e.g. [48]). In this respect, Cacciola et al. [48] and Giaralis and Spanos [39] derived power spectra 𝐺𝑋
𝑖
𝜁𝑜(𝜔)
achieving reasonably accurate levels of compatibility with 𝑆𝑎(𝜔, 𝜁𝑜) by assuming analytically
defined power spectral shapes N(ω) widely used to model the seismic strong ground motion in place of 𝐺𝑋𝜁𝑖𝑜(𝜔) in Eq. (1). In this work, the filtered Kanai-Tajimi spectrum defined by [53]
N(𝜔) = (𝜔/𝜔𝑓)
4
(1 − (𝜔/𝜔𝑓)2)2+ 4𝜉
𝑓2(𝜔/𝜔𝑓)2
𝜔𝑔4+ 4𝜉
𝑔2𝜔𝑔2𝜔2
(𝜔𝑔2−
𝜔
2)2+ 4𝜉𝑔2𝜔𝑔2𝜔2
, (9)
is used for the purpose where the parameters 𝜔𝑔, 𝜉𝑔, 𝜔𝑓, and 𝜉𝑓 are constants that need to be judicially assumed. The Kanai-Tajimi parameters 𝜔𝑔 and 𝜉𝑔 related to the soil “stiffness” and “damping” should be selected based on the ground conditions associated with the target response spectrum 𝑆𝑎(𝜔, 𝜁𝑜) (see e.g., [5,54,55]). The parameters 𝜔𝑓 and 𝜉𝑓 in Eq. (9) do not
bear any physical significance: they govern the properties of a high-pass filter used to eliminate the spurious low frequency content allowed by the Kanai-Tajimi spectrum. These parameters can be arbitrarily set provided that 𝜔𝑓, controlling the cut-off frequency of the high-pass filter,
is reasonably low (typically, below π rad/s), while 𝜉𝑓, controlling the “steepness” of the filter in the frequency domain, is relative high (typically, above 0.80).
As a final remark, it is noted that the herein discussed approach is only one of the numerous proposed in the literature for the derivation of response spectrum compatible stationary power spectra in the median sense (see e.g., [49-51]). Regardless of the method used for this derivation, it is highlighted that the time-limited stationary power spectrum (and underlying stochastic process) is only used as a mathematical instrument to represent the seismic input action, defined in terms of a pseudo-acceleration response spectrum, in undertaking the statistical linearization step reviewed next. In this regard, the recursive application of Eq. (8) should be viewed only as a necessary “stepping stone” allowing for the application of the stochastic dynamics techniques discussed in the remainder of this section (see also Figure 1).
2.2Statistical Linearization for MDOF nonlinear structures under stationary seismic excitation
Consider a nonlinear structural system with d number of DOFs base-excited by the Gaussian stationary acceleration stochastic process α̈g(t), characterized in the frequency domain by the
power spectrum 𝐺𝑋 𝑖
𝜁𝑜(𝜔). The dynamic response of the structure is governed by the system of
differential equations written in vector-matrix form as
𝐌𝐱̈(𝑡) + 𝐂𝐱̇(𝑡) + 𝐊𝐱(𝑡) + 𝐠[𝐱(𝑡), 𝐱̇(𝑡)] = 𝐅(𝑡). (10)
Structural Safety 72 (2018) 84–98
matrices, respectively, while 𝐠[𝐱(𝑡), 𝐱̇(𝑡)] is a nonlinear (d × 1) vector function of the variables 𝐱(t) and 𝐱̇(t). Lastly, 𝐅(t) = −𝐌𝛄𝑥𝑦−1α̈g(t), is a (d × 1) zero mean, stationary random vector process where 𝛄 is the unit column vector. In this regard, 𝐅(t) can be expressed in the frequency domain by the spectral density matrix
𝐒𝐅𝐅(𝜔) =𝐺𝑋𝑖
𝜁𝑜(𝜔)
𝑥𝑦2 𝐌𝛄𝜸𝑻𝐌. (11)
To this end, the standard spectral matrix solution procedure of the classical statistical linearization [41] is employed to estimate the response power spectral density matrix 𝐒𝐱𝐱(𝜔)
of the nonlinear structure. This is achieved by considering a linearized version of Eq. (10) written as
𝐌𝐱̈(𝑡) + (𝐂 + 𝐂𝐞𝐪)𝐱̇(𝑡) + (𝐊 + 𝐊𝐞𝐪)𝐱(𝑡) = 𝐅(𝑡), (12)
where the (𝑗, 𝑙)𝑡ℎ element of the equivalent linear matrices 𝐂𝐞𝐪 and 𝐊𝐞𝐪 are given by the expressions [56,57]
𝑐𝑗,𝑙𝑒𝑞 = 𝐸 [𝜕𝑔𝑗
𝜕𝑥̇𝑙], (13)
and
𝑘𝑗,𝑙𝑒𝑞 = 𝐸 [𝜕𝑔𝑗
𝜕𝑥𝑙], (14)
in which E[∙] is the mathematical expectation operator. The expressions in Eqs. (13) and (14) are derived by minimizing the difference (error) between the nonlinear system of equations in Eq. (10) and the linear system of equations in Eq. (12) in the mean square sense and by utilizing the standard assumption that the response process vector 𝐱(𝑡) is Gaussian [41]. In this respect, the herein adopted statistical linearization approach approximates the response spectral density matrix of the nonlinear structure via the well-known frequency domain input-output relationship for linear systems [41]
𝐒𝐱𝐱(𝜔) = 𝐇𝐱(𝑖𝜔)𝐒𝐅𝐅(𝜔)𝐇𝐱∗(𝑖𝜔), (15)
where the superscript (*) denotes Hermitian transposition and the FRF matrix is defined as
𝐇𝐱(𝑖𝜔) = [[(𝐊 + 𝐊𝐞𝐪) + 𝐌(𝑖𝜔)2] + 𝑖𝜔(𝐂 + 𝐂𝐞𝐪)]
−1
, (16)
where i is the imaginary unit. Moreover, the Gaussian assumption for 𝐱(𝑡) facilitates significantly the derivation of closed-form expressions for the integrals in Eqs. (13) and (14) for a variety of nonlinear functions 𝐠[𝐱(𝑡), 𝐱̇(𝑡)] used to model the inelastic response of seismically excited yielding structures (see e.g., [39,42]). For any such nonlinear/hysteretic model, the expressions in Eqs. (13) and (14) involve the response displacement and velocity covariance matrix terms determined by
𝐸[𝑥𝑗(𝑡)𝑥𝑙(𝑡)] = ∫ 𝑆𝑥𝑗𝑥𝑙
∞
− ∞
(𝜔) 𝑑𝜔 𝑎𝑛𝑑 𝐸[𝑥̇𝑗(𝑡)𝑥̇𝑙(𝑡)] = ∫ 𝜔2𝑆𝑥𝑗𝑥𝑙
∞
− ∞
Structural Safety 72 (2018) 84–98
where 𝑆𝑥𝑗𝑥𝑙(𝜔) is the (𝑗, 𝑙)𝑡ℎ element of the response power spectrum matrix 𝐒𝐱𝐱(ω) in Eq. (15).
In this setting, the adopted statistical linearization scheme proceeds by solving the system of algebraic nonlinear equations in Eqs. (13-17). Any qualified nonlinear optimization algorithm may be employed for this task. Nevertheless, it is found that a simple iterative while-loop is sufficient to simultaneously satisfy Eqs. (13-17) until convergence of the elements of
𝐂𝐞𝐪 and 𝐊𝐞𝐪 matrices is achieved within a pre-specified tolerance [41]. These iterations are initialized by neglecting the 𝐂𝐞𝐪 and 𝐊𝐞𝐪 matrices in Eq. (16) in determining the covariance
matrix terms in Eq. (17), which are then used to compute the elements of 𝐂𝐞𝐪 and 𝐊𝐞𝐪 via Eqs.
(13) and (14).
The above statistical linearization step provides estimates of the normalized by xy
relative displacement and velocity auto-covariance terms for each j=1,2,…,d DOF of the nonlinear structure exposed to the response spectrum compatible power spectrum. These estimates are given as
𝐸[𝑥𝑗2(𝑡)] = ∫ (|H𝑥j1(𝑖𝜔)| 2
m12+ |H𝑥j2(𝑖𝜔)| 2
m22+ ⋯ + |H𝑥jd(𝑖𝜔)| 2
md2) xy−2 ∞
0 𝐺𝑋𝑖
𝜁𝑜(ω)dω, (18)
and
𝐸[𝑥̇𝑗2(𝑡)] = ∫ 𝜔2(|H𝑥j1(𝑖𝜔)| 2
m12+ |H𝑥j2(𝑖𝜔)| 2
m22+ ⋯ + |H𝑥jd(𝑖𝜔)| 2
md2) x y −2 ∞ 0 𝐺𝑋 𝑖
𝜁𝑜(ω)dω, (19)
respectively. Note that in Eqs.(18-19) the contributions of the off-diagonal terms (cross-terms) to calculating the mean square have been neglected, as their values are relatively negligible compared to the ones corresponding to the diagonal terms; see [53] and [59] for detailed discussions. From a computational implementation perspective, this is equivalent to considering a diagonal excitation power spectrum matrix in Eq.(11) of the form 𝐒𝐅𝐅(𝜔) =
𝐺𝑋𝑖𝜁𝑜(𝜔) 𝑥𝑦2 𝐌
𝟐. The decoupling step reviewed in the next section utilizes the auto-covariances in
Eqs. (18) and (19) to define linear SDOF oscillators with effective damping and natural frequency properties corresponding to each individual DOF.
2.3Decoupling of the equivalent linear system and derivation of effective linear properties (ELPs)
Following the work of Kougioumtzoglou and Spanos [44], the equivalent linear system with d DOFs in Eq. (12) is next decomposed into d number of auxiliary SDOF linear oscillators each one assigned to a different DOF. It is assumed that all the auxiliary SDOF oscillators are base-excited by the same response spectrum compatible acceleration process, α̈g(t), considered
in deriving the equivalent linear system via statistical linearization. In this respect, for the 𝑗𝑡ℎ DOF (j=1,2,…, d), the equation of motion of the auxiliary SDOF oscillator reads as
𝑞̈j(𝑡) + 2ζef𝑗ωef𝑗𝑞̇j(𝑡) + ωef2𝑗𝑞
j(𝑡) = −𝑥𝑦−1 α̈g(t), (20)
where 𝑞̈j(𝑡), 𝑞̇j(𝑡), and 𝑞j(𝑡) are the relative response acceleration, velocity, and displacement
Structural Safety 72 (2018) 84–98
effective natural frequency and damping ratio, respectively. These two effective linear properties (ELPs) characterizing each auxiliary SDOF oscillator are derived by the following two statistical conditions: the displacement and velocity response variances, 𝐸[𝑞𝑗2(𝑡)] and
𝐸[𝑞̇𝑗2(𝑡)], respectively, of the auxiliary oscillator corresponding to the 𝑗𝑡ℎ DOF are equal to the
displacement and velocity response variances of 𝑗𝑡ℎ DOF of the equivalent linear MDOF given by Eqs. (18) and (19), respectively. Mathematically, these conditions are written as
𝐸[𝑥𝑗2(𝑡)] = 𝐸[𝑞
𝑗2(𝑡)] = ∫ |H𝑥ef𝑗(𝑖𝜔)|
2
xy−2
∞
0
𝐺𝑋
𝑖
𝜁𝑜(𝜔)𝑑𝜔 = 𝜆
0,𝑞𝑗xy−2, (21)
and
𝐸[𝑥̇𝑗2(𝑡)] = 𝐸[𝑞̇
𝑗2(𝑡)] = ∫ 𝜔2|H𝑥ef𝑗(𝑖𝜔)|
2
xy−2
∞
0
𝐺𝑋𝜁𝑖𝑜(𝜔)𝑑𝜔 = 𝜆
2,𝑞𝑗xy
−2, (22)
where
𝐻𝒙
ef𝑗(𝑖𝜔) =
1
[(𝑖𝜔)2+ 𝑖2ζ
ef𝑗ωef𝑗𝜔 + ωef𝑗
2 ]. (23)
To this end, Eqs. (21) and (22) in conjunction with Eqs. (18) and (19) constitute a nonlinear system of two algebraic equations which are solved for the two ELPs ωef𝑗 and ζef𝑗 for each DOF. As in the case of the statistical linearization step, any nonlinear optimization algorithm can be used to find the ωef𝑗 and ζef𝑗 that satisfy simultaneously the conditions in Eqs. (21) and (22). Alternatively, the two conditions may be satisfied through a standard iterative updating “while-loop” until convergence of the properties is achieved within some pre-specified tolerance.
Overall, for a d-DOF structure, a d number of 2x2 systems of nonlinear equations in Eqs. (21) and (22) need to be solved to derive d pairs of ELPs. In this manner, the MDOF equivalent linear system in Eq. (10) is decoupled into d SDOF linear oscillators. From a theoretical viewpoint, it is important to note that the above decoupling is very different from the one achieved by the well-known modal decomposition of linear structural dynamics which has been considered in conjunction with different statistical linearization schemes (e.g., [41,58]). In particular, note that the 𝑞j(𝑡) response processes in Eq. (20) are not modal coordinates. Rather, they are direct estimates of the nonlinear normalized response displacement processes corresponding to each DOF of the nonlinear structure in Eq. (10) excited by a response spectrum compatible power spectrum.
Structural Safety 72 (2018) 84–98
system depending on the excitation intensity by taking on values in alignment with engineering intuition. For instance, stronger nonlinear response due to either a weaker structure and/or higher excitation intensity leads to heavier damped and/or more flexible auxiliary SDOF oscillators characterized by lower ωef𝑗 and higher ζef𝑗 values [42,44,60]. In this regard, the effective natural frequency ωef𝑗 has been considered in previous works to facilitate tracking and avoiding moving resonance phenomena [44,61,62], as well as to develop efficient approximate techniques for determining nonlinear system survival probability and first-passage probability density functions (e.g., [63,64]).
In this work, the above discussed attributes of the ELPs motivate their use to estimate the peak response of a given nonlinear MDOF structure exposed to a linear response spectrum
𝑆𝑎(𝜔𝑖, 𝜁𝑜) as have been originally considered in [39] and [42] for the case of nonlinear SDOF
systems. That is, by simply “reading” the linear spectral ordinates from the excitation response spectrum for all different ωef𝑗 and ζef𝑗 corresponding to DOFs j=1,2,…,d (see also Figure 1). Conveniently, these spectral ordinates correspond to peak structural responses associated with each DOF and therefore no modal combination is required. The next section details the implementation of the framework in Figure 1(b) for response spectrum-based analysis of inelastic MDOF structures relying on the iterative application of the three steps discussed in this section.
3 IMPLEMENTATION OF PROPOSED FRAMEWORK
The three steps reviewed in the previous section are herein combined in a novel fashion to provide estimates of the peak inelastic response of nonlinear MDOF structures subject to a linear response spectrum 𝑆𝑎(𝜔, 𝜁𝑜) without resorting to RHA. At the heart of the proposed approach lies the novel idea of iteratively updating the nominal damping ratio 𝜁𝜊 of the input response spectrum by the effective damping properties, ζefj, obtained for each DOF until
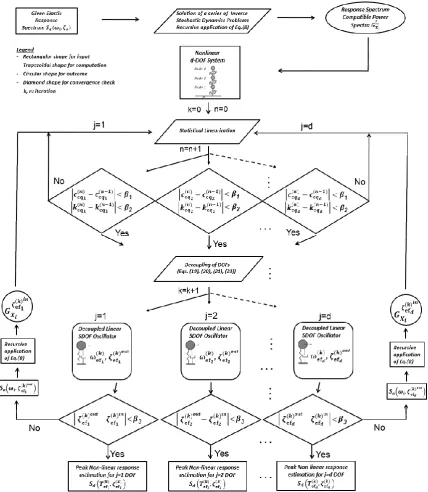
convergence. In this manner, input/output consistency of the damping ratio for each DOF is achieved. As will be evidenced in the next section in view of pertinent numerical results, this consistency provides improved accuracy of the peak inelastic response estimated for each DOF by 𝑆𝑎(ωef𝑗, ζef𝑗) upon convergence of the proposed iterative procedure. In this section, the step-by-step implementation of the proposed stochastic dynamics framework in Figure 1(b) is presented with the aid of the flowchart in Figure 2, followed by a discussion on a number of important practical considerations in the application of the framework.
3.1 Mechanization of the framework
The proposed framework assumes as input an elastic response spectrum for a pre-specified damping ratio 𝜁𝜊 as well as the equations of motion of the d-DOF nonlinear structure to be
analyzed. It initializes by deriving a single response spectrum compatible power spectrum
(13-Structural Safety 72 (2018) 84–98
17) using an iterative while-loop scheme. Convergence of the statistical linearization solution is assumed once the difference of all the elements of the 𝐂𝐞𝐪 and 𝐊𝐞𝐪 matrices lie below some small pre-specified thresholds β1 and β2, respectively. Next, the decoupling step detailed in section 2.3 is applied to derive d sets of ELPs ωef𝑗 and ζef𝑗, each one corresponding to a particular j=1,2,…,d DOF, taking as input the variances in Eqs. (18) and (19) derived from the statistical linearization step. Subsequently, a convergence check is made separately for each DOFto ensure that the difference between the damping ratio assumed in the definition of the input response spectrum and the derived effective damping ratio lies below a small pre-specified threshold β3. In this first passage, the aforementioned check shown in Figure 2 as
|ζef
𝑗
(𝑘)− ζ ef𝑗
(𝑘−1)|<
β3 reads as |ζef 𝑗
(1)− 𝜁
𝜊|< β3 as a single response spectrum with the (given)
damping ratio 𝜁𝜊 applies. If the structure yields, this check will not be satisfied at this stage for
any DOF. To this end, an updated response spectrum 𝑆𝑎(𝜔, ζef 𝑗
(1))
is defined, different for each
DOF, and d different power spectra, 𝐺𝑋 𝑖
ζef𝑗(1)
(𝜔), are computed using Eq. (8). Next, statistical linearization and decoupling steps are undertaken for all the different power spectra derived
and a single check |ζef
𝑗
(2)− ζ ef𝑗
(1)|<
β3 is made for each 𝐺𝑋 𝑖
ζef𝑗(1)
(𝜔) corresponding to the particular j DOF. The damping ratio in defining the input response spectrum is updated for those DOFs that damping ratio convergence was not achieved and the procedure is repeated individually
for these DOFs until convergence of ζef 𝑗
(𝑘)
with ζef
𝑗
(𝑘−1)
values, as shown in Figure 2. Clearly, the
aforementioned procedure establishes a cyclic relationship between the, output, stochastically equivalent damping coefficients of the effective linear SDOF oscillators and the, input, damping ratios of the elastic response spectrum until input/output damping ratio consistency is
achieved for all DOFs of interest. Lastly, once convergence between ζef 𝑗
(𝑘)
and ζef
𝑗
(𝑘−1)
is observed after k iterations for a j DOF, the peak inelastic response corresponding to this DOF can be readily estimated as a function of 𝑆𝑎(𝜔ef
𝑗
(𝑘), ζ ef𝑗
(𝑘)), that is by using the ordinate of the linear input
Structural Safety 72 (2018) 84–98
Figure 2. Implementation flowchart of the proposed framework.
3.2 Discussion
In view of the algorithmic implementation in Figure 2, comments on some important aspects and advantages of the proposed framework are herein discussed. Firstly, seismic excitation is conveniently represented by a linear (pseudo-acceleration) response spectrum, 𝑆𝑎, while the obtained peak inelastic response estimates are statistically consistent with this spectrum in the mean sense. This is achieved by setting the probability p equal to 0.5 in Eq. (4) such that 𝑆𝑎 is
Structural Safety 72 (2018) 84–98
Secondly, the proposed framework assumes the availability of linear spectral ordinates for any damping ratio value 𝜁 ≥ 𝜁𝜊. This requirement stems from the fact that the effective
damping ratios ζef 𝑗
(𝑘)
will be higher from the nominal damping ratio 𝜁𝜊 for yielding structures
since statistical linearization accounts for the hysteretic energy dissipation through increased effective damping ratios [42]. To this end, the accuracy of the peak inelastic response estimates obtained by the proposed approach depends on the accuracy of the damping adjustment factors used to modify the UHS spectral ordinates for the nominal damping ratio 𝜁𝜊. Therefore, dependable damping adjustment factors need to be chosen which should be compatible with the seismotectonic environment for which the response spectrum 𝑆𝑎 is associated with (see e.g., [2,65] and references therein). Conveniently, seismic design codes do include empirical formulae to define heavily damped spectra (see e.g., Eq. (A.2) in the Appendix) and, therefore, the proposed approach can be readily used in conjunction with code-defined UHS in practical applications.
Another important issue of practical concern is the fact that the SDOF oscillators in Figure 2 are associated directly with DOFs of the non-linear structure and not with modal responses of the underlying equivalent linear MDOF system. In this regard, the proposed approach does not involve any modal combination step: all response quantities lie in the physical space allowing for efficient peak response estimation directly from the response spectrum for each DOF. More importantly, the decoupling step can target only a small selected number of DOFs at will (e.g., it may be desired to obtain only the peak top floor lateral displacement in a multi-storey building) without incurring any additional approximation or loss of accuracy (i.e., as would be the case of a truncated modal combination without making use of all modes). This is because the contribution of all DOFs in the equivalent linear system is accounted for in computing the variances in Eqs. (18) and (19) in which all the d response cross-spectral density terms appear. Still, when the peak response for more than one DOFs is sought, the estimated peak responses will not happen at the same time and will not bear any particular sign. Therefore, it is not recommended to combine the peak response estimates a posteriori in an ad hoc fashion to evaluate peak structural responses of interest. For example, in the commonly encountered practical case that peak inter-storey drifts in seismically excited multi-storey buildings need to be computed, these should not be evaluated by subtracting peak floor displacements. Instead, the equations of motion need to be written directly in terms of the inter-storey drifts as exemplified in the illustrative application in the next section.
Structural Safety 72 (2018) 84–98
with ELP damping from k-1 iteration. Further, the response variances in Eqs. (21) and (22) are found through linearization using the same power spectrum derived based on the ELP damping in k-1 iteration. Convergence, however, may not be monotonic in terms of peak response displacement as in most of the cases displacement spectral ordinates increase for oscillators with lower natural frequencies (longer periods), while statistical linearization to hysteretic structures of the softening kind yields equivalent linear oscillators with natural frequencies shifted towards lower frequencies reflecting on a reduced effective stiffness of yielding structures. Further comments on the rate and type of convergence of the herein proposed iterative procedure are included in the following section in view of pertinent numerical data. As a final remark, note that convergence of the above iterative procedure assigns response spectra of different damping ratios to each DOF which may be seen as counter-intuitive. Nevertheless, the variation of the damping ratios across different DOFs ensures that the value of ζef𝑗 found for each individual DOF is properly mapped onto a family of consistent input response spectral curves for different damping ratios and vice versa. Further, this variation is a consequence of the decoupling of the DOFs achieved by the adopted statistical criteria in Eqs. (21) and (22) and should be interpreted as a weighting factor applied consistently to the input earthquake excitation in a similar manner that participation factors scale differently the input seismic action for each mode in the standard modal response spectrum-based method of analysis for linear MDOF structures.
4 ILLUSTRATIVE APPLICATION
In this section the stochastic dynamics approach of Figure 2 is numerically illustrated by considering a yielding multi-storey frame structure subject to the Eurocode 8 elastic response spectrum [11] provided in the Appendix. Peak inelastic inter-storey drifts are derived by using ELPs in conjunction with the excitation response spectrum. The achieved accuracy of the predicted peak mean drifts is quantified by comparison with pertinent results derived from nonlinear RHA for an ensemble of time-histories compatible with the considered Eurocode 8 response spectrum. The presentation starts with a description of the adopted structure.
4.1Inelastic frame structure
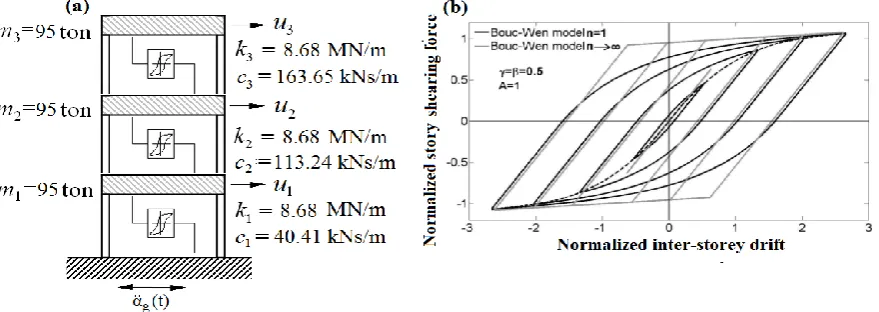
The three-story non-classically viscously-damped inelastic shear frame shown in Figure 3(a) is considered to exemplify the proposed approach. The lumped mass at the j-thfloor, mj, and the stiffness and damping coefficients of the j-th story, kj and cj, respectively, are reported in Figure 3(a) for j= 1,2,3. The inelastic behavior of the shear frame is governed by a hysteretic relationship between the resisting story shearing force and the inter-story drift. The same relationship is assumed for all three stories. Under these modelling assumptions, the resisting shearing force of the j-thstory is given as the sum of an elastic and a hysteretic part as
Structural Safety 72 (2018) 84–98
where 𝛼 is the post-yield to pre-yield stiffness ratio, 𝑦𝑗(t) is the inter-story drift normalized by
the yielding displacement 𝑥𝑦, that is, 𝑦𝑗(t) = (𝑢𝑗− 𝑢𝑗−1)/𝑥𝑦 where 𝑢𝑗, j=0,1,2,3 is the lateral
floor displacement relative to the ground displacement with 𝑢0=0 (Figure 3(a)), and z𝑗(t) is a hysteretic state variable. In all the ensuing numerical work 𝛼 is taken equal to 0.15 and the yielding displacement 𝑥𝑦 is taken equal to 5cm.
Further, the parametric Bouc-Wen model [66] is adopted to govern the hysteretic storey shearing force versus normalized inter-storey drift relationship. This model has been used to capture the inelastic response of seismically excited frame structures (e.g., [67,68]), as the one herein considered, as well as of yielding structural components (e.g., [69]). This is due to its versatility to represent a wide range of hysteretic force-deformation experimental data from cyclic/seismic testing of structures and structural components (see e.g., [70]). The adopted model is herein introduced through the nonlinear differential equation
żj(t) = {Αẏj(t) − βẏj(𝑡)|zj(𝑡)|
n
− γ|ẏj(𝑡)|zj(𝑡)|zj(𝑡)|
n−1
}, (25)
where parameters Α, β, γ control the shape and the exponent n controls the smoothness of the hysteretic loops between the state variable z and, consequently, the shear force in Eq. (24) and the normalized inter-storey drift. In this work, the following values are adopted for the Bouc-Wen parameters Α = 1, β = γ = 0.5, n = 1 to represent a smooth softening hysteretic behavior [66]. The backbone curve of the adopted Bouc-Wen model is plotted in Figure 3(b) (broken black curve) together with four hysteretic loops for different peak inter-storey drifts normalized to xy obtained under harmonic excitation for steady-state conditions. It is seen that the model exhibits hysteresis even for drifts smaller than the nominal yielding deformation xy (see [70] for a detailed discussion). Consequently, effective damping ratios with ζef𝑗 > 𝜁𝜊 are expected by application of statistical linearization even for excitations that will not deform the structure beyond the nominal xy as discussed in [71] for the case of SDOF Bouc-Wen inelastic oscillators. Note that this is not the case of non-smooth idealized hysteretic models such as the bilinear model for which no hysteretic damping is exhibited unless x>xy [42]. For comparison,
hysteretic loops of the non-smooth Bouc-Wen model computed by setting n=15 are plotted in Figure 3(b) (continuous grey curves).
[image:19.595.81.521.578.734.2]Structural Safety 72 (2018) 84–98
4.2 Equations of motion for the non-linear and for the equivalent linear system
The equations of motion for the inelastic 3-storey frame in Figure 3(a) base excited by a stationary seismic acceleration process α̈g(t) can be written in the form of Eq. (10) by collecting in vector x the normalized by the yielding displacement inter-storey drifts and the hysteretic state variables for the three stories as
𝐱𝐓 = {y
1 y2 y3 z1 z2 z3}, (26)
where the superscript “T” stands for matrix transposition. Then, the mass matrix in Eq. (10) is written as
𝐌 = [𝐌𝟎𝟏𝟏 𝟎3x3
3x3 𝟎3x3], (27)
where
𝐌𝟏𝟏 = [
m1 0 0
m2 m2 0
m3 m3 m3
], (28)
and 𝟎3x3 is the 3-by-3 zero matrix, while the damping matrix is written as
𝐂 = [𝟎𝐂𝟏𝟏 𝟎3x3
3x3 𝚰𝟑𝒙𝟑], (29)
where
𝐂𝟏𝟏 = [
c1 −c2 0
0 c2 −c3
0 0 c3], (30)
and 𝐈3x3 is the 3-by-3 identity matrix. Further, thestiffness matrix becomes
𝐊 = [𝟎𝐊𝟏𝟏 𝐊𝟏𝟐
3x3 𝟎3x3], (31)
where
𝐊𝟏𝟏 = [
αk1 −αk2 0
0 αk2 −αk3
0 0 αk3
], (32)
and
𝐊𝟏𝟐 = [
(1 − α)k1 −(1 − α)k2 0
0 (1 − α)k2 −(1 − α)k3
0 0 (1 − α)k3
]. (33)
Lastly, the vector g in Eq. (10) is written as
𝐠𝐓[𝐱(𝑡), 𝐱̇(𝑡)] = {0 0 0 −𝑔
1[ẏ1(𝑡), z1(𝑡)]−𝑔2[ẏ2(𝑡), z2(𝑡)] −𝑔3[ẏ3(𝑡), z3(𝑡)]}. (34)
where
𝑔𝑗[ẏ𝑗(𝑡), z𝑗(𝑡)] = ż𝑗(𝑡), (35)
and the forcing vector reads as
𝐅(t)T = {𝑓
Structural Safety 72 (2018) 84–98
where 𝑓𝑗(t) = −𝑚𝑗α̈g(t)/𝑥𝑦.
Upon application of the standard statistical linearization, the equivalent linear matrices appearing in Eq. (12) take the form [41]
𝐂𝐞𝐪= [𝐂𝐂𝐞𝐪𝟏𝟏 𝐂𝐞𝐪𝟏𝟐
𝐞𝐪𝟐𝟏 𝐂𝐞𝐪𝟐𝟐], (37)
where
𝐂𝐞𝐪𝟏𝟏= 𝐂𝐞𝐪𝟏𝟐 = 𝐂𝐞𝐪𝟐𝟐 = 𝟎𝟑𝒙𝟑, (38)
and
𝐂𝐞𝐪𝟐𝟏= [
ceq1 0 0
0 ceq2 0
0 0 ceq3
], (39)
and
𝐊𝐞𝐪 = [𝐊𝐊𝐞𝐪𝟏𝟏 𝐊𝐞𝐪𝟏𝟐
𝐞𝐪𝟐𝟏 𝐊𝐞𝐪𝟐𝟐], (40)
where
𝐊𝐞𝐪𝟏𝟏 = 𝐊𝐞𝐪𝟏𝟐= 𝐊𝐞𝐪𝟐𝟏 = 𝟎𝟑𝒙𝟑, (41)
and
𝐊𝐞𝐪𝟐𝟐 = [
keq1 0 0
0 keq2 0
0 0 keq3
]. (42)
The elements ceqj and keqj are given by the following closed-form expressions applicable for
n=1 [43]
ceqj= √2
π [
γ E(ẏjzj)
√E(ẏj2)
+ β√E(zj2)
]
− A , (43)
and
keqj = √2
π [
γ√E(ẏj2) + β E(ẏjzj)
√E(zj2)]
, (44)
respectively.
4.3Derivation of Eurocode 8 compatible ELPs
Structural Safety 72 (2018) 84–98
3(a). The adopted 𝑆𝑎 spectrum is provided in the Appendix and plotted in Figure 4(a) (grey continuous curve) against the natural period T=2π/ω.
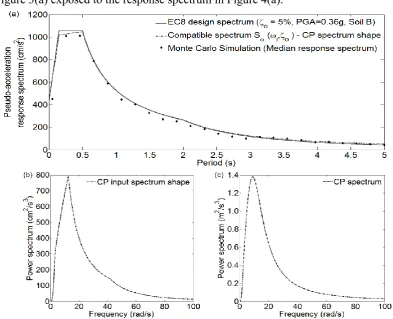
Following the implementation of the proposed framework in Figure 2, a single 𝑆𝑎 compatible power spectrum is first derived using Eq. (8) and is plotted in Figure 4(b). The duration 𝑇𝑠 and the discetization step 𝛥𝜔 are taken equal to 20s and 0.1rad/s, respectively. The parameters assumed in Eq. (9) are 𝜉𝑔 = 0.78, 𝜔𝑔 = 10.78 𝑟𝑎𝑑 𝑠−1, 𝜉𝑓 = 0.90 and 𝜔𝑓 =
2.33 𝑟𝑎𝑑 𝑠−1 which define a Clough-Penzien spectral shape plotted in Figure 4(c) compatible
in the median sense with the herein adopted Eurocode 8 response spectrum derived in [55]. The spectral moments in Eq. (1) are computed using the default quadrature rule of the ‘quad’
built-in MATLAB function. The achieved level of compatibility between the power spectrum
𝐺𝑋𝜁𝑖𝑜(𝜔) and the response spectrum 𝑆
𝑎 is assessed in Figure 4(a) by comparing the given 𝑆𝑎 of
Eurocode 8 with the response spectrum computed by Eq. (2) (broken line). A further assessment is made in terms of the criterion posed by Eq. (2) for p=0.5 as discussed in section 2.1 by undertaking a pertinent Monte Carlo based analysis. Specifically, an ensemble of 1000
stationary signals of 20s duration each compatible with the 𝐺𝑋 𝑖
𝜁𝑜(𝜔) spectrum in Fig. 4(b) are
generated using the spectral representation simulation method [71]. The median response spectrum of these signals are plotted (dotted line) in Figure 4(a). Satisfactory matching between the latter median response spectrum and 𝑆𝑎 is observed which justifies the use of the ELPs derived as discussed below to approximate the peak inelastic inter-storey drifts of the structure in Figure 3(a) exposed to the response spectrum in Figure 4(a).
Figure 4. (a) Adopted Eurocode 8 response spectrum for 5% damping ratio and compatibility assessment with the power spectrum using Eq.(2) and NRHA. (b) Eurocode 8 response spectrum compatible power spectrum obtained by Eq.(8). (c) Clough Penzien spectral shape in Eq.(9) used to
[image:22.595.90.484.397.716.2]Structural Safety 72 (2018) 84–98
Next, standard statistical linearization is applied for the derived power spectrum in Figure 4(b) using Eqs. (15)-(17) and (37)-(44). As discussed in sections 2.2 and 3.1, a simple iterative while-loop scheme is used to satisfy the previous expressions simultaneously, among possible alternatives (see e.g., [73]). The adopted thresholds for checking the convergence are set to β1=β2= 10-4. Subsequently, a set of three 𝜔ef
𝑗
(1)
and ζef 𝑗
(1)
ELPs j=1,2,3 corresponding to the three
inter-storey drifts of the frame structure are derived by application of the decoupling step detailed in section 2.3. Then, three different power spectra compatible with the Eurocode 8
response spectrum given in the Appendix for critical damping ratios ζef 𝑗
(1)
j=1,2,3 are derived
using the same settings as those used to derive the initial 𝐺𝑋 𝑖
𝜁𝑜(𝜔). Next, three different sets of
ELPs for the previous three power spectra are obtained, one for each of the three DOFs and the process is iteratively repeated until the convergence check |ζef
𝑗
(𝑘)− ζ ef𝑗
(𝑘−1)|<
β3 is satisfied for
[image:23.595.78.509.313.668.2]all j=1,2,3. For illustration purposes, a very small β3= 10-4 threshold has been adopted in the analysis.
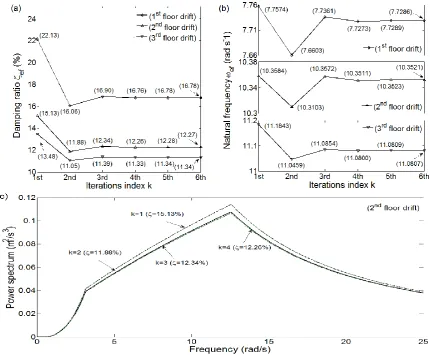
Figure 5. Effective natural frequency and damping ratio elements from successive iterations.
To illustrate the convergence achieved, the derived ELPs 𝜔ef 𝑗
(𝑘)
and ζef 𝑗
(𝑘)
are plotted in Figures
Structural Safety 72 (2018) 84–98
convergence is achieved after 3 iterations for all DOFs, but, as discussed in section 3.2, convergence is not monotonic. In particular, a single application of the statistical linearization and decoupling steps (k=1) overestimates ELPs for all DOFs. Upon updating the damping ratio of the response spectrum, different input power spectra for each DOF are derived yielding smaller ELP values (k=2), a further small adjustment towards higher values in the ELPs occurs in the subsequent iteration (k=3) and ELPs (as well as the input power spectra) remain practically unchanged for k>3 (convergence). It is noted that the effective natural frequency values do not fluctuate significantly; this is why they are not considered in checking for convergence. It is further important to note that the obtained ELPs are consistent with engineering intuition: softer and heavier damped effective SDOF oscillators are assigned to the floors (DOFs) that yield more (see Figure 7 for a verification based on NRHA), while effective damping ratios drop for input power spectra of reduced intensity reflecting on less energy dissipated through weaker nonlinear behavior. These observations confirm that the obtained ELPs by application of the proposed framework to inelastic MDOF structures bear physical significance as previously reported in [42] for the case of inelastic SDOF systems.
4.4Peak inelastic response estimation using the ELPs and assessment via nonlinear RHA
Upon convergence of the effective damping ratios (i.e., |ζef 𝑗
(𝑘)− ζ ef𝑗
(𝑘−1)|
< β3), the obtained
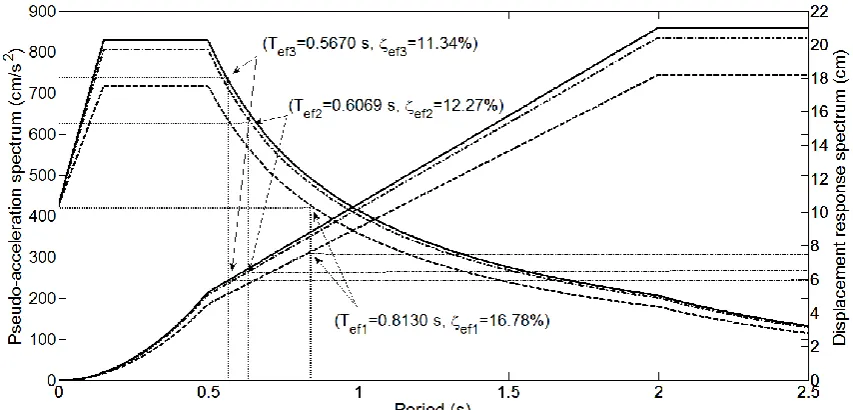
pairs of ELPs are used to estimate the peak inter-storey drifts of the shearing frame in Figure 3(a) in conjunction with the input Eurocode 8 elastic response spectrum. This is pictorially shown in Figure 6 where the Eurocode 8 spectrum is plotted against the natural periodfor the three different values of damping ratio ζef
𝑗
(6)
, j=1,2,3 found, in terms of spectral acceleration,
𝑆α, left vertical axis, and in terms of spectral displacement, 𝑆α/𝜔2, right vertical axis. The three
peak inelastic inter-storey drifts are read on the right vertical axis using the (Tef𝑗 =
2𝜋 𝜔ef
𝑗
(6)
⁄ , ζef
𝑗
(6)
) pairs indicated on the figure. All estimated drifts are above the considered yielding drift of 5cm which indicates that the structure enters well into the inelastic range (see also Figure 3(b) and discussion on the assumed smooth Bouc-Wen model). It is seen that drifts decrease with height, which is expected from a shear-type frame with uniformly distributed mass in elevation, even though higher effective damping ratios, ζef𝑗, are found for the effective SDOF oscillators assigned to the lower floors. Evidently, this is associated with ωef𝑗 taking on lower values, or equivalently Tef𝑗 becoming longer at lower floors leading to increase
Structural Safety 72 (2018) 84–98
Figure 6. Peak inter-storey drifts estimation using the ELPs for k=6 in Figure 5 in conjunction with the Eurocode 8 response spectrum of the Appendix for different damping ratios.
To further assess the accuracy of the above derived peak response estimates, nonlinear RHA for an ensemble of 5000 artificial acceleration time-histories compatible in the mean sense with the Eurocode 8 elastic response spectrum for 5% damping is conducted. Specifically, the considered time-histories are non-stationary in amplitude: an arbitrarily chosen time-history out of the ensemble is plotted in Figure 7(a). Their average and median response spectra achieve a good level of matching with the Eurocode 8 spectrum as shown in Figure 7(b). These time-histories are derived by first generating 5000 stationary realizations compatible with the Clough-Penzien spectrum in Figure 4(c) using the spectral representation method [72]. Next, these realizations are multiplied by an envelope function in time derived in [55] to achieve average spectral matching with the herein considered Eurocode 8 spectrum. Lastly, the nonlinear differential equations of motion in Eq. (10) are numerically integrated for the above ensemble via a standard fourth order Runge-Kutta algorithm, for x, M, C, K, g, and F defined in Eqs. (26)-(36).
[image:25.595.78.521.547.666.2]
Structural Safety 72 (2018) 84–98
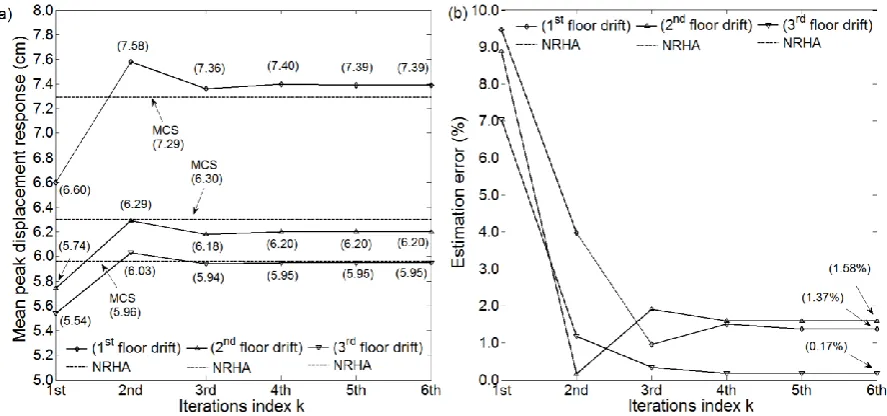
Figure 8. Comparison of peak inter-storey drift estimates obtained from the proposed method for different iterations with ensemble average peak inter-storey drifts from NRHA. (a) Absolute values, (b) Percentage difference (error).
Figure 8(a) compares the ensemble average of the peak response inter-storey drifts obtained from NRHA within a Monte Carlo simulation context (treated as “accurate” values hereafter), with the inter-storey drifts estimated using the ELPs reported in Figures 5(a) and 5(b) in conjunction with the excitation Eurocode 8 response spectrum as illustrated in Figure 6. Further, Figure 8(b) reports the percentage error between the inter-storey drifts from nonlinear RHA with those obtained by the proposed method for all 6 iterations performed. It is seen that enhanced accuracy compared to nonlinear RHA results is achieved for the DOFs (stories) exhibiting milder nonlinear behavior. The latter can be gauged through the average ductility demand obtained from nonlinear RHA results as 7.29/5= 1.46, 6.30/5= 1.26, and 5.96/5= 1.19 for the 1st, 2nd, and 3rd story, respectively. This observation is in perfect alignment with pertinent numerical results reported in [42] for bilinear hysteretic SDOF oscillators and in [71] for Bouc-Wen SDOF oscillators for a wide range of ductility demands using ELPs derived by the same statistical criteria in Eqs. (21) and (22) for peak inelastic response estimation. The fact that accuracy deteriorates with stronger nonlinearity is readily attributed to the well-studied in the literature level of accuracy with which statistical linearization approximates inelastic response statistics in Eqs. (18) and (19) (see e.g. [41] and references therein).
Nevertheless, the most important observation in Figure 8 is the remarkable improvement of accuracy achieved through the iterative updating of the excitation response spectrum based on the equivalent damping ratio for each DOF. In particular, the accuracy improves by about one order of magnitude upon convergence (i.e., for k>=3), compared to the results obtained by a non-iterative application the framework (i.e., a single passing through the three steps reviewed in section 2). Even more important is the fact that this improvement does not depend on the level of nonlinearity exhibited. For example, the same reduction by 84% to the estimation error for both the 1st and 2nd story drifts between no response spectrum updating
(k=1) and 5 times response spectrum updating (k=6) is noted, even though the 1st floor exhibits
[image:26.595.77.521.71.279.2]Structural Safety 72 (2018) 84–98
the accuracy of the proposed stochastic dynamics framework in comparison with pertinent Monte-Carlo simulation-based results derived by nonlinear RHA.
5 CONCLUDING REMARKS
A computationally efficient nonlinear stochastic dynamics based framework has been proposed for estimating the peak inelastic response of hysteretic MDOF structural systems subject to a given family of linear response UHS defined for various damping ratios through modification factors, without the need to undertake nonlinear RHA. The proposed framework initiates by the derivation of a power spectrum representing a time-limited stationary process compatible with the given response spectrum for a nominal damping ratio treated as the median spectrum. Next, estimates of second-order response statistics for a considered inelastic MDOF structure are obtained through standard statistical linearization for the derived power spectrum. Then, for each DOF of interest of the MDOF structure, an effective linear SDOF oscillator is defined such that it has the same response displacement and velocity variance with those of the MDOF structure estimated by the statistical linearization step. The above three steps are repeated iteratively for each monitored DOF upon updating the damping ratio of the excitation response spectrum with the effective damping ratio of each linear SDOF whose value reflects on the level of the nonlinearity exhibited by the MDOF structure. Upon convergence of the damping ratio of the response spectrum with the effective damping ratio for each DOF (i.e., equality within some small error), the properties of each effective SDOF oscillator (ELPs) are used together with the excitation response spectrum for different damping ratios to obtain peak response estimates for the MDOF structure.
It has been argued, based on heuristic nonlinear structural dynamics arguments, that convergence of the above novel iterative procedure lying at the core of the proposed framework will be observed for typical yielding seismically excited structures. This has been demonstrated in view of numerical results involving a three-storey shear frame excited by a Eurocode 8 UHS whose nonlinear behavior is modelled by the Bouc-Wen model. Moreover, nonlinear RHA involving an ensemble of 5000 non-stationary accelerograms whose mean response spectrum matches closely the considered Eurocode 8 UHS has been conducted to study the accuracy of the proposed framework. It has been found that the accuracy deteriorates for higher levels of nonlinearity gauged via average peak seismic inter-storey ductility demands for each floor of the frame considered which is consistent with the approximations involved in the statistical linearization step. However, it has been shown that considerably improved accuracy is achieved by the proposed framework through the iterative damping ratio updating procedure, independently of the exhibited level of nonlinearity. The latter observation qualifies the herein proposed approach as a rather advantageous analysis tool for preliminary/cursory seismic design and assessment of yielding structures based on seismic demands posed by a given response spectrum representing the seismic hazard.