978-1-7281-2124-6/19/$31.00 ⓒ2019 IEEE
Abstract— This paper presents the development of models of a real distribution network from Geographical Information System (GIS) data provided by the Distribution Network Operator (DNO) of an area that is likely to see significant electric vehicle (EV) uptake. Using UK Census data with building analysis from Ordnance Survey datasets, likely existing domestic load profiles and likely locations of EV charge points are established. 12 months of data from the 215-vehicle My Electric Avenue EV trial are used to simulate the temporal variation of EV charging for various levels of EV uptake and power flow studies are run to examine the probable impact of EV uptake on a real distribution network in a suburban residential area in Scotland. It is shown that several parts of the network are expected to be faced with severe issues when 70% of vehicles in the area are replaced by EVs. The method presented is general and can be applied to any distribution system for which data is obtained to provide valuable insight as to the network issues that are likely to arise as a result of the uptake of EVs.
Index Terms – Electric Vehicles, Domestic Charging, Monte Carlo, Geospatial Modelling
I. INTRODUCTION
A. Motivation
The UK Government has pledged to outlaw the sale of purely petrol or diesel-powered cars by 2040 [1]. Given the current market dominance of battery Electric Vehicles (EVs) over other alternative forms of private vehicle propulsion such as hydrogen fuel cell-powered vehicles [2], it is reasonable to expect that within the next two to three decades, a significant proportion of Britain’s 31 million cars [3] could be replaced with plug-in EVs; likely a combination of pure battery EVs (BEVs) and plug-in hybrid EVs (PHEVs).
It is anticipated that the majority of EV charging will be carried out at home [4], and this increase in demand is likely to surpass the capabilities of the Low Voltage (LV) network: according to the results of the My Electric Avenue EV trial [5], it has been stated that 32% of local networks are expected to require intervention when 40-70% of customers install their own charge points.
However, the potential problems caused by EVs are very area-specific due to the varying characteristics between different distribution networks – both electrically and socio-economically. Therefore, investigation into where that 32% of networks that need reinforcing may be is required. Crucially, only those EV users with access to their own off-street parking can practically install a charge point. According to a 2008 Department for Transport survey, 43% of
households in the UK are without access to off-street parking [6] and this is likely to be higher in urban areas – for example, 62% of dwellings in Scottish urban areas are flats [7], which are less likely to have off-street parking than houses [8].
B. Contribution
There have been several studies on the characterization of domestic EV charging demand. [9]–[11] each present models for study of the impact of EV charging on distribution networks based on the probabilistic analysis of survey data pertaining to how people travel using conventional vehicles. However, not only does the use of self-reported studies introduce inherent error compared to using data derived from tracking peoples’ actual movements, it has been shown that the adoption of EVs significantly changes the behaviour of drivers [12], [13]. This work presents application of real EV trial data from the 215-vehicle My Electric Avenue trial, conducted in various parts of the UK between 2013 and 2015, to a model representation of a real distribution network. This is suggested to provide a more realistic insight into the impact of EV uptake on the electricity system.
There have also been studies on integrating EV demand models with distribution networks to investigate the impact charging has on network loading. [14] and [15] present studies on simple, generic distribution networks, while [16] presents analysis on a model of a real network, but only a single LV feeder. [17] and [18] both present analysis on real networks, but both assume scenarios pertaining to vehicle ownership at the households connected to it. This work presents the integration of an electrical network model with Ordnance Survey building type data and Census data to produce a representation of both the socio-economic and electrical characteristics of a real distribution network serving over 800 households, and hence derive realistic area-specific results of EV uptake to the area.
II. DISTRIBUTION NETWORK MODEL
A. Glasgow South Side Distribution Network
The distribution network modelled in this work is an 11 kV feeder running from a primary (33/11 kV) substation to 5 secondary (11/0.4 kV) substations, leading to a total of 24 individual LV circuits serving 857 domestic customers. The network covers an affluent suburban area of the city of Glasgow, UK, where car ownership is higher than the UK average and off-street parking is plentiful. This characterizes
James Dixon, Ian Elders, Keith Bell
Dept. of Electronic and Electrical Engineering University of Strathclyde, Glasgow, United Kingdom
{james.dixon, i.elders, keith.bell}@strath.ac.uk
a potentially problematic area for the distribution network, as the charging load from EVs is likely to be high.
Data provided by SP Energy Networks, the Distribution Network Operator (DNO) that owns and operates the network, includes line data (length, resistance and reactance per km, parent circuit, rating), bus data (voltage, number of meters connected) and transformer data (model, rating, tap settings). Load switches are set in the network as their nominal position as in the real network. The authors would like to acknowledge SP Energy Networks for their assistance in providing network data.
In this network, the primary transformer is an On Load Tap Changer (OLTC) with an Automatic Voltage Regulator (AVR) that can increment its tap setting by 1% between a minimum of -16% and +5% to maintain system voltages within limits. The secondary transformers have adjustable tap settings, but this must be done manually while disconnected; not a workable option for real time network operation. As secondary tap settings are not known, in this study all secondary transformer taps are fixed at 0%.
B. Generation of Network Models from GIS Data
A set of scripts was developed using the Geopandas [19] and Pandapower [20] Python modules to convert the provided GIS data to an electrical network model. As a geospatial model created from GIS data, the network model has a set of geometries representing each of its components. By overlaying this onto GIS data of 2011 UK Census Output Areas (OAs), each containing a distribution of any question on the UK Census for around 50-70 households, distributions of vehicle ownership (1-4+ vehicles) and number of residents (1-4+ residents) are returned for each endpoint in the network. For each trial in the MC simulation, these distributions are sampled to establish a set of household characteristics for the network. The building type of each busbar is set by overlaying the network GIS data over a building type dataset from the Ordnance Survey covering the whole of the UK. This returns a definitive building type (e.g. terraced, detached, flat) for each busbar. Fig. 1 shows the Pandapower network model created from the network electrical data (left) and network data overlaid onto UK Census OAs coloured by the mean vehicle ownership per household (right).
Fig. 1. Plot of pandapower network model to represent real GB distribution network (left) and network data plotted over Census data (mean vehicle
ownership per household) (right)
III. SYNTHESIS OF LIKELY DOMESTIC DEMAND PROFILES (WITHOUT ELECTRIC VEHICLE CHARGING)
A. Household Energy Demand Modelling
Household energy demand is strongly correlated with occupancy patterns [21]–[23]. In this paper, the CREST Demand Model [24], [25] is used to simulate domestic base load profiles upon which to superimpose the EV demand simulated using the method presented in this paper.
The CREST model simulates household electricity demand based on the active occupancy of households, simulated from analysis of the results of the UK Time Use Survey (TUS), a large-scale household survey that provides approximately 20,000 10-minute resolution diaries in order to shed light on how people in the UK spend their time [26]. The CREST model is well-established and has been widely adopted in academia and industry [27]–[29].
The model allows the user to set the household type (terraced, semi-detached or detached) and the number of residents (1-4+) along with the day and month of the year. For this study, the day and month was set to a winter weekday to reflect the worst-case domestic demand scenario.
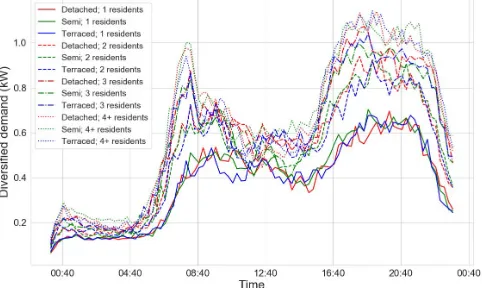
[image:2.612.315.556.377.521.2]The model can simulate 15-minute resolution demand data for one day for up to 728 households. Fig. 2 shows the difference in diversified demand of 728 households of each combination of household type and number of residents. As shown, the number of residents in the household has a much greater effect on electricity demand than the household type.
Fig. 2. Diversified demand of households with different characteristics using the CREST demand model
IV. SIMULATION OF DOMESTIC ELECTRIC VEHICLE CHARGING USING MY ELECTRIC AVENUE DATA
A. My Electric Avenue Trial
The ‘My Electric Avenue’ Electric Vehicle trial [5] was run from January 2014 to November 2015 across several regions of the UK to capture the likely driving and charging behavior of EV users and hence inform future planning of the energy and transport systems. During the trial, 215 participants each with access to a Nissan Leaf EV (24 kWh battery) and a 3.6 kW private charger had all their trips and charging events monitored.
charged, the date and time of the beginning and end of the charging event and the battery State of Charge (SoC) at the beginning and end of the charging event.
B. Processing the Dataset 1) Dates of Interest
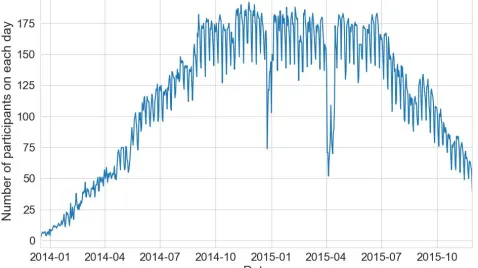
As stated, the trial was conducted from December 2013 to November 2015. However, the number of trial participants active on each day of the trial did vary; mostly, as expected, that there were less participants active at the very beginning and very end of the trial than during the bulk of the trial. Also, trial participants were seen to be less involved during the periods of Christmas and Easter, likely due to them being on holiday. Fig. 3 shows the number of active trial participants by day for the duration of the My Electric Avenue trial.
Fig. 3. Number of active participants per day of My Electric Avenue Trial
Based on the result shown in Fig. 3, the dates for analysis in this work were chosen as 02/08/2014 – 23/12/2014, 02/01/2015 – 28/03/2015 and 14/04/2015 – 02/08/2015 all inclusive. The fluctuating nature of the active participants is due to less participants being active on weekend days than weekdays.
2) Disaggregation of Weekday and Weekend Behaviour
[image:3.612.56.295.230.364.2]It is often perceived that there is a stark difference in driver behaviour between weekdays and weekend days, mostly due to the presence of commuting on weekdays and a higher occurrence of leisure trips on weekends. To investigate this trend in the My Electric Avenue dataset, travel diaries for all participants were synthesized from the data. The mean energy usage per participant per day by day of the week for the duration of the dates stated above is shown in Fig. 4.
Fig. 4. Mean energy usage (kWh) per participant per day by day of week during dates of interest of My Electric Avenue trial
Fig. 4 shows that there is a clear distinction between weekday driving behaviour and weekend driving behaviour, in that people tend to travel less on the weekends than they do on weekdays. As a result, charging events were divided into weekday and weekend groups for analysis.
C. Probabilistic Analysis of the Diversity of EV Charging 1) Proportion of Vehicles Charging
Residential EV charging, if uncontrolled, is expected to occur most often in the evening when commuters arrive home from work [30], [31]. The same trends were observed from the My Electric Avenue data. As shown in Fig. 4, weekday driving energy use is significantly greater than that of the weekend. Further analysis is presented to examine the temporal variation of charging demand of both weekdays and weekends.
For each day in either the set of weekdays or weekend days during the trial, the total number of active participants was recorded. For each 15 minute period in the day, the number of participants who were charging their vehicle (i.e. had started a charging event and not stopped it) was recorded. The proportion of vehicles charging out of those active on that day was then recorded.
[image:3.612.314.558.356.510.2]Fig. 5 and Fig. 6 show density plots of all recorded proportions of vehicles charging for all days during the trial for weekdays and weekend days respectively.
[image:3.612.315.554.548.710.2]Fig. 5. Density plot of proportion of vehicles charging by 15-minute time period - weekdays
[image:3.612.56.295.585.716.2]Fig. 5 and Fig. 6 effectively show the diversity of EV charging demand during the My Electric Avenue trial. During the trial, the highest proportion of vehicles charging during a 15 minute period was 24.4%, which occurred in the period 18:30-18:45 on a weekday. On average, the peak level of coincidence of vehicles charging is around 15% during the periods 18:30-18:45 and 18:45-19:00 for weekdays and around 14% during the periods 18:15-18:30 and 18:30-18:45 for weekend days.
In [5], Cross and Hartshorn report a diversity factor for EV charging of approximately 3, based on a Monte Carlo (MC) simulation derived from EV trial data. The results shown in Fig. 5 and Fig. 6 suggest that perhaps the real diversity factor of EV charging is somewhat greater, given that at most one in four EVs in the trial was charging simultaneously.
Based on the finding that the peak of weekday charging demand was greater than the peak of weekend charging, future analysis presented in this paper is based on analysis of weekday charging demand only.
2) Cumulative Distribution Functions
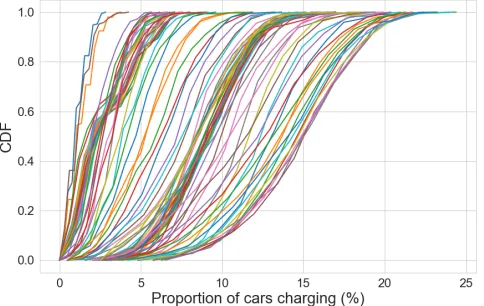
[image:4.612.56.298.351.504.2]Fig. 7 shows a cumulative distribution function (CDF) for each of the 96 time periods in a day for weekday charging demand. During the simulation, the CDF is sampled from to establish a proportion of vehicles charging at that time period.
Fig. 7. Cumulative Distribution Functions for proportion of EVs concurrently charging for each 15-minute time period (1-96) – weekdays
V. SIMULATION
The simulation used to produce results in this work combines the methods and data described in Sections II-IV. For each MC trial, the following steps (Fig. 8) were carried out.
1 For each busbar in the network:
2 Return no. of households connected
3 Return building type from OS data
4 Return Census distributions for OA
5 intersected by busbar
6 For each household at busbar: 7 Sample from distributions 8 Return number of residents 9 Return number of vehicles 10 Assign domestic demand profile 11 from CREST model outputs 12 For each vehicle at household: 13 Return random number 0 ≤ a ≤ 1 14 If a ≤ EV penetration:
15 Instantiate an EV 16 For each time period (1-96): 17 Sample from CDF (e.g. Fig. 7)
18 Return proportion of EVs charging
19 For each household in the network:
20 Return domestic demand
21 Apply demand at relevant busbar
22 For each vehicle in the network:
23 Return random number 0 ≤ b ≤ 1
24 If b ≤ proportion of EVs charging:
25 Apply demand at relevant busbar
26 Run load flow, save results
Fig. 8. Pseudo-code highlighting steps used for simulation
The load assigned to nodes with EVs is 3.6 kW with a power factor of 0.98, in accordance with previous analysis of the My Electric Avenue project [32]. The domestic load assigned to nodes is applied at a power factor of 0.95 in accordance with the approach used in [27].
Due to its stochastic nature, the simulation was run multiple times to return a spread of results in accordance with an MC-style approach. Due to the computationally expensive nature of sampling so many distributions and running load flow simulations, it was established from the analysed EV charging data and applied domestic loading (Figs 2, 5, 6) that the time period of interest is 15:00-21:00; the simulation for this time period was run 100 times.
VI. RESULTS
A. Loading on Secondary Transformers
There are five secondary transformers in the study distribution network, numbered 1-5 in Fig. 9. By compiling the results from all MC trials, the projected loading increase for the transformers can be examined.
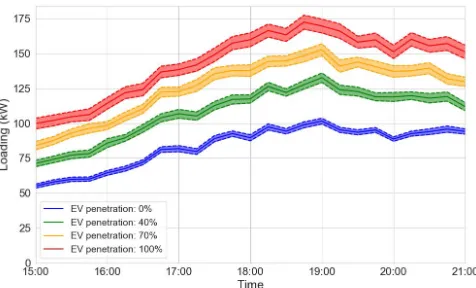
Fig. 10 shows a time series of the projected loading (kW) for the time of interest (15:00-21:00) for transformer 1. Fig. 11 shows the expected peak loading for all 5 secondary transformers for different levels of EV penetration.
[image:4.612.318.525.541.701.2]The spread of MC results is shown in both Fig. 10 and Fig. 11. In Fig. 10, each shaded region represent the spread of 95% of the MC simulation results, with the mean result shown in a solid line for each colour. In Fig. 11, vertical error bars show the range of the 95% confidence interval for each peak loading result.
Fig. 9. Study distribution network plotted over OpenStreetMap data showing location of 5 secondary transformers
3 4
5
2 1
Fig. 10. Increased loading (kW) on secondary transformer due to EV charging load at different levels of EV penetration
[image:5.612.55.297.316.458.2]Fig. 10 shows that the peak loading on the network both before the uptake of EVs and after the uptake of EVs to be a 19:00. This result is particularly problematic for the network as it means that the peaks of the domestic loading and EV charging loading are coincident. Fig. 11 shows the increase in peak loading for all 5 secondary transformers in the study network for different levels of EV penetration.
Fig. 11. Increased peak loading (% capacity) on secondary transformers due to EV charging load at different levels of EV penetration
Fig. 11 shows that although every transformer is expected to see a peak load increase from an increasing penetration of EVs, some transformers see a more significant increase than others. Transformer 3 is expected to see its peak increase from 12% to 21%; far less than transformer 1, which is expected to see its peak loading increase from 35% to 59%.
It is shown in both Fig. 10 and Fig. 11 that although the spread of MC trial results increases as more EVs are simulated, it remains low with the difference between a confidence limit and the mean never exceeding 2.5% of the mean. This is due to the significant amount of ‘averaging’ that occurs as part of the simulation as it simulates a large number of individual loads. This phenomenon is similar to the generally predictable nature of diversified demand.
The presence of EVs in the network is shown to have a significant effect on the demand seen by transformer 1. If all vehicles in this network were replaced by EVs who follow similar uncontrolled charging behaviour as that exemplified in the My Electric Avenue trial, then it is shown to be likely that the peak load on this transformer will exceed 50% of its thermal capacity. In practice, this may be higher than the
DNO would like to operate the transformer: this would then lead to the installation of an additional transformer, at a cost to all energy consumers in that DNO’s licence area.
B. Line Loading
There are 1840 lines (of which 150 are 11 kV circuits and 1690 are 0.4 kV circuits) in the study network. Due to the large number of lines, analysis as simple as that in Fig. 11 cannot be presented. However, the ability to locate the lines with the greatest expected loading increase would be invaluable to network planners. Fig. 12 shows the mean result for all simulations of the peak loading on all lines as a percentage of their capacity for different levels of EV uptake. Horizontal lines are shown either size of each marker to represent the 95% confidence interval of results.
Fig. 12. Increased loading (% capacity) on all lines due to EV charging load at different levels of EV penetration
As with the secondary transformers, some assets are shown to face a significantly greater loading increase than others. While the heaviest loaded line before EV uptake is at 66% of its capacity, two lines in the network are brought to peak loading above 100% of their capacity with an EV capacity of 100%; one line is brought to a peak loading above 100% with an EV capacity of 70%.
C. Endpoint Voltage Drop
[image:5.612.314.559.572.710.2]The impact of EV uptake on the per unit (pu) voltage at the endpoints of the network – where customers are connected – is shown in Fig. 13. As previously stated, the primary transformer is able to change its tap setting to attempt to maintain an LV bus voltage of 1 pu. As aforementioned, secondary transformers are fixed at a tap setting of 0%.
Voltage limits in the GB system at the customer voltage are +10%/-6% [33]. As shown in Fig. 13, the voltage at multiple endpoints is below 0.94 pu and therefore outside of the allowable limits for EV penetrations above 40%. As previously discussed, the primary transformer is equipped with an AVR to keep system voltages within limits. However, it is shown that this is not expected to be sufficient to prevent voltages dropping out of limits in this network.
One option for the DNO could be to adjust the tap settings on the secondary transformers while offline. However, the presence of any generation whose output was not coincident with EV charging demand (for example, rooftop solar PV whose output would be very low in winter evenings when the EV/domestic demand would be at its highest and at its greatest in the middle of the day where the EV charging load is less) could render this approach unsuitable as a voltage rise in the middle of the day could take the endpoint voltage out of allowable limits.
VII. CONCLUSION AND FURTHER WORK
This paper has presented probabilistic analysis of real EV trial data from the My Electric Avenue trial and a method of applying the results to a model representing a real GB distribution network in an area that is likely to see significant demand growth from EV charging.
Probabilistic analysis of the data has shown that EV charging appears to be fairly diverse: in over 12 months of daily data, the greatest concurrence of vehicles charging at the same time occurred at under 25% of vehicles. On average, the peak coincidence of charging vehicles was under 15% of vehicles. However, given that the EV demand peak occurs at around the same time as the existing domestic demand network peak, the network is expected to undergo some stress if it was to accommodate uncontrolled EV charging, which would likely necessitate costly upgrades. Most of the issues shown begin to breach either network limits of DNO planners’ rules of thumb after 70% of vehicles in the network are replaced by EVs.
The approach presented can be applied to any distribution network to highlight which parts of the network are likely to face problems from the uptake of EVs. Furthermore, the methods could be used to evaluate the effectiveness of smart grid technologies such as battery storage, demand side management (i.e. curtailing EV charging during times of high residential demand) or the real-time transfer of demand from heavily loaded parts of the network to those with more free capacity using remote-controlled switches or embedded power electronics devices (soft open points), the aim being to spread energy use more evenly over time, thereby increasing network utilization and reducing the system cost.
Valuable further work could be built upon the method proposed in this paper. For instance, it was assumed that there is zero distributed generation in the network. If it were known where distributed generation were likely to be within a network, the likely generation based on a given technology (e.g. solar photovoltaic) could be included in the work to examine the likely result on system loading, given the EV charging demand simulated. Furthermore, the results of this work are based on all EVs having the same battery capacity
(24 kWh) and charging power (3.6 kW) as in the My Electric Avenue trial. However, as the EV market matures and battery capacities and charging power ratings tend to increase, it could be expected that charging behaviour would change. Further work could be done to model the likely charging behaviour if battery size, charging power and access to charging at other locations (besides home charging) were to change.
VIII. REFERENCES
[1] Department for Environment Food & Rural Affairs, “UK plan for tackling roadside nitrogen dioxide concentrations,” 2017. [Online]. Available: https://goo.gl/68h6ba.
[2] Bloomberg New Energy Finance, “EV Outlook 2017.” [Online]. Available: https://goo.gl/hRNrBJ. [Accessed: 14-Mar-2018]. [3] Department for Transport, “Vehicle Licensing Statistics: January
to March 2017.” [Online]. Available: https://goo.gl/xSRLhz. [4] Department for Transport, “The Road to Zero,” 2018. [Online].
Available: https://goo.gl/KZAto2.
[5] J. D. Cross and R. Hartshorn, “My Electric Avenue : Integrating electric vehicles into the electrical networks,” in 6th Hybrid and
Electric Vehicles Conference (HEVC 2016), 2016, pp. 1–6.
[6] Department for Transport, “Public experiences of and attitudes towards parking,” 2008. [Online]. Available: https://goo.gl/PQo7qX. [Accessed: 20-Dec-2017].
[7] National Records of Scotland, “Estimates of Households and Dwellings in Scotland, 2016,” 2017.
[8] RAC Foundation, “Spaced Out: Perspectives on parking policy,” 2012. [Online]. Available: https://goo.gl/AfPRDD.
[9] S. Huang and D. Infield, “Monte Carlo modelling for domestic car use patterns in United Kingdom,” 2014 Int. Conf. on Connected
Vehicles and Expo, ICCVE, pp. 68–73, 2015.
[10] A. Beltramo, A. Julea, N. Refa, Y. Drossinos, C. Thiel, and S. Quoilin, “Using electric vehicles as flexible resource in power systems: A case study in the Netherlands,” 14th Int. Conf.
European Energy Markets EEM, 2017.
[11] A. Lojowska, D. Kurowicka, G. Papaefthymiou, and L. Van Der Sluis, “Stochastic Modeling of Power Demand due to EVs Using Copula,” IEEE Trans. Power Systems, vol. 27, no. 4, pp. 1960– 1968, 2012.
[12] C. C. Rolim, G. N. Gonçalves, T. L. Farias, and Ó. Rodrigues, “Impacts of electric vehicle adoption on driver behavior and environmental performance,” vol. 54, pp. 706–715, 2012. [13] M. Helmbrecht, C. Olaverri-Monreal, K. Bengler, R. Vilimek, and
A. Keinath, “How electric vehicles affect driving behavioral patterns,” IEEE Intelligent Transportation Systems Magazine, vol. 6, no. 3, pp. 22–32, 2014.
[14] G. A. Putrus, P. Suwanapingkarl, D. Johnston, E. C. Bentley, and M. Narayana, “Impact of electric vehicles on power distribution networks,” 5th IEEE Vehicle Power Propulsion Conf. VPPC, pp. 827–831, 2009.
[15] S. Shafiee, M. Fotuhi-Firuzabad, and M. Rastegar, “Investigating the impacts of plug-in hybrid electric vehicles on power distribution systems,” IEEE Trans. Smart Grid, vol. 4, no. 3, pp. 1351–1360, 2013.
[16] P. Richardson, D. Flynn, and A. Keane, “Impact assessment of varying penetrations of electric vehicles on low voltage distribution systems,” IEEE PES Gen. Meet. PES 2010, pp. 1–6, 2010. [17] L. Pieltain Fernández, T. Gómez San Román, R. Cossent, C. Mateo
Domingo, and P. Frías, “Assessment of the impact of plug-in electric vehicles on distribution networks,” IEEE Trans. Power
Systems, vol. 26, no. 1, pp. 206–213, 2011.
[18] R. C. Leou, C. L. Su, and C. N. Lu, “Stochastic analyses of electric vehicle charging impacts on distribution network,” IEEE Trans.
Power Systems, vol. 29, no. 3, pp. 1055–1063, 2014.
[19] Geopandas Development Team, “Geopandas.” [Online]. Available: geopandas.org. [Accessed: 20-Aug-2018].
[21] A. Capasso, W. Grattier, R. Lamedica, and A. Prudenzi, “A bottom-up approach to residential load modeling,” IEEE Trans.
Power Systems, vol. 9, no. 2, p. 8, 1994.
[22] R. Yao and K. Steemers, “A method of formulating energy load profile for domestic buildings in the UK,” Energy Build., vol. 37, no. 6, pp. 663–671, 2005.
[23] J. Torriti, “Price-based demand side management: Assessing the impacts of time-of-use tariffs on residential electricity demand and peak shifting in Northern Italy,” Energy, vol. 44, no. 1, pp. 576– 583, 2012.
[24] I. Richardson, M. Thomson, and D. Infield, “A high-resolution domestic building occupancy model for energy demand simulations,” Energy Build., vol. 40, no. 8, pp. 1560–1566, 2008. [25] E. McKenna and M. Thomson, “High-resolution stochastic
integrated thermal-electrical domestic demand model,” Applied
Energy, vol. 165, no. 445, 2016.
[26] Centre for Time Use Research, “United Kingdom Time Use Survey, 2014-2015.” [Online]. Available: https://goo.gl/C6pMF6. [Accessed: 25-Nov-2018].
[27] A. Ballanti, F. Pilo, A. Navarro-Espinosa, and L. F. Ochoa, “Assessing the benefits of PV var absorption on the hosting capacity of LV feeders,” 2013 IEEE/PES Innovative Smart Grid
Technologies Europe, pp. 1–5, 2013.
[28] N. Good, L. Zhang, A. Navarro-Espinosa, and P. Mancarella, “High resolution modelling of multi-energy domestic demand profiles,” Applied Energy, vol. 137, pp. 193–210, 2015.
[29] EA Technology, “Assessing the Impact of Low Carbon Technologies on Great Britain’s Power Distribution Networks - version 3.1- for Smart Grids Forum – Work Stream 3,” 2012. [30] C. Crozier, D. Apostolopoulou, and M. McCulloch, “Mitigating the
impact of personal vehicle electrification: A power generation perspective,” Energy Policy, vol. 118, pp. 474–481, 2018. [31] S. Huang, “Statistical Analysis of Passenger Car Use to Model the
Impact of Electric Vehicle Take-up on the Power Distribution Network,” 2014. [Online]. Available: https://goo.gl/PwyWp4. [32] J. Quirós-tortós and B. Lees, “A statistical analysis of EV charging
behavior in the UK Accepted Paper A Statistical Analysis of EV Charging Behavior in the UK Accepted Paper,” no. October, pp. 445–449, 2015.