
Age and cereal effects on the performance, gut parameters and nutrient utilisation in the newly hatched broiler chick : a thesis presented in partial fulfilment of the requirements for the degree of Master of Applied Science at Massey University
94
0
0
Full text
(2) AGE AND CEREAL EFFECTS ON THE PERFORMANCE, GUT PARAMETERS AND NUTRIENT UTILISATION IN THE NEWLY HATCHED BROILER CHICK. A Thesis Presented in Pa rtia l Fulfilment of the Require m ents fo r t he Degree of Master of A p plied Science at Massey U n iversity. DONALD V. THOMAS. 2007.
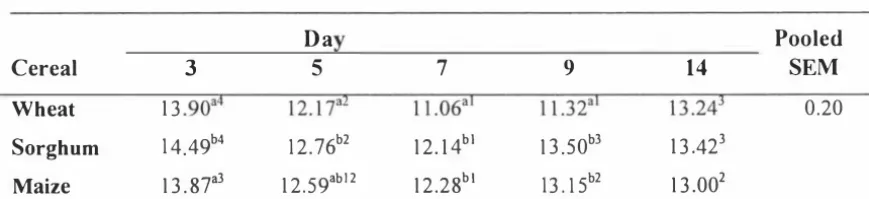
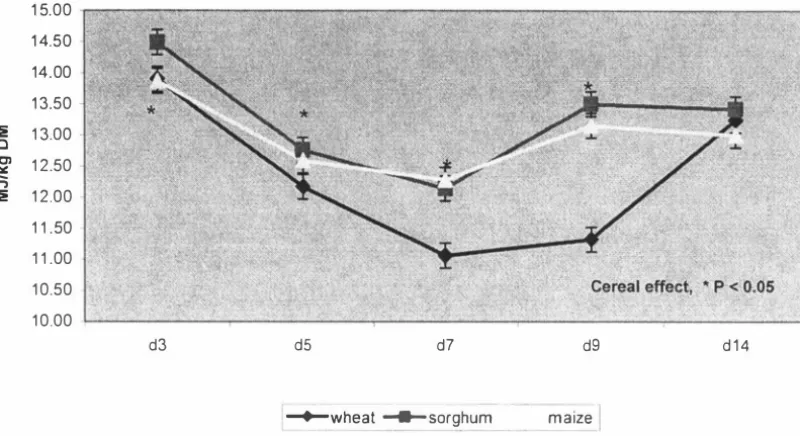
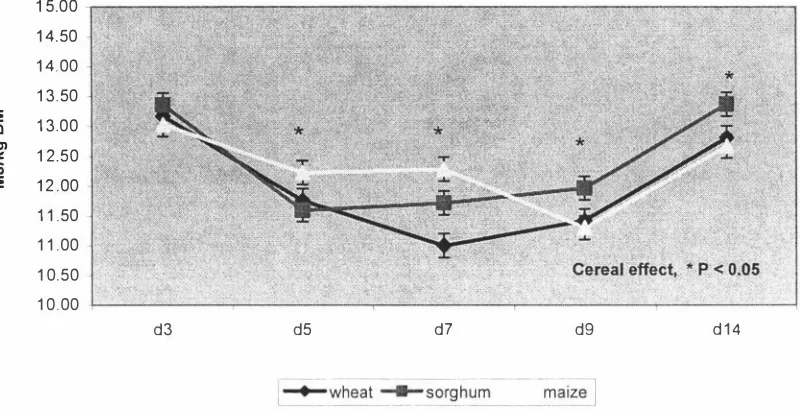
(3) ABSTRACT. This study was intended to provide a platform for enhanced nutritional management of modern broilers through better understanding of changes in nutritional utilisation in the newly hatched chick. Differences in performance, nutrient utilisation and the development of the gastrointestinal tract in the young broiler chicken fed diets based on different cereals were examined. Diets based on wheat, sorghum and maize and formulated to contain iso-energy and iso-lysine levels were fed to broiler chicks between days 1 and 1 4 post hatch. Birds fed the maize based diet grew faster (P < 0.05) than those fed the sorghum based diet. Weight gains of birds fed the wheat based diet did not differ (P. >. 0.05) from. those fed either maize or sorghum based diets. There were numerical differences in feed:gain with the sorghum based diet having the highest feed per gain, but the differences were not significant (P > 0.05). The relative weights of digestive organs and digestive tract showed no significant cereal treatment differences (P > 0.05). The treatments had no effect (P > 0.05) on the relative length of the digestive tract or gut histology measurements. The wheat based diet contained a commercial xylanase which may have ameliorated the digesta viscosity of this diet and reduced the NSP effect on gut structure and morphology. Furthermore, gut morphology samples showed a high degree of variation, suggesting that a large sample size would be necessary for significant differences to be determined. Two experiments were conducted to investigate cereal and age effects on nutrient utilisation in the young broiler chicken. Experiment 1 determined the nitrogen corrected apparent metabolis able energy (AMEn) of diets based on wheat, sorghum and maize during 14 days post-hatch. Changes in the total tract digestibility of starch and fat were also measured. The second experiment was conducted to confirm the results of Experiment. 1. using wheat and maize based diets and was of 21 days. duration. In both experiments, changes to AMEn with age were similar for all diets, declining from day 3 to days 5-9 and increasing again. In experiment 1, cereal effects were significant higher. AMEn. (P. < 0.05) with maize and sorghum based diets having. values than the wheat based diet. In experiment 2, cereal effects were.
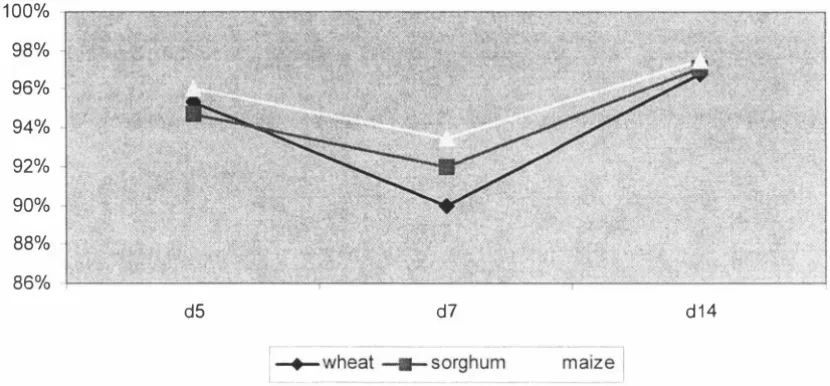
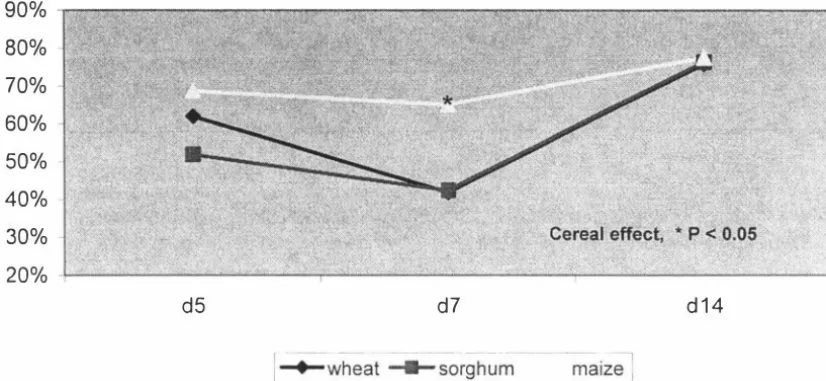
(4) significant (P < 0.05) with the maize based diet having a higher AMEn than the wheat based diet. In experiment 1, total tract starch digestibility determined for days 5, 7 and 14 showed no cereal differences (P. >. 0.05). Age effects were significant (P < 0.05). w ith starch digestibility declining from day 5 to day. 7,. and then increasing again.. Total tract fat digestibility on day 7 was significantly lower for the wheat and sorghum based diets than for the maize based diet, but no cereal differences (P. >. 0.05) were observed on days 5 or 14. Age effect was highly significant with fat digestibility declining from day 5 to day 7 and increasing again. These results showed that nutrient utilisation is compromised during the first week of life of the broiler chick. Samples of diets and excreta from Experiment. I. were analysed for minerals to. determine changes in the apparent total tract mineral retention of the broiler chick during the first two weeks post-hatch. The diet and excreta samples were analysed for calcium, phosphorus, potassium, sodium, magnesium, iron, manganese, zinc and copper, and their retention was determined. The retention coefficients of individual minerals differed widely and the retentions of major minerals were much greater than those of minor minerals. The cereal effects were significant (P < 0. 05) for several minerals, with a general tendency for the sorghum diet to have greater retention than maize or wheat diets. Age effects were significant (P < 0.05) for all minerals. In general mineral retention coefficients were higher at day 3, declined to day 7 and remained unchanged to day 14. Decline in mineral retention with age was similar in all three diets. The studies reported in this thesis investigated the performance and nutrient utilisation of broiler chicks fed diets based on wheat, sorghum or maize. A significant reduction in nutrient utilisation over the period 5. -. 9 days of age was. observed suggesting that nutrient digestion and absorption is compromised during the first week of life of the broiler chick. Further work is required to identify the specific causes of the decline in digestibility during the early stages of chick development.. 11.
(5) ACKNOWLEDGEMENTS. I w ould like to thank my supervisor Prof Ravi Ravindran for his knowledge, guidance and patience both in the planning of the experiments and in the preparation of the written text. His generous assistance and encouragement has been crucial to the successful completion of this thesis, and his willingness to make his time available has made this an enjoyable and worthwhile learning experience.. I would also like to thank Dr Rana Ravindran for her assistance with starch analysis and Dr David Thomas for guiding the histology. The willingness of both these scientists to contribute to my research is greatly appreciated.. My thanks go to Dr Patrick Morel for his assistance with statistics, and for being prepared to answer biometrics questions on Sunday mornings.. I am particularly grateful to the Poultry Research technical staff, particularly Colin Naftel, for their assistance with the trial procedures, and their personal support.. I. w ould also like to thank the technical staff of the Nutrition laboratory and the H istology laboratory for their assistance.. My thanks also to my friends, both in the institute and out, who have supported and assisted me in one way or another, and given me the time to complete this research on a part time basis.. And finally, I wish to express heartfelt gratitude to my family who have always been there for me, especially my wife for her active encouragement.. 1II.
(6) TABLE OF C ONTENTS. Abstract Acknowledgements. 111. Table of Contents. IV. List of Tables. IX. List of Figures. XI. List of Plates. XII. CHAPTER 1:. GENERAL INTRODUCTION. 1 .1 OBJECT IVES OF THE STUDY.................................... 1 .2 RELEVANCE OF THE RESEARCH............................... 3. REFERENCES . . . . . . . . . . . . . . . . . . . . . . . . . . . . . . . . . . . . . . . . . . . . . . . . . . . . . . . . . . . . .. 3. CHAPTER2:. LITERATURE REVIEW. INTRODUCTION...................................................... 4. 2.2 GROWTH RATE....................................................... 5. 2.3 FEED INTAKE AND PASSAGE RATE........................... 5. 2.4 VITELLINE RESIDUE .............. ........ ...... ......... ... ....... 6. 2.5 DIGESTIVE ORGAN DEVELOPMENT ..... .. .......... ...... .... 6. 2.1. 2.6 RELATIVE DEVELOPMENT OF INTESTINE AND DIGESTIVE ORGANS ... ... ... ...... ... ...... ...... ... ....... ....... 6. 2.7 DEVELOPMENT OF GUT MUCOSA ...... ... ............ ... ...... 7. 2.8 MUCOSAL DNA............................................................ 8. 2.9 GASTROINTESTINAL TRACT pH..................................... 9. IV.
(7) 2.1 0. BlLIARY THE. 2.1 1. SECRETIONS. AND. DIGESTIVE ENZYMES IN. YOUNG BROlLER CHICKEN.................................. 9. 2.1 0.1. Biliary Secretions .................................. 9. 2.1 0.2. Pancreatic Enzymes.................................. 9. 2.1 0.3. Brush Border Enzymes............................ 12. COMPARISON OF G ROWTH, DIGESTIVE ORGAN DEVELOPMENT AND DIGESTIVE ENZYME LEVELS IN FAST. 2.1 2. SLOW GROWING LINES OF CHICKENS ...... 13. 2.1 1 .1. Bodyweight ......................................... 13. 2.1 1 .2. Feed Intake .......................................... 13. 2.1 1 .3. Passage Rate ........................................ 14. 2.1 1 .4. Vitelline Residue ................................... 14. 2.1 1 .5. Development of Digestive Organs ............. .. 14. 2.1 1 .6. Gut Morphology .................................... 15. 2.1 1 .7. Digestive Enzyme Activity ....................... 16. 2.1 1 .7.1. Pancreatic Enzymes ... ... ... ................... 16. 2.1 1 .7.2. Brush Border Enzymes...................... 18. AND. DIGESTION. AND. UTlLISATION OF NUTRIENTS IN. NEWLY HATCHED CHICKS ... ... ... ... ... ... ... ........... .... 18. 2.1 2.1. Nutrient Digestibility...... .............. ........... 18. 2.1 2.2. Energy Utilisation................................... 20. 2.1 3 NUTRITIVE VALUE OF CEREALS FOR POULTRY ......... 20. 2.1 3.1. Cereal Energy Values ........................... 21. 2.1 3.2. Digestive Tract Development .................. 21. 2.1 3.3. Gut Morphology .................................. 22. 2.1 3.4 Anti-Nutritive Value of Cereal Non-Starch Polysaccharides ..... ... ... ... ... ......... ... ....... 22. 2.1 3.5 Physical and Chemical Properties of Soluble NSP Which May Contribute to Anti-Nutritive Properties.. . ... ... ... ... ...... ... ...... ....... ...... 23. 2.13.5.1. Viscosity .... .. ...... ...... ...... ........ .... 23. 2.1 3.5.2. Surface Activity.............................. 24. V.
(8) 2. 1 3. 5. 3. Water Holding Capacity...................... 24. 2.1 3 . 5.4. Viscosity-Microflora Interaction............ 24. 2.1 3.5. 5. Increase in the Secretion of Endogenous Protein........................................... 25. SUMMARY............................................................... 25. REFERENCES... .. . ... . ..... . . . . .. . . . . . . ... . . . . .. . . .... ...... ... . . ..... .. .. . . . .... 26. 2.1 4. CHAPTER3:. PERFORMANCE,. DIGESTIVE. TRACT. DEVELOPMENT AND GUT MORPHOLOGY OF THE NEWLY HATCHED BROILER CHICK FED DIETS BASED ON WHEAT, SORGUM OR MAIZE. 3.1. ABSTRACT ...... ... ... ... ... .. . ... ... ...... ... ...... ... ... ...... ... ..... 33. 3.2 INTRODUCTION .... .. ......... ...... ... ............ ... ......... 34. 3.3 MATERIALS AND METHODS 3.3 . 1. Diets ... .. . ... ... ... ... ... .. .... ...... ...... ........... ..... 35. 3.3.2. Experimental Procedures ... ...... ... ... ........ ... ...... 35. 3.3.3. Collection and Processing of Samples ................. 38. 3.3 . 4. Morphological Measurement ..... . . . . . .. ...... . .. ..... 38. 3.3.5. Data Analysis ... ...... ... ... ... . . . . .. .. .... . .. . . . ... .. ... 38. 3.4. 1. Performance Data .. . .. . . .. .. . ... .. . . . . .. . ... . .. ... ... . ... 40. 3.4.2. Digestive Tract Measurements ... .. . . .. .. . . .. ... ... . . .. 40. 3.4. 3. Morphological Measurements ............. ...... .. . .. ... 42. 3.5 DISCUSSION ............................................................. 44. REFERENCES ............................................... ................ 46. 3.4 RESULTS. .. .. VI.
(9) NUTRJENT UTILISATION OF DIETS. CHAPTER4:. BASED ON WHEAT, SORGHUM OR MAIZE BY THE. NEW HATCHED BROILER CHICK. 4.1. ABSTRACT .............................................................. 48. 4.2. INTRODUCTION ....................................................... 49. 4.3. MATERIALS AND METHODS ... ... ... . .. ...... ...... ... .... .. ..... 49. 4.3.1. Experimental Procedures ... ... ... ... ...... ... ... ... . .... 50. 4.3.2. Collection and Processing of Samples . .. ... ... ... ... .. 50. 4.3.3. Chemical Analysis ... ... ... ... ....... .. ... ... ... ... ... .... 50. 4.3.4. Calculations . .. ...... ... ... ... ... ... ...... ... ........ ....... 51. 4.3.5. Data Analysis ... ... ...... ... ... ... . .. ... .............. ..... 52. 4.4 RESULTS .................................................................. 52. 4.4.1. EXPERIMENT 1 ...... ... ... ... ... ... ... .. ........... ..... 4.4.1.1. 4.4.2. AME....................... ... .. . .. .......... ..... 52 52. 4.4.1 .2. Total Tract Starch Digestibility ............. 54. 4.4.1.3. Total Tract Fat Digestibility ................. 55. 4.4.1 .4. Nitrogen Retention ........................... 56. 4.4.1 .5. Feed Intake .................................... 57. EXPERIMENT 2 ......................................... 58. 4.4.2.1. AME......... ......... ...... . . ...... .... . . . ..... 58. 4.4.2.2. Nitrogen Retention ... ........ ... ... ... ... .... 59. 4.4.2.3. Feed Intake .... ... ... ... ...... ........ ......... 60. 4.4.2.4. Feed Intake Per Unit of Bodyweight ...... 60. 4.5 DISCUSSION............................................................... 60. REFERENCES...... ...... ... ... ... ...... ... ... ...... ... ... ... ........ ... ... ...... 64. vii.
(10) CHAPTERS:. TOTAL TRACT RETENTION OF. MINERALS IN DIETS BASED ON WHEAT, SORGHUM OR MAIZE WHEN FED TO THE NEWLY HATCHED BROILER CHICK. 5.1. ABSTRACT................................................................ 67. 5.2. INTRODUCTION ......................................................... 68. 5.3. MATERIALS AND METHODS. 68. 5.3.1. Experimental Procedures and Processing of Samples..................................................... 68. 5.3.2. Chemical Analysis......................................... 68. 5.3.3. Calculations................................................ 69. 5.3.4. Data Analysis............................................... 69. RESULTS................................................................... 69. 5.4.1. Major Minerals . . . . . . . . . . . . . . . . . . . . . . . . . . . . . . . . . . . . . . . . . . .. 70. 5.4.2. Minor Minerals . . . . . . . . . . . . . . . . . . . . . . . . . . . . . . . . . . . . .. .. ..... 71. DISCUSSION.............................................................. 72. REFERENCES................................................................... 74. 5.4. 5.5. CHAPTER 6. SUMMARY AND CONCLUSIONS. 6.1. SUMMARY.................................................................. 75. 6.2. CONCLUSIONS............................................................ 77. REFERENCES... . . . . . . . . . . . . . . . . . . . . . . . . . . . . .. . . . . .. .. . ... . . . . . . . . . . . . . . . . . . . . . .. 79. Vlll.
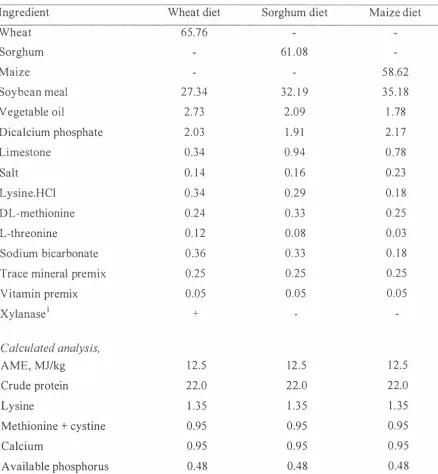
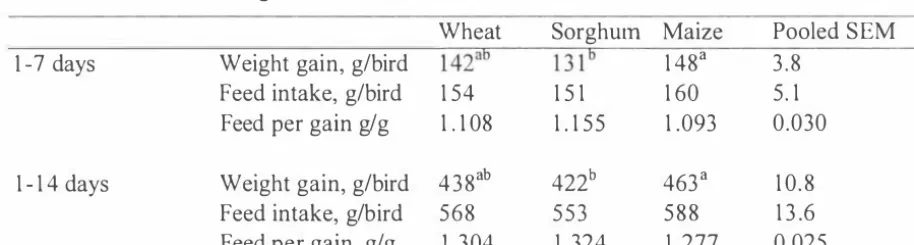
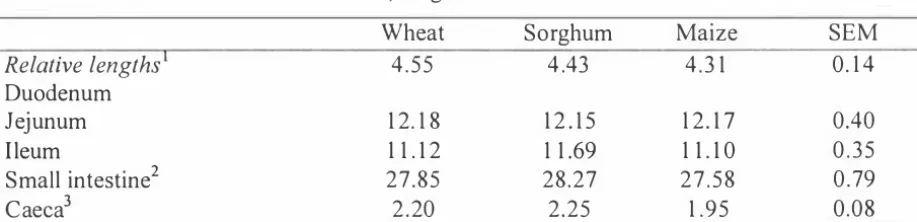
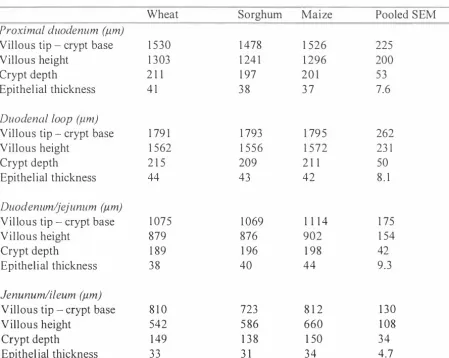
(11) LIST OF TABLES. Chapter 3 Table 1: Composition and calculated analysis (g/1OOg) of diets based on wheat, sorghum and maize Table. 2:. Weight gain, feed intake and feed per gain ratio of male broiler chicks fed diets based on wheat, sorghum or maize. Table. 3:. Relative digestive organ and tract weights (g/1OOg body weight) of male broiler chicks fed diets based on wheat, sorghum or maize. Table 4: Relative lengths of digestive tract segments (mm/1 OOg BW) of male broiler chicks fed diets based on wheat, sorghum or maize Table. 5:. Intestinal morphological measurements of male broiler chicks fed diets based on wheat, sorghum and maize. Chapter 4 Table 1: Least square means for AMEn (MJ/ kg DM) of wheat, sorghum and maize based diets for broiler chickens during the first 14 days post hatch calculated by the total collection method Table. 2:. Least square means for. AME. (MJ/ kg DM) of wheat, sorghum and maize. based diets during the first 14 days post hatch - calculated by the titanium marker method Table 3: Total tract starch digestibility coefficients for broilers fed wheat, sorghum and maize based diets at 5,. 7. and 14 days of age. IX.
(12) Table 4: Total tract fat digestibility coefficients for broilers fed wheat, sorghum and maize based diets at 5, 7 and 1 4 days of age Table 5: Nitrogen retention (g/ kg DM intake) for broilers fed wheat, sorghum and maize based diets at 5, 7 and 1 4 days of age Table 6: Changes in daily feed intake (g DM/day) Table 7: Least square means for AME (MJ/ kg DM) of wheat and maize-based diets for the first Table. 8:. 21. days post hatch. Nitrogen retention (g/kg DM intake) of wheat and maize-based diets for the first. 21. days post hatch. Table 9: Daily feed intake (g DMJ bird),. 1 -2 1. days post-hatching. Table 1 0: Feed intake per unit of bodyweight (g/kg body weight). Chapter 5 Table. I:. Table. 2.. Determined mineral contents of diets based on wheat, sorghum and maize Least square means for total tract retention of major minerals in broilers fed wheat, sorghum and maize-based diets during the first. 14. days post. hatch Table. 3.. Least square means for total tract retention of minor minerals in broilers fed wheat, sorghum and maize-based diets during the first. 14. days post. hatch. X.
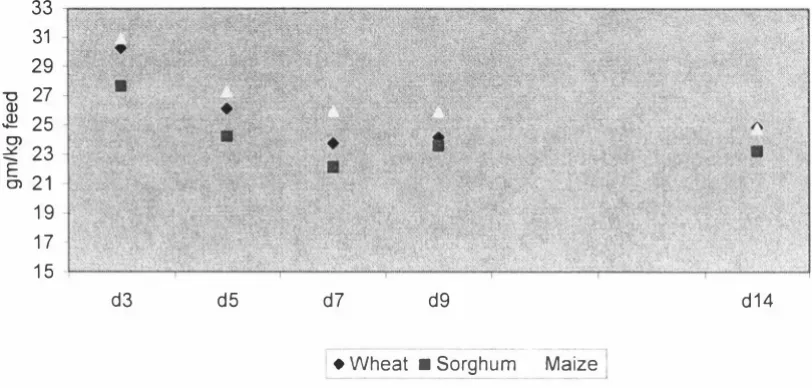
(13) LIST OF FIGURES. Chapter 4 Figure 1. AMEn values for wheat, sorghum and maize based diets for broiler chickens - calculated by the total collection method. Figure 2. AMEn for wheat, sorghum and maize based diets - calculated by the titanium marker method. Figure. 3.. Starch digestibility coefficients for broilers fed wheat, sorghum and maize based diets at. 5,. 7 and 1 4 days of age. Figure 4. Fat digestibility coefficients for broilers fed wheat, sorghum and maize based diets at. Figure. 5.. 5,. 7 and 1 4 days of age. Nitrogen retention (g/kg DM intake) for broilers fed wheat, sorghum and maize based diets at. Figure. 6.. 5,. 7 and 1 4 days of age. Changes in AME1 values for wheat and maize based diets during 1 -21 days post hatch. Figure 7. Nitrogen retention (g/kg DM intake) of wheat and maize-based diets for the first 21 days post hatch. XI.
(14) L I ST OF PL ATES. Chapter 3 Plate 1. Battery brooder unit. Plate 2. Gastro-intestinal tract measurements. Plate. 3.. Sample sites for gut morphology measurements.. Plate 4. Cross section of the gut (1 00 X magnification) at the four sampling sites in birds fed the wheat based diet. Xll.
(15) Chapte r 1 Introd uc tion. D uring the past two decades the growing cycle of the broiler chicken has reduced as a result of selection for faster growth rate. Associated with this increase in growth rate has been an improvement in feed efficiency. These changes have provided the broiler ind ustry with substantial economic advantages, particularly in relation to competing animal proteins for human consumption. There is now more emphasis on the early growth phase of the chicken, and improvements in feed efficiency over the first 1 4 days of age are increasingly important in achieving the full economic benefits of genetic improvements in the broiler chicken. A detailed understanding of changes in digestive capacity and the physiological causes. and effects of these changes is the key to improving bird performance over this early period. Little recent work has been undertaken in this area, and although there is a significant amount of historical information, it is unknown how accurately these data reflect the modern broiler chicken. Furthermore, a number of management changes over recent years, such as the use of exogenous feed enzymes and changes in dietary nutritional specifications, may be impacting on the post-hatch chick. This study provides a platform for enhanced nutritional management of the modern broiler chick to i mprove both the market performance and economic profitability. 1.1 O BJECTIVES OF THE STUD Y. Differences in growth rate and feed efficiency of broiler chickens are known to result from diets based on different grain types (Ao and Choct, 2004). Cereals contain varying levels of non-starch polysaccharides (NSP) giving rise to differing viscosity levels in both the feeds manufactured from these cereals and in the digesta of chickens fed these feeds. Increased digesta viscosity is known to reduce digestion and absorption of a range of nutrients (Annison, 1993). Wheat based diets are more viscous than maize. 1.
(16) based diets as they contain higher levels of NSP and as a result tend to be less e fficiently utilised than maize based diets by growing birds. The studies reported in this thesis compared diets based on wheat, sorghum or maize, the three main grains used in the New Zealand poultry industry.. The gastrointestinal tract is a major consumer of nutrients, with rapid cell turnover utilising significant quantities of both nutrients and energy and an increase in the proportional size of the gastrointestinal tract will therefore reduce feed efficiency. High N S P cereals have been shown to increase the size of the gastrointestinal tract (J orgensen. et. al., 1 996). The weights of the major digestive organs and of the digestive tract were. measured on day 1 4 to assess diet related differences. N S P levels may also influence the morphology of the gut (lji, 1 999) . Increasing crypt depth indicates increased villus cell pro l i feration, and therefore an increase in nutrients being utilised by the gastrointestinal tract. Nutrients are absorbed through the vil lus epithelium and changes in villus height alter the area available for nutrient absorption. This study measured both villus height and crypt depth for dietary impact. T he digestive system of the newly hatched chick is not fully developed and this impacts on the efficiency with which the chick utilises dietary nutrients. Dietary differences would therefore be expected to be more pronounced during the immediate post-hatch period. This aspect was examined in two experiments. In experiment 1 , age effects on e nergy utilisation were measured during the first 1 4 days post hatch. Age effects on total tract starch and fat digestibi lity were also determined. In experiment 2, age effects on energy utilisation were confirmed over the first 2 1 days post hatch. Published data on the changes with age in mineral absorption and utilisation in the young broiler chick are l imited (Ravindran et al., 2006). Accurate data on mineral retention by the young chick is necessary if diets are to meet the requirements of the chick during the early stage of development. Furthermore, increasing awareness of the e nvironmental cost of waste disposal is placing more emphasis on minimising excessive d ietary mineral levels. To assess the significance of developmental changes in mineral util isation in the newly hatched broiler chick, mineral retention was calculated on days. 3, 5 , 7, 9 and 1 4. Both dietary and age related differences were measured.. 2.
(17) 1.2 RELEVANCE OF THE RES EARCH. Currently available published data on the nutritional requirements of the broiler chicken may not be accurate for the modern fast growing bird. Furthermore, the New Zealand broiler industry differs from industries elsewhere in a number of aspects. These include bird performance, feed efficiency and availability of feed ingredients. For these reasons, there is a need for information on dietary and age related effects in the modern broiler grown under New Zealand conditions. This study is specific to the New Zealand environment and uti lised New Zealand sourced feed ingredients, and it is hoped that this study will provide the basis for more appropriate nutrition over the first 1 4 days post hatch.. REF E REN C E S. Annison, G . ( 1 993). The role of wheat non-starch polysaccharides in broi ler nutrition. Australian Journal of Agricultural Research, 44: 405-422. Ao, Z. and Choct, M. 2004. Effect of early feeding and grain type on growth and performance of broilers.. Proceedings of the Australian Poultry Science. Symposium, 1 6 : 1 1 6- 1 1 9 . Ij i , P.A.. 1 999. The impact o f cereal non-starch polysaccharides on intestinal development and function in broi ler chickens. World's Poultry Science Journal, SS: 3 7 5 - 3 8 7 .. Jorgensen, H . , Zhao, Xin-Quan, Knudsen, K . E . B . and Eggum, B . O . 1 996. The influence of dietary. fibre source and level. on the development of. gastrointestinal tract, digestibility and energy metabolism in broiler chickens. British Journal of Nutrition, 7S: 3 79-3 9 5 . Ravindran, V . , Morel, P.C.H., Partridge, G.G., Hruby, M . and S ands, J . S . 2006. Influence of Escherichia coli- derived phytase on nutrient utilization in broiler starters fed diets containing varying concentrations o f phytic acid. Poultry S cience, 8S: 82-89.. 3.
(18) Chapter 2 L iteratu re Review 2 .1 I nt roduction. Over the past two decades, the growing period of meat chickens has reduced markedly with the first two weeks post-hatch now comprising 40% of the grow-out period. For this reason, the early growing period of the chick is assuming increasing importance. A number of researchers have evaluated different aspects of the development of digestive capabi lity in the newly hatched chick. Digestive organ development has been i nvestigated by N itsan et al. ( 1 99 1 a), Nitsan et al, ( 1 99 1 b), Nir et al. ( 1 993) and Ij i et al. (200 1 a). Development of gut mucosa was investigated by D ibner al. (200 1 a), Noy. et. al. (200 1 ), and Uni. et. et al. ( 1 996), lj i et. al. ( 1 998). Enzyme production has been. investigated both for pancreatic enzymes (Nir et al., 1 99 3 ; Nitsan et al., 1 99 1 a; Noy and S klan, 1 995), and brush-border mucosal enzymes (Mahagna and Nir, 1 996; Uni et al., 1 998).. Numerous studies have been reported on the effects o f early feeding on gut development and bird performance . Researchers have investigated both the impact of fasting (Halevy et al., 2000; Lippens, et al., 2000) and the benefits of early feeding to newly hatched chicks (Batal and Parsons, 2002b; Boersma et al., 2003 ; Yi et al., 2005). D ibner et al. ( 1 996) investigated the effect o f dietary ingredients on the microscopic structure of the gut. The digestion of specific nutrients including carbohydrate, fat and protein (Sulistiyanto et al. 1 999; Noy and Sklan, 2002; Sklan, 2003) and dietary energy utilisation in broiler chicks have also been investigated (Zelenka, 1 96 8 ; Sulistiyanto et al., 1 999; Batal and Parsons, 2002a).. D espite the number of investigations conducted on early nutrition in the newly hatched chick, there still remain a number of unanswered questions. In many cases the results reported are contradictory and suggest further research is required in order to understand the mechanisms involved, and the most appropriate management tools to maximise performance in the first few weeks of the broiler chicken's life . As the growing cycle of the broiler chicken continues to shorten, this will become even more important to the poultry industry. The l iterature concerning the digestive capability and. 4.
(19) nutrient digestion of the newly hatched chick are reviewed i n this chapter i n an attempt to determine the current scientific understanding o f early chick nutrition and to identify those areas where further research is required. 2 . 2 G rowth rate. Nitsan et al. ( 1 99 1 a) reported that the chick relative growth rate increased from 1 4% of bodyweight for the first seven days to 22% of bodyweight on day 1 1 before decreasing to 9% o f bodyweight on day 1 7. S imilar findings have been reported by Nir et al. ( 1 9 9 3 ) who calculated that broiler chickens achieved a maximal relative growth rate of 20% at five days o f age which was maintained until at least day 1 0 and decreased thereafter to 1 6 % of bodyweight by 1 4 days of age. 2.3 Feed intake a n d passage rate. Nir et al. ( 1 993) found that relative feed intake peaked at 3 0% o f bodyweight on day 3 after which it declined to 1 5% o f bodyweight at day 1 5 . Noy and Sklan ( 1 995) observed that feed consumption increased three-fold between four and ten days of age, but this paralleled a 3 0% decline in passage rate. After 1 0 days of age feed intake continued to increase, however no further change in passage rate was observed. The decrease in passage time was especially high in the duodenum, the maj or site of activity for digestive enzymes, with a decline from 1 0 minutes on day four to 3 minutes on day 7, after which there was no significant change. Passage time through the small intestine declined from 1 6 1 minutes on day four to 1 1 0 minutes on day 1 4. Uni et al. ( 1 995b) also observed a decrease in passage time over the first week o f age. Passage time through the small intestine decreased from 1 1 5 minutes on day four to 7 4 minutes on day 7.. However, in this study, passage time increased again by day 1 0 and reached. approximately 1 22 minutes on day 1 4. I n summary, feed intake increases and passage time appears to decline over the first week of life, the period during which maximum relative growth o f body mass and digestive organs occurs.. 5.
(20) 2.4 Vitelline residu e. N i r e t al. ( 1 993) found that the vitelline residue decreased rapidly from 1 1 % o f bodyweight at hatch t o 2% b y day two and was negligible by day four. This finding was consistent with those of Nits an et al. ( 1 99 1 b) who showed that 7 5% of the residual vite lline present at hatch is utilised b y day three and that by day six vitelline residue had decreased to negligible levels and of lj i et al. (200 1 a) who measured the yolk sac at 8% o f bodyweight at hatch and decreasing to less than 1 % o f bodyweight by day 7. Murikami et al. ( 1 992) found that deutectomising chicks did not affect metabolisability of dietary energy o r lipid, but delayed the growth of the chicks by two days, demonstrating the role of the residual yolk in complementing dietary nutrients. In this study, the vitelline residue was 6.4 grams at hatch, disappeared rapidly over the first three days, and was almost completely utilised by seven days of age. 2 . 5 Digestive o rg a n develo p m e n t. After hatching the chicken needs to rapidly adapt from meeting its nutritional requirements from the yolk sac to utilising a diet based primarily on carbohydrates. To meet the nutritional needs for growth and maintenance in the developing chick, the digestive system is required to digest and absorb the exogenous diet at a rate sufficient to meet its demands. Therefore the relative growth rate of the gastrointestinal tract is greatest during the first seven days of age (Ij i et al., 200 l a). 2.6 Relative d ev e lopment of i n testi ne and digestive o rgans. Nitsan et a l . ( 1 99 1 b) showed that the growth of duodenum, j ej unum and ileum relative to bodyweight reached a maximum at 6 days of age and declined thereafter. Similar results were obtained by Nir et al. ( 1 993) with maximum relative weight of the small i ntestine occurring at 5 days of age, and by N itsan et al. ( 1 99 1 a) who showed a maximum relative growth rate 4-fold that of bodyweight gain at 8 days of age. Ij i et al. (200 1 a) and Murakami et al. ( 1 992) also showed the relative small intestine weight was m aximal at seven days of age after which it declined. N itsan et al. ( 1 99 1 b) showed that relative liver weight peaked at 6 days of age, and relative pancreas weight peaked at 9 days of age. In another study, Nits an et al. ( 1 99 1 a) showed an increase in relative pancreas weight to 8 days of age at which stage it had an. 6.
(21) allometric growth rate approximately 4-fold that of body growth. After 8 days of age, the rate decreased and by day 23 the allometric growth rate of the pancreas was 2 . 5 times that o f bodyweight. In this study, the l iver reached a maximum allometric growth rate on day 1 1 of two, and by day 1 5 this had declined to be similar to body growth. S imilar trends have been reported for turkey poults by Sell et al. ( 1 99 1 ), although the relative growth rate of the pancreas, proventriculus and small i ntestine in the poults appeared to peak somewhat earlier at six days of age, after which the weight increases of the pancreas and small intestine nearly paralleled that of bodyweight. However Krogdahl and Sell ( 1 989) found the relative weight of the pancreas in poults to peak at about 1 4 days of age, and to decrease thereafter, still decreasing at 56 days of age. In this study, the pancreas constituted 0. 1 % of bodyweight at hatch, 0.4 to 0 . 5 % at 14 days of age and 0.2% of bodyweight at 5 6 days of age. Pinchasov ( 1 995) showed that in turkey poults the relative weights of the gastro-intestinal tract, liver and pancreas increased in the first 24 hours after hatching irrespective of whether or not the birds had been fed, although the increase was greater in fed birds. A similar pattern of organ growth was observed in chicks by Murakami et al. ( 1 992). In summary it would appear that maximum relative growth rate of the digestive organs is achieved within the first 1 0 days of life and after this stage it declines to eventually approach that of bodyweight gain. This is consistent with the demand on supply organs caused by maximal relative body growth being achieved over 5 to 1 0 days of age. 2 .7 Develo p m e n t of gut m u cosa. Changes in villus height, crypt depth or submucosa thickness may influence the uptake of nutrients by the young chick. Uni et al. ( 1 99 5b) reported that between days four and 1 0, villus height and perimeter increased by 2 5 to 1 00% in the duodenum, j ejunum and ileum o f the young chick. Crypt depth increased with age, but there were no changes in the thickness of submucosa. Uni et al. ( 1 998) observed that in the first two days after hatch villus volume in the duodenum, j ej unum and ileum changed little, but volume in all three segments increased rapidly thereafter. The increase was complete in the duodenum by day 7, however vil lus size in the j ej unum and i leum increased until day 1 4. Increases with age were greatest in the duodenum and least in the i leum. Enterocyte numbers per vill us were similar i n all segments, and changed l ittle with age. Crypt. 7.
(22) depth was greatest i n the duodenum and overall i ncreased two to threefold with age. The authors studied the effects of withholding feed for 3 6 hours or of deutectomy on villus volume, and reported that a decrease in j ej una! villus volume was still evident after day 1 1 in the deutectomised chicks and those from which feed was withheld. Furthermore, crypt depth was also decreased for 8 to 1 0 days in the duodenum and j ej unum and 5 days in the i leum, and crypt structure was abnormal between days 7 and 9. Ij i et al. (200 1 a) found that although intestinal mucosa was structurally developed at hatch, rapid growth through rapid cell proliferation, hypertrophy and an increased migration rate fol lowed for the next several days. The rate of cell proliferation peaked at 7 days of age, and cellular migration at 1 4 days of age. The increase in cell proliferation may be to support both crypt and villus growth.. The percentage of. proliferating cells was studied by Geyra et al. (200 l ) who found all cells along the villus proliferating in all segments of the intestine at hatch. In fed birds, the percentage of proliferating cells decreased with time to plateau at 1 0-20% by approximately day 4. Cell proliferation was sensitive to feed intake, however re-feeding fasted birds rapidly enhanced cell proliferation. Noy et al. (200 1 ) found that cell proliferation in turkey poults declined to less than l 0% within 48 hours of hatch. 2 .8 Mucosal D NA. A measure of cell proliferation within the mucosa can be obtained through the ratio of RNA to DNA, which gives an indication of ribosomal activity (Uni et al., 1 995a). Uni. et. al. ( 1 998) found the RNA : DNA ratio to be higher in duodenal and j ej una! tissues. when compared to the ileal tissue, indicating greater cell proliferation. In all segments the ratio decreased with age, but at different rates. Protein to DNA ratios, which reflect cell size, were initially higher in the duodenum but decreased with age indicating i ncreasing cell size. Overall , tissue and ribosomal activity decreased with age throughout the intestine, but at different rates. Generally duodenal tissue has the highest activity and i leal tissue the lowest, and the rate of activity decrease is lower in the ileum.. 8.
(23) DNA content of the mucosa gives a measure of the cell population. Iji et al. (200 l a) showed a declining DNA content in the duodenum, j ej unum and i leum with age. They also found increasing cell size with age, and that protei n synthesis declined with age. In summary, rapid growth of gut mucosa through cell proliferation and cell hypertrophy occurs over the fi rst week of l ife. The rate of increase varies between different segments of the gut however all reach a maximum rate of development between days 7 and 1 4. 2 .9 Gastrointesti n a l tract pH. Digestive enzyme activity and microbial population is influenced by gut pH and changes may therefore impact on digestive capability. Mahagna and Nir ( 1 996) found that gut pH measured in the crop, gizzard and small intestine dropped from day one to its lowest value on day 7, before increasing again to a peak on day 1 4. No subsequent changes were measured in the crop or small intestine. However, in the gizzard the pH was lower on day 2 1 than on day 1 4. 2.10 Biliary sec retions a n d d igestive e n z ymes. m. the you n g broiler. c h i c ken 2. 1 0. 1 Bi l i ary secretions. Limited secretion of bile is known to be responsible for the poor fat absorption in the young chick. Noy and Sklan ( 1 995) found that secretion of bile components to the duodenum, including bile salts and fatty acids, i ncreased 8 to 1 0 fold between days 4 and 2 1 post-hatch. 2. 1 0.2 Pancreatic enzymes. Chickens adj ust to changes in dietary composition by altering enzyme secretion. For example, the neo-natal chick responds to dietary adjustments in starch intake by altering the amount of amylase released, and the enterocyte carbohydrase concentration (Moran, 1 985).. 9.
(24) Nitsan et al. ( 1 99 1 a) showed that the specific activity of the pancreatic enzymes trypsin, amylase and l ipase decreased durin g the first three to six days after hatching and then increased to a level 10 to 20% higher than that of hatching on days 1 4, 1 1 and 2 1 respectively. Chymotrypsin activity increased from shortly after hatch to day 1 4. When expressed as units of activity per kilogram of bodyweight, the activity of all enzymes increased with age, reaching a maximum on day eight for amylase and l ipase, and day 1 1 for trypsin and chymotrypsin. Noy and S klan ( 1 995) measured the secretion of l ipase, trypsin and amylase secretion in the duodenum of chicks aged four to 2 1 days of age, and also measured total nitrogen secretion to the duodenum as an indicator of total enzyme secretion. L ipase, trypsin and amylase secretions increased 20 to 1 00 fold from four to 2 1 days of age. Lipase activity increased less and somewhat more slowly than the other enzymes. Amylase secretion was relatively low at four days of age and increased rapidly with age. Total nitrogen secretion increased by 1 5 -fold between 4 and 2 1 days of age. Nir et al. ( 1 9 9 3 ) observed that the speci fi c activity (units/g) of amylase was highest at hatch and decreased up until day eight. Lipase activity increased from a very low level at hatch by about 40 fold on day 1 4. Trypsin specific activity increased gradually to reach a peak at 1 1 days o f age, while chymotrypsin declined during the first eight days of age and followed by a marked increase. When expressed as units of activity per kilogram o f bodyweight, all enzymes showed increased activity with age, reaching a maximum on day five for amylase, and around day 1 1 for trypsin and chymotrypsin. In turkey poults Sell et al. ( 1 99 1 ) observed that, when expressed in terms of bodyweight, the specific activities of amylase, lipase and trypsin showed moderate increases during late embryonic development. Following this, relatively large increases in the specific activity of amylase and l ipase were observed on day one, with amylase specific activity continuing to increase after day two, but l ipase activity not changing significantly after day one. Trypsin specific activity reached a peak on day six. Krogdahl and Sell ( 1 9 89) found that the specific activities of pancreatic trypsin, protease and lipase in turkey poults i ncreased with age after a lag period of about 1 4 days. They suggested that the mechanisms regulating l ipase production i n poults are not fully developed during the first few weeks after hatch and that lipase may be a l im iting factor for l i p id digestion in the early post-hatch period for turkeys. Amylase activity 10.
(25) seemed to increase rapidly during the first 1 4 days, but the activity of the enzyme varied widely between samples. In summary, although secretion of pancreatic enzymes with age vanes between enzymes and studies, there is a substantial body of evidence suggesting that pancreatic specific enzyme activity (units/g) either decreases or remains stable over the first week of life. Over this period, the total enzyme production increases when expressed relative to bodyweight, but the i ntestine grows at a relatively faster rate than bodyweight over this period, which may confound the interpretation of enzyme activity.. Pancreatic enzyme levels in digesta Pancreatic enzyme activity levels in the digesta may give an indication of the enzyme activity available to digest feed, and for this reason a number of researchers have measured this activity level. Nitsan et al. ( 1 99 1 a) measured digesta pancreatic enzyme activities and, found that trypsin activity increased 1 0-fold from hatching to day 1 4, and chymotrypsin activity i ncreased 3-fold to reach a maximum at 20 days of age. Amylase activity did not change for the first two days, but then increased 5 fold by 1 7 days of age. Lipase activity gradually increased to reach a level 2.5 times that of hatching on day 2 3 . Nir et al. ( 1 993) observed that the specific activities (units/g) of amylase, lipase, trypsin and chymotrypsin were very low at hatch and increased with age. When enzyme activity was expressed as units per kg of bodyweight amylase peaked at 5 days of age and then declined for the remainder of the experimental period. Lipase peaked at day 7 and then declined to day 1 1 , remaining at this level until day 1 4 . Trypsin and chymotrypsin increased throughout the 1 4 day trial period. Noy and Sklan ( 1 995) measured net amylase, trypsin and lipase secretion to the gut using 141 Ce. An increase in daily secretion was determined for amylase, trypsin, and lipase of 1 00- 50- and 20fold, respectively, between days 4 and 2 1 . The relative increases were lowest for lipase and highest for amylase. This study also determined changes in digestive capability over the first 2 1 days of age, and the authors concluded that enzymes are secreted in adequate levels for fatty acid and starch digestion in the young chick but that proteolysis may not be sufficient in the early post hatch period. However they qualify this by stating "From 1 0 days of age, increased feed intake was compensated for by enhanced intestinal capacity and enzyme secretion".. 11.
(26) Krogdahl and Sell ( 1 989) found that in turkey poults the trypsin, protease, and amylase activities followed similar patterns of development. Maj or increases in the activity of all enzymes were observed during the first 21 days after hatch, with no maj or changes in activity level observed after this time. D evelopment of l ipase activity appeared to be dependent on the fat content of the diet particularly after 2 1 days of age. However, even poults fed high fat diets had low intestinal content lipase activity prior to 2 1 days. In summary, there is a general trend for digesta enzyme activity levels to increase over the first 2 1 days of age however rates of development vary between enzymes. 2 . 1 0.3 Brush border enzymes. Disaccharidases are responsible for the breakdown of disaccharides (mainly maltose) obtained from starch digestion and are attached to the brush border of the small intestine. Mahagna and Nir ( 1 996) measured the activity of saccharase and maltase in broiler chicks and observed that the activities of both enzymes declined significantly from hatch to seven days of age whether expressed as units/gram of tissue or units/kg bodyweight. Activity levels of both enzymes remained low until 2 1 days of age. A study by U ni. et. al. ( 1 99 8) reported that j ej una! sucrase and maltase activities reached a. maximum on days 1 and 2 after hatch and decreased thereafter. They also reported that mucosal sucrase and maltase activities were lower in the duodenum than in the j ejunum or ileum. Ij i et al. (200 1 b) found similar results, with the maximal specific activities of sucrase and maltase at hatch, and declining thereafter. However, they reported that the total enzyme activity increased with age in all intestinal segments due to an increased villus surface area and intestinal length. In contrast to the study by Uni. et. al. ( 1 998),. these authors found that total enzyme activity per villus in the duodenum was higher than the activity per villus in the j ej unum and i leum as a result of the longer villi in the duodenum. Sell et al. ( 1 99 1 ) observed in turkey poults that, when expressed in units of bodyweight, the specific activity of maltase and sucrase peaked at one day of age and decl ined markedly through to six days of age before increasing again by eight days of age. I n contrast, a previous study by S e l l e t al. ( 1 989) reported that maltase and sucrase specific activities increased between one and seven days of age. Enzyme levels on day. 12.
(27) one were similar in both studies, however disaccharidase production then diverged. The authors could find no ready explanation for this divergence in enzyme production. In summary, although there are some conflicting results, there would appear to be a reduction in specific disaccharidase activity over the first week o f age.. However. increasing gut size would mean that there is an overall i ncrease in total enzyme activity.. 2 . 1 1 Com pa rison of g rowth, d igestive o rg a n d evelop m e n t a nd digestive enzyme levels in fast a nd slow growing lines of chickens.. Several researchers have compared organ growth and digestive enzyme levels in fast and slow growing lines o f chickens. Broiler chickens were compared with fast or slow growing lines of White P lymouth Rock chickens by Nitsan et al. ( 1 99 1 b). Comparisons of egg type chicks and broiler chicks were also undertaken by Nir et al. ( 1 993), Uni et. al. ( 1 995b) and Mahagna and Nir ( 1 996). 2. 1 1 . 1 B odyweight. Nitsan et al. ( 1 99 1 b) found that at hatching the difference in bodyweight between broiler chickens and slow growing Plymouth Rock chickens was less than twofold, with the fast growing P lymouth Rock chickens intermediate. This general pattern continued to 1 5 days of age by which time the difference in bodyweight between the two extremes increased to eightfold. Nir et al. ( 1 993) found that broiler chickens reached a maximum relative growth rate of 2 0% at day five which was maintained for a further five days, before declining to 1 6% on day 1 4. In contrast, the egg type chickens reached a peak of 1 4% relative growth rate at 4 days of age, before decl ining to 5% at 1 4 days of age. Uni. et. al. ( 1 99 5 b ) and Mahagna and Nir ( 1 996) found similar patterns o f growth when. comparing light and heavy strains of chickens. 2 . 1 1 .2 Feed i ntake. Nir et al. ( 1 993) found that food intake per unit o f bodyweight attained a peak of 30% at day three for the broiler chicks and 20% at day six for egg type chicks. I n both types,. 13.
(28) relative food intake then decreased to 1 5% of bodyweight by day 1 4. A similar pattern of feed intake was reported by Uni et a!. ( 1 995b). 2 . 1 1 . 3 Passage rate. Passage rate may affect digestibility and absorption of nutrients. In a study over the first 1 4 days of age, Uni et al. ( 1 995b) found passage rate at 4 days of age to be 50% shorter in light strain chicks compared to broiler chicks. However, by day 1 0 the difference between the strains was not significant. A similar pattern was observed in both strains, with passage time decreasing slightly between days 4 and 7 and increasing thereafter. 2 . 1 1 . 4 Vitel l ine residue. Nitsan. et. al. ( 1 9 9 1 b) found that relative to bodyweight, vitelline residue at hatch was. greatest for the fast growing Plymouth Rock chickens, and least for the broiler chickens. It was suggested that this is due to the greater demand for nutrients during the embryonic and transition periods of broiler chickens. 2 . 1 1 . 5 Development of digestive organs. Comparison of digestive organ development. m. broiler chickens and two lines of. Plymouth Rock chickens showed similar developmental trends (Nitsan. et. al. 1 99 1 b).. Relative weights for liver and pancreas showed that organ weights for broiler chickens tended to fall between those of the two lines of Plymouth Rock chickens. Differences in relative liver weights disappeared by day three, with an increase to day six and similar decreases thereafter in all lines. Marked increases in relative pancreas weight were observed in all strains until day nine. This was followed by decreases in all lines, but greater decrease was observed in the broiler chickens. Relative crop weights differed between lines, with the broiler chicken having a heavier crop at hatch, which decreased rapidly to be l ighter than the slow growing P lymouth Rock chicken by day nine. Relative proventriculus weight was also highest in the broiler chicken at hatch, but decreased rapidly to be the relatively the lightest of the three lines of chickens by day nine. A similar pattern in relative gizzard weight was observed. Overall the relative size o f the food storage organs (crop, proventriculus and gizzard) was largest at hatch, but smallest by day 1 5 in the broiler chicken strain. Growth pattern of the duodenum,. 14.
(29) j ej unum and ileum was generally similar in all cases, but the relative weights were lowest in the slow growing Plymouth Rock chickens (Nitsan et al. , 1 99 1 b). In contrast, Mahagna and Nir ( 1 996) found no age and line interactions between meat and egg type chickens. Throughout the 2 1 day trial period they observed the relative weight of the digestive tract to be heavier in the broiler chick and the pancreas lighter. The relative liver weight in the broiler chicken was higher than in the egg type chicken and the proventriculus weight lower throughout the trial period. In a comparative study to 1 4 days of age, Nir et al. ( 1 993) showed a greater increase in relative liver weight in the broiler type chicken than in the egg type chicken, and a slower growing pancreas so that from day eight the relative pancreas weight of the egg type chicken significantly exceeded that of the broiler type chicken. The relative weight of the small intestine was similar between the two types, and only on day eight was the relative weight of the broiler type chicken small intestine greater than that of the egg type chicken. In summary, all the above studies showed that, compared to the egg type chicken, the broiler chicken showed a faster decline in relative pancreas weight over the first 1 4 days of age. Furthermore, i n contrast to the egg type chicken, the broiler chicken over first few weeks of life may also have relatively smaller food storage organs with which to process a higher relative feed intake. 2 . 1 1 . 6 Gut morphology. Uni et al. ( 1 995b) showed that the broiler chickens had larger villi and more enterocytes than the light strain chickens for the first 1 0 days of age, although the rate of growth of the villi was similar between lines and villus height and perimeter increased in all segments in both lines between 25 and 1 00% over the period between 4 and 1 0 days of age. The comparison of line differences at the duodenum, j ejunum and i leum showed that the villi are longer and the degree of organisation greater in the heavy strain chicks than in the light strain chicks. As the villi enlarged with age, the number of villi per area decreased in both lines, but the villus volume was consistently greater in the heavy strain chickens. Interestingly, j ej una! and i leal villus volume was l inearly correlated with feed intake for both strains. The density of enterocytes did not. 15.
(30) change with age in either line, but it was consistently higher in the heavy chickens. It was noted that the overall length of the small intestine in the light chicken strain was only 70% that of the broi ler chicken. Yamauchi and Isshiki ( 1 99 1 ) made similar observations in a comparison of White Leghorn and broiler chickens from 1 to 30 days of age. They observed that at day 1 the duodenal villi of the broiler chicken had many more developed epithelial cell protrusions over the whole apical surface. From 1 0 days of age, the broiler chicken had villi which were more developed and larger, microvi l l i which were wider, and from the tip of the duodenal and jej una! villi more active extrusions of epithelial cells. They suggested that the broiler chicken has a greater absorptive surface area, and a more active intestinal function permitting a faster growth rate in the broiler chicken when compared to the White Leghorn birds. 2 . 1 1 . 7 Digestive enzyme activity 2. 1 1 . 7. 1. Pancreatic enzymes. A comparison of pancreatic enzymes in broiler chickens and two lines of Plymouth Rock chickens on days 3, 9 and 1 5 by Nitsan et al. ( 1 9 9 1 b) found that relative pancreatic trypsin levels at day three for broiler chickens and the fast growing line of Plymouth Rock chickens were two and four times greater than those of the slow growing Plymouth rock chickens, respectively. By day nine, the slow growing line had pancreatic trypsin levels similar to broiler chickens but both were lower than the fast growing Plymouth Rock line. By day 1 5 , broiler chickens had the lowest level of pancreatic trypsin per unit of bodyweight. Relative pancreatic chymotrypsin levels differed with age. On day three, the fast growing Plymouth Rock line had higher relative levels of pancreatic chymotrypsin than the other two lines. By day nine, the levels were similar for all lines of chickens. However, by day 1 5 , relative pancreatic chymotrypsin levels differed between the three l ines with the broiler chickens having the lowest l evel of pancreatic chymotrypsin per unit of body weight. Relative levels of pancreatic amylase decreased in all lines over the 1 5-day trial period. On day three, broiler chickens were intermediate between the two l ines of P lymouth. 16.
(31) Rock chickens. On day nine, although the pattern remained the same, the differences were no longer significant. On day 1 5, the broiler chicken and the slow growing line were similar and both had lower amylase levels than the fast growing P lymouth Rock line. Nir et al. ( 1 993) found that up to 14 days of age the specific activity of all the digestive enzymes (units/g) did not differ statistically between broiler chickens and egg type chickens. However the specific activities of amylase, trypsin and chymotrypsin was numerically higher i n the egg type chicks than i n broiler chicks. When expressed as units of activity per unit of bodyweight, the s lightly greater specific activities of amylase, trypsin and chymotrypsin in the egg type chicks were emphasised, becoming statistically significant in some cases. Uni et al. ( l 995b) compared the production of amylase, trypsin and lipase per gram of feed consumed for light and heavy strain chickens. Daily secretion per gram of feed was higher on day 4 in the heavy chickens. However, daily secretion of trypsin decreased in the heavy strain between days 4 and 7, but not in the light birds. Secretion of amylase and lipase per gram of feed increased only in the light strain birds between days 4 and 7 and decreased in both strains between days 1 0 and 1 4. After day 7, no differences were observed between strains. Nir et al. ( 1 993) suggested that although the specific activities (units/g) of pancreatic enzymes were similar between broiler and layer type chicks, the total activities relative to bodyweight i ndicate that they may be limiting digestion in broiler chicks. During the first week of l i fe , broiler chicks eat a daily food quantity reaching 25 to 3 0% of bodyweight, an amount double that of egg type chicks. This level of intake is not compensated by i ncreases in the relative size of the pancreas or small intestine, or by the activity of digestive enzymes, which were lower in the broiler chicks. It was concluded that, in comparison to the egg type chicks, the broiler chicks had a similar secretion of digestive enzymes to cope with a higher amount of chyme. In summary, it would appear that the increased feed intake o f the broiler chick during week one is not compensated for by a corresponding increase in production of pancreatic digestive enzymes.. 17.
(32) 2. 1 1. 7. 2. Brush border enzymes. M ahagna and Nir ( 1 996) measured the activity of saccharase and maltase in broiler and layer type chicks and observed that broiler chicks hatched with a reserve o f disaccharidases dramatically exceeding that of the egg type chicks. However, although the activities of both enzymes declined from seven to ten days of age in both types, the decline was much more noticeable in broiler chicks. From day seven to day 2 1 , the enzyme activity in egg type chicks markedly exceeded that in the broiler chicks both in terms of specific activity or activity per unit of bodyweight. The decline in brush border enzyme activity in the broiler chick may impact upon the digestive capability of the chick over the early period of l i fe. 2 .12 Digestion and utilisation of n utrients in newly hatc hed chicks. 2 . 1 2 . 1 Nutrient digestib i l ity. A number of studies have investigated the digestion and absorption of nutrients during the first few weeks post hatch. Noy and Sklan ( 1 995) measured the ileal digestibility o f nitrogen, fatty acids and starch over the period of 4 t o 2 1 days of age. Over this period, nitrogen digestibility increased from 78 to 92%. However starch and fatty acid digestibil ity did not change significantly over this period and ranged from 82 to 89%. I nterestingly, this study calculated fat digestibility at four days of age at over 85% in a diet containing 6% added unsaturated fat, and little increase in fat digestion over the remainder of the trial. Uni et al. ( 1 995b) also found i leal nitrogen digestibility increased from 78% on day 4 to c lose to 90% on day 1 4. This study found that ileal starch digestibility was between 90 and 95% and changed little over the period of 4 to 1 4 days o f age. I leal fatty acid digestibility ranged from 80 to 8 5 % over the period and also showed no change between 4 and 1 4 days of age. I n a series o f trials, Batal and Parsons (2002a,b) measured the amino acid digestibi lity of several diet types in. young chicks from hatch to 2 1 days of age. A trend for. digestibility to increase with age was observed in all trials . An exception to this trend. 18.
(33) was cysteine digestibility where a number of diets showed a numerical decrease in digestibility between days 0-2 and days 3-4. The cysteine digestibility increased again by day 7. With one diet this effect was statistically significant. Zelenka ( 1 973) reported that the coefficient of apparent digestibility of ether extract decreased from the day of hatch up to eight days of age, and then gradually increased until day 1 4. Carew et al. ( 1 972) fed diets containing 20% fat sourced from either maize oil or tallow and measured fat digestibility during days 2-7 and days 8- 1 5 . The average digestibility of the maize oil increased from 85 to 95%, and the beef tallow digestibility increased from 40 to 79% between the two assay periods. Of interest was the trend for the percentage of faecal fat to increase from day 3 to days 5 and 7, before decreasing to day 1 5 . This was attributed to changing transit time by the authors. A study by Eyssen and Desomer ( 1 963) measured the digestibil ity of fat over the first. 1 4 days of age in chicks fed diets based on glucose, sucrose, glucose-fructose and starch, without or with virginiamycin. The diets based on glucose, sucrose and glucose fructose showed a peak of fat malabsorption from the 5 th to the 9 th days of age during which 30 to 50% of the dietary fat was lost in the excreta. This malabsorption was suppressed by the addition of 1 00 ppm of virginiamycin. When fed a casein-sucrose diet without antibiotics, a growth depression was observed from 5 to 9 days of age. This was reversed by the addition of procaine penicillin or virginiamycin to the diet. The authors suggest that the growth-stimulating effe ct bf antibiotics may be due to the suppression of gram-positive intestinal bacteria as only antibiotics specifically targeting gram-positive bacteria reduced the malabsorption and stimulated growth. There was little or no malabsorption with the starch diet and no antibiotic response was observed. A further study by Eyssen and Desomer ( 1 967) using gnotobiotic chickens fed a 54% sterilised starch diet found that chicks inoculated with a bacteria free filtrate of faeces and. Streptococcus Jaecalis developed malabsorption and growth depression and. responded to antibiotics. This occurred over the period of 5 to 9 days of age and by day. 1 4 the affected chicks had a 1 5% reduction in bodyweight and a 70% increase in the relative weight of the small intestine. The chic ks which received both bacteria free filtrate and Streptococcus faecalis were more adversely affected than the controls which received either filtrate or Streptoccus faecalis, suggesting a growth depressing agent in the faecal fi ltrate. Although unable to identify the growth depressing agent in the. 19.
(34) filtrate, the researchers showed that it was inactivated with heat, but not affected by antibiotics and speculated that it may be a virus. In summary, there is evidence showing that digestibil ity increases over the first 1 4 days of life are not linear, and the digestibility o f some nutrients may decrease over the period of 5 to 9 days of age before increasing again by day 1 4. Factors which may cause this short term decrease in digestibility include a rapid increase in feed intake, combined with a decrease in pancreatic enzyme specific activity and a decrease in passage rate. Studies by Eyssen and Desomer ( 1 96 3 ; 1 967) suggest the changes in gut microflora may significantly reduce fat digestion over this period. By day 1 4 the more extreme effects of these factors would be diminished as relative feed intake is diminishing, increased pancreas size is producing total increases in pancreatic enzymes, and gut microflora is stabilising. 2 . 1 2 . 2 Energy uti lisation.. A series of studies were conducted by Zelenka ( 1 968) to study changes in the ability of broiler chickens to metabolise energy with age. The first study found that the apparent metabolisable energy (AME) of a practical diet decreased rapidly from day 3 after hatching to reach a low point at six to nine days of age before increasing again to 1 4 days of age. At 1 4 days o f age, the dietary AME was 9 . 8 percent higher than on day nine. A second study showed a similar pattern of decrease from hatching to a low point at 7-8 days of age fol lowed by a steady increase in AME to 1 4 days of age . In this study AME was 6 . 8 percent higher at day 1 4 than on day eight. Murakami et al. ( 1 992) also found that metabolisability of dietary energy and absorption of dietary lipids were highest at hatch, then declining to their lowest at day 5 or 6 and gradually increasing thereafter. A series of trials were conducted by Batal and Parsons to measure changes in AME of maize-soy diets over the first 14 days of age o f broiler chicks. The first study (Batal and Parsons, 2002a) showed a linear increase i n AME from day 2 to day 1 4, with nitrogen corrected AME (AMEn) values of 1 2.43 MJ/kg on day two increasing to 1 4. 3 5 MJ/kg on day 1 4. A second study (Batal and Parsons, 2 002a) reported AMEn of 1 3 .2 3 MJ/kg on days 0-2, which decreased to 1 2 . 5 5 MJ/kg on days 3 -4 before increasing again to 1 3 . 52 MJ/kg on day 1 4.. The third study (Batal and Parsons, 2002b) observed that. 20.
(35) AMEn values were higher at 0-2 days of age ( 1 2 . 6 7 MJ/kg) than at 3 -4 days o f age ( 1 1 .4 1 MJ/kg), and then i ncreased again by day 1 4 ( 1 3 .49 MJ/kg). Corless and Sell ( 1 999) reported an increase in AME between days 4 and 7 in turkey poults. However the day 4 values were 23% below the calculated values for the diets. They also recorded a drop in AME between days 7 and 1 4, which was attributed to a coronavirus infection. In summary, there is evidence to suggest a decline in metabolisable energy values over the first week of life, followed by an increase in the metabolisable energy of diets up to 14 days of age. This is primarily due to the decrease in fat digestibility observed by Zalenka ( 1 973) and Eyssen and Desomer ( 1 963) 2 . 1 3 N utritive v a l u e of cereals fo r pou ltry. It is known that the nutritional value of grains differs as a result of the specific composition of the grain. Wheat tends to have a lower metabolisable energy value than maize or sorghum, partially as the result of a higher digesta viscosity caused by the level of soluble non starch polysaccharides (NSP) in the grain which reduces digestion and absorption of a range of nutrients. However there are large variations in the N S P level o f cereals, particularly o f wheats, and therefore a wide variability i n A M E values has been reported for different wheat samples (Choct et al. , 1 999). Other factors affecting the metabolisable energy value of grains include the proportion of starch in the grain (Pirgozliev et al., 2003) and starch digestib i lity (Nicol et al. , 1 993).. A. confounding factor in determining poultry AME values is a wide bird variation which is more pronounced in poorer quality wheat (Wiseman et al. , 1 994) and sex differences (Hughes, 200 1 ). Variation in grain characteristics may be due to variety, seasonal effects, growth sites, crop treatment, fumigants, post-harvest storage conditions and length o f storage ( Hughes and Choct, 1 999). 2 . 1 3 . 1 Cereal energy values. The metabolisable energy value for maize is somewhat higher than that o f wheat ( rv 1 4 versus. ,..,_.. 1 2. 5 MJ/kg on an as fed basis) although there is wide variation within. each cereal type. One reason for the difference between cereals is the lower level of NSP in maize. Maize typically contains only l g/kg water soluble NSP compared with 24, 45 and 46 g/kg for wheat, barley and rye, respectively (Cowieson, 2005). Maize 21.
(36) also tends to have a higher level of starch (>600 g/kg) than wheat, which coupled with the lower level of NSP, enhances the metabolizable energy value of the grain. However the factors affecting the AME and nutritional value of the cereals are stil l not well understood. For example, Thacker (2005) compared wheat and maize based diets in broiler chickens and reported that the wheat based diets had higher digestibility coeffi cients for dry matter and energy than the maize based diets. 2 . 1 3 .2 D igestive tract devel opment. High fibre cereals generally increase the size of the gastrointestinal tract. Jorgensen et al. ( 1 996) found that diets supplemented with pea fibre, oat bran or wheat bran. increased both the length and weight of the gastrointestinal tract with increasing dietary fibre level. The weight and size of the caeca increased more than other segments of the gastrointestinal tract. Fibre level increased gut fil l by 0. 1 7g/kg bodyweight for each gram of NSP given as pea fibre. Steenfeldt (200 l ) observed a significant positive correlation between arabinoxylan level and the relative weights of the duodenum, j ej unum and ileum and a negative correlation between relative ileal weight and both AME and fat digestibility in broiler chickens fed diets based on wheat. 2 . 1 3 . 3 Gut morphology. A study by Ij i ( 1 999) found that guar gum and xanthin gum significantly increased crypt depth in both the j ej unum and ileum. Villus height was increased in the ileum but reduced in the j ej unum. The reduction in villus height in the j ej unum was accompanied by a reduction in both cell population and cell size. Carre et al. (2005) compared hard and soft wheats and found no significant effect on gut morphology. This lack of significance was attributed to high individual variability. 2 . 1 3 .4 Anti-nutritive activity of cereal non-starch polys accharides. There is a large body of evidence to show that soluble NSPs are a significant cause of the variation in the nutritional value of cereals. Choct and A nnison ( 1 990) found that the AME of rice, maize, sorghum, wheat, triticale, barley and rye were highly correlated with the summed levels of pentosans and P-glucans found in the cereals . Annison ( 1 99 3 ) makes a case for soluble N S P having anti-nutritive activity and being largely responsible for the low AME wheat phenomenon. He puts forward the fol lowing reasons in support of this hypothesis:. 22.
(37) 1.. Wheat AME values are negatively correlated with soluble non-starch. polysaccharide levels, 2.. Low. level. addition. (3 0g/kg). of. commercially. available. non-starch. polysaccharide depresses the AME of the diet, 3.. Degradation of the cell wall polysaccharides in situ by addition of glycanases to. broiler diets raises AME values, and 4.. Addition of purified wheat arabinoxylan to broiler diets depresses the AME in a. dose-dependent manner. Annison ( 1 99 1 ) also showed a highly significant negative correlation (r. =. -0 . 9 1 ,. P<0.000 1 ) between AME values and total NSP i n thirteen wheat samples. The addition of wheat pentosans to a commercial type broiler diet caused a general inhibition of nutrient digestion affecting starch, fat and protein (Choct and Annison, 1 990). In contrast, Nicol. et. al. ( 1 993 ) found no correlation between AME and total NSP. content, or AME and arabinoxylan content in I 0 samples of wheat of varying AME content, although they found a high correlation between AME and arabinose/xylose ratio, which is an indication of branching.. Wootton. et. al. ( 1 995) compared 1 9. Australian wheats and 1 2 American wheats, and reported a positive correlation between AME and pentosan level in Australian wheats. C hoct. et. al. ( 1 999) suggest that this. finding may be due to the comparatively narrow range of AME values into which the 1 9 samples fell ( 1 6 samples exceeded 1 4 MJ/kg D M and none were below 1 3 MJ/kg DM).. Phillips. et. al. (2004) found that dietary N S P content was not a consistent. predictor of viscosity in the ileum, and furthermore, that the addition of xylanase did not significantly reduce ileal viscosity. Although the mechanisms underlying the anti nutritive e ffects of N S P on wheat quality are not completely clear, the fact that poor quality wheats respond to the addition of exogenous xylanase points to arabinoxylans (NSP) having an important role in determining on the nutritional value of the grain. 2. 1 3 . 5. Phys ical and chemical propertie s o f soluble NSP which may. contribute to anti-nutritive properties 2. 1 3. 5. 1. Viscosity. When dissolved in water, most polysaccharides give viscous solutions. The viscosity is dependent on a number of factors, which include the size o f the m olecule, whether it is. 23.
(38) branched or linear, the presence of charged groups, the surrounding matrix, and the concentration. of the. polysaccharides. (Smits and. Annison,. 1 996). .. At. low. concentrations, the NSP increases viscosity by directly interacting with the water molecules. As the concentration increases, the NSP molecules begin to interact and become entangled which increases the viscosity further. Eventually the interactions can reach a level where gel formation takes place (Annison and Choct, 1 994, Smits and Annison, 1 996). Increases in digesta viscosity may inhibit nutrient digestion by impeding the diffusion of digestive enzymes and their substrates and products (Annison 1 993) or through viscosity-microflora interaction. Morgan and Bedford ( 1 995) showed a good correlatio n between viscosity and A M E (R2. =. 0.645 P. =. 0.009) in wheat. In. contrast Steenfeldt (200 1 ) found no correlation between intestinal viscosity and nitrogen corrected AME or fat digestibility. 2. 1 3. 5. 2. Surface activity. Polysaccharides can present charged surfaces, which may associate with food surfaces or lipid micelles. For example, pancreatic lipases act only at the lipid/water interface. I t is possible that the presence of N S P at this interface may b e the mechanism by which they inhibit the d igestion of fats (Annison 1 99 3 ) . 2. 1 3. 5 . 3. Water holding capacity. Soluble polysaccharides can trap water through the formation of networks. This gives rise to the viscous or gel effect referred to above (Annison and Choct, 1 994; Smits and Annison, 1 996). 2. 1 3. 5. 4. Viscosity-microflora interaction. Hubener et al. (2002) reported that dietary cereals producing high intestinal viscosities lead to increased overall bacterial activity in the small intestine. Furthermore, he reported that compared to a maize diet, colony forming units of mucosa associated bacteria such as enterobacteria and enterococci were higher in a wheat/rye diet. Annison ( 1 99 3 ) suggested that interaction between gut microflora and NSP causes variability in A M E in young chickens and may be partly responsible for the low-AME wheat phenomenon. Choct et al. ( 1 996) demonstrated that where large amounts of soluble NSP were present i n the diet there was. an. increase i n small intestine. 24.
(39) fermentation which negatively impacted on chick performance. Langhout et al. (2000) added highly methylated citrus pectin to a maize-based diet, which was fed to both conventional and germ-free chicks. They reported that faecal digestibilities of organic matter, crude fat, starch, and amino acids were reduced in the conventional chicks but not in the germ free chicks. Smits and Annison ( 1 996) reported that caecectomised chickens show a smaller negative effect from wheat pentosans than intact chickens on the digestion of long chain fatty acids. Furthermore, the addition of antibiotics to rye or wheat based diets improves chick growth and feed utilization, and the improvement is always greater in rye based diets than in wheat based diets, suggesting that the anti nutritive activity of NSP is related to the gut microflora of the chicken (Atmison and C hoct, 1 99 1 ) . 2. 1 3. 5. 5. Increase in the secretion of endogenous protein. Annison ( 1 99 3 ) suggested that the presence of arabinoxylans may increase the secretion of endogenous protein as wel l as inhibiting the degradation of protein in the gastro i ntestinal tract. Low ( 1 989) reported that the effects of NSP on the gastro-intestinal tract of the pig increased the secretory output of the salivary glands, stomach, liver pancreas and intestinal wal l . Angkanaporn et al. ( 1 994) suggest that a reduction in apparent amino acid digestion observed with pentosan dietary supplementation is due to endogenous amino acid losses at low levels of pentosan inclusion, and direct inhibition of protein breakdown and amino acid absorption with high levels of pentosan inclusion. 2 . 1 3 . 6 S ummary. I n summary, the anti-nutritive effect found in viscous grams, such as wheat, is a complex phenomenon. The means by which nutrient digestibility is reduced remains poorly understood. However it is generally believed that the presence of soluble N S P has a significant role in the metabolisable energy and feed value of the cereals. Further research should investigate the role of underlying biochemical and physical events including development of gut microflora and the relationship between gut development, enzyme secretion, and nutrient digestibility in wheat diets. The literature suggests that complex interactions between chick and feed substrate are involved in the development of digestive capability and an understanding of these is necessary to optimise performance in the modem broiler chicken.. 25.
Figure
+7
Outline
Related documents
Prevalence and factors associated with one-year mortality of infectious diseases among elderly emergency department patients in a middle-income country.. Maythita Ittisanyakorn 1,2
Although the information on cold-set gelation is limited as compared to that on heat-induced gelation, the results have showed that cold-set gels are different
The work is not aimed at measuring how effective your local polytechnic is, but rather to see what measures different community groups, including potential students, use when
In this paper we trace the early history of relativistic su- pertasks, as well as the subsequent discussions of Malament-Hogarth spacetimes as physically-reasonable models
The nutritive value in vitro organic matter digestibility, neutral detergent fibre and nitrogen content of Aries HD was similar to that of Yatsyn 1 perennial ryegrass, from
Nitri fi cation and sedimentary denitri fi cation occurred near the river mouth, nitri fi cation prevailed further offshore under the plume, and fi nally, phytoplankton
2 Equity Market Contagion during the Global Financial Crisis: Evidence from the World’s Eight Largest Economies 10..
Appendices Factors that have contributed to success or failure of the cooperative a Leadership Election of leaders Relationships between leaders and member Trust between members
