Int. J. Electrochem. Sci., 11 (2016) 1111 - 1120
International Journal of
ELECTROCHEMICAL
SCIENCE
www.electrochemsci.org
Electrochemical Preparation of Porous PtCu Alloy on an Ionic
Liquid Functionalized Graphene Film for the Electrocatalytic
Oxidation and Amperometric Detection of Ethanol
Fang Xu, Lite Yang, Faqiong Zhao, Baizhao Zeng*
Key Laboratory of Analytical Chemistry for Biology and Medicine (Ministry of Education), College of Chemistry and Molecular Sciences, Wuhan University, Wuhan 430072, Hubei Province, P. R. China
*
E-mail: [email protected]
Received: 29 September 2015 / Accepted: 14 December 2015 / Published: 1 January 2016
A novel porous PtCu film was prepared on an ionic liquid functionalized graphene film by electrodeposition and electrochemical oxidation. The porous PtCu film showed the features of alloy and had large active surface area. Its electrocatalytic activity was explored by taking ethanol as a model molecule, which exhibited sensitive oxidation peaks at the resulting electrode in H2SO4
solutions. Under the optimized conditions the oxidation current of ethanol at 0.65 V (vs SCE) was linear to its concentration in the range of 0.25−13 mM, the sensitivity was 11 μA mM-1cm-2 and the detection limit was 0.05 mM (S/N=3). The electrode was successfully applied to the determination of ethanol in alcoholic samples.
Keywords: PtCu alloy; Graphene; Electrodeposition; Ethanol; Ionic liquid
1. INTRODUCTION
alcohol. Ren et al [12] synthesized PtPd alloy catalysts with different Pt/Pd ratios in the absence of any stabilizers or surfactants, and they demonstrated that the PtPd alloy catalysts had high electrocatalytic activity for ethanol oxidation. However, to the best of our knowledge there are no reports about the amperometric determination of ethanol by using a porous PtCu alloy electrode.
Alloy catalysts can be prepared by various methods, among them electrodeposition method is more simple and controllable. For electrodeposition the support is important; it should be conductive and stable and has large specific surface. Graphene is a novel carbon nanomaterial and it presents good physicochemical properties, such as high thermal stability [13], high electronmobility [14] and high specific surface area [15]. Therefore, it should be a good support for electrodeposition. Graphene can be prepared by chemical reduction and electrochemical reduction. Guo et al thought that the graphene prepared by electrochemical reduction had superior electronic property [16-18]. In addition, Liu et al reported that the re-aggregation of graphene nanosheets could be prevented by functionalizing with ionic liquid (IL) [19, 20].
In this work, IL functionalized graphene was prepared by electrochemical reduction, and PtCu alloy was electrodeposited on the IL functionalized graphene. After part of Cu was removed by electrochemical oxidation a novel porous PtCu alloy was obtained. The electrocatalytic activity of the resulting porous alloy was explored by taking ethanol as a model molecule. It showed high electrocatalysis to the oxidation of ethanol. When it was used for the amperometric determination of ethanol it presented the advantages of short response time, high sensitivity and reproducibility.
2. EXPERIMENTAL
2.1. Reagents
H2PtCl6 and CuSO4 were purchased from Sinopharm Chemical Reagent Co. Ltd. (Shanghai,
China). The ionic liquid 1-(2-hydroxyethyl)-3-methylimidazolium bis(trifluoromethanesulfonyl)imide (purity: 99%) was provided by Lanzhou Institute of Chemical Physics (Lanzhou, China) and was used as received. Graphene oxide (GO) came from Xianfeng Reagent Co. Ltd. (Nanjing, China). Ethanol was the product of Sinopharm Chemical Reagent Co. Ltd. (Shanghai, China), and 0.5 mM ethanol solutions were prepared with 0.5 M H2SO4 solutions and were stored in a refrigerator. All other
chemicals used were of analytical reagent grade. The water used was redistilled.
2.2. Apparatus
obtained using a Hitachi X-650 SEM (Hitachi Co., Japan). X-ray diffraction (XRD) experiments were performed with a Bruke D8 diffractometer (Germany) using Cu Kα radiation (40 kV, 40 mA) with a Ni filter. All experiments were conducted at room temperature.
2.3. Preparation of modified layer
Firstly, GO was dispersed in redistilled water to prepare 1 mg/mL suspension, then 1 mL GO suspension and 1 mL IL solution (5 µL/mL, in dimethyl formamide (DMF)) were mixed with the aid of ultrasonication. Following this, 4 μL of the resulting suspension was transferred on a cleaned GCE (or ITO) and dried in air. Thus, an IL-GO film coated electrode (IL-GO/GCE) was obtained. The GO-IL/GCE was reduced at -1.3 V for 600 s in phosphate buffer solution (pH=6.0) and the resulting electrode was denoted as EGN-IL/GCE. PtCu was electrodeposited on the EGN-IL/GCE from the electrolyte solution of 1 mM H2Pt6Cl4 + 100 mM CuSO4 + 0.2 M Na2SO4. The electrodeposition
potential was -0.2 V and the electrodeposition time was 500 s. The obtained electrode (PtCu/EGN-IL/GCE) was washed carefully with redistilled water. Then it undergone repetitive cyclic potential scan (about 10 circles) between -0.3 V and 1.2 V in a 0.5 M H2SO4 solution until a stable cyclic
voltammogram was obtained. Thus part of Cu was removed and a porous PtCu-EGN-IL/GCE was obtained. For comparison, PtCu/GCE and Pt/EGN-IL/GCE were fabricated through the similar method.
2.4. Electrochemical measurement
An 8 mL 0.5 M H2SO4 and proper amount of ethanol were transferred to a 10 mL cell, then the
electrode system was installed on it. Cyclic voltammograms were recorded between -0.4 V and 1.6 V, and chronoamperometric response curves were recorded at 0.65 V.
3. RESULTS AND DISCUSSION
3.1. Morphological analysis
Figure 1. SEM images of EGN (a), EGN-IL/ITO (b), PtCu/ITO(c),PtCu-EGN-IL/ITO (d) and porous PtCu-EGN-IL/ITO (e). The solution composition (for electrodeposition): 0.2 M Na2SO4
+ 1.0 mM H2Pt6Cl4 + 100 mM CuSO4; electrodeposition potential: -0.2 V; electrodeposition
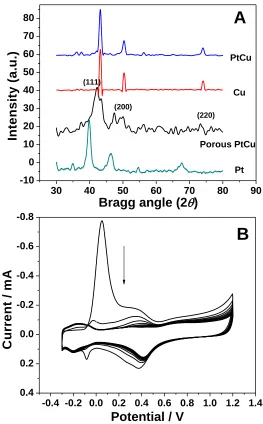
time: 500 s.
3.2. Composition and structure analysis
The composition of porous PtCu film was detected by EDS (see Supporting Materials, Fig. S1). The result showed that the atomic ratio of Pt:Cu was about 1:1, indicating that the porous film contained Cu. We thought that only part of Cu formed alloy with Pt during the electrodeposition and it was more difficult for this part of Cu to oxidize. This point was supported by the cyclic voltammetric experiment as shown in Fig. 2B. When the potential scan was repeated the oxidation peak of Cu (around 0 V) decreased rapidly, and the cyclic voltammogram gradually became stable. As the resulting porous film still contained some Cu, it could be deduced that the Cu in alloy was more stable. Fig. 2A shows the XRD patterns of Pt, Cu, PtCu and porous PtCu electrodeposited on EGN-IL/ITO. A series of broad Bragg peaks occur, and it is typical for material of limited structural coherence. For the electrodeposited Pt the peaks at 39.71°, 46.11° and 67.32° can be ascribed to the diffraction of Pt (111), (200) and (220), respectively. They are in accord with the standard XRD pattern of Pt (JCPDS 04-0784). The peaks at 54° and 60° are caused by ITO. Although the XRD signals of porous PtCu are weak due to the small amount remained on the EGN-IL/ITO, it can be seen that the peaks of porous PtCu shift to higher 2θ values in comparison with the corresponding peaks of Pt and locate between the peaks of pure Pt and Cu (JCPDS 04-0836). This indicates that the porous PtCu is alloy rather than a mixture of monometallic materials. It should be mentioned that the pattern
c
e
d
[image:4.596.101.496.68.343.2]
of PtCu (before removing Cu) is similar to that of Cu in this case. The reason is that the content of Pt in PtCu film is very low.
30 40 50 60 70 80 90
-10 0 10 20 30 40 50 60 70 80
In
te
n
s
it
y
(
a
.u
.)
Bragg angle (2)
(220) (200)
(111)
A
Porous PtCu
Pt PtCu
Cu
-0.4 -0.2 0.0 0.2 0.4 0.6 0.8 1.0 1.2 1.4 0.4
0.2 0.0 -0.2 -0.4 -0.6 -0.8
C
u
rr
e
n
t
/
m
A
Potential / V
[image:5.596.166.429.134.558.2]B
Figure 2. (A) XRD patterns of PtCu, Cu, porous PtCu and Pt (from upper to bottom) electrodeposited on EGN-IL film. (B) Cyclic voltammograms of PtCu-EGN-IL/GCE in 0.5 M H2SO4 (from
outer to inner: 1st CV to 10th CV). Scan rate: 100 mV s-1.
3.3. Electrochemical characterization of PtCu-EGN-IL/GCE
The voltammogram of porous PtCu-EGN-IL/GCE is shown in Fig. 3. As can be seen, in 0.5 M H2SO4 it exhibits a cathodic peak at about 0.4 V, which can be ascribed to the reduction of platinum
0.21 mC cm-2 and QH is the charge consumed during hydrogen adsorption), the EASAs of porous
PtCu-EGN-IL/GCE and Pt-EGN-IL/GCE are estimated and they are 1.15 cm2 and 0.48 cm2, respectively. This indicates that the porous PtCu-EGN-IL/GCE has larger Pt surface area.
-0.4 -0.2 0.0 0.2 0.4 0.6 0.8 1.0 1.2 1.4 0.20
0.15 0.10 0.05 0.00 -0.05 -0.10 -0.15
b a
C
u
rr
e
n
t
/
m
A
[image:6.596.164.430.152.367.2]Potential / V
Figure 3. Cyclic voltammograms of porous PtCu-EGN-IL/GCE (a) and Pt-EGN-IL/GCE (b) in 0.5 M H2SO4. Scan rate: 100 mV s-1.
3.4. Electrocatalytic oxidation of ethanol
The cyclic voltammograms of ethanol at GCE, EGN-IL/GCE, porous PtCu/GCE, Pt-EGN-IL/GCE, porous PtCu-EGN/GCE and porous PtCu-EGN-IL/GCE are shown in Fig. 4. Ethanol does not produce any peaks at bare GCE and EGN-IL/GCE, but it exhibits peaks at other electrodes. For different electrodes the peak current (Ip) follows such order as: Ip(porous PtCu/GCE) < Ip
(Pt-EGN-IL/GCE) < Ip(porous PtCu-EGN/GCE) < Ip(porous PtCu-EGN-IL/GCE). This means that the porous
PtCu-EGN-IL/GCE has larger catalytic surface and/or higher catalytic activity. Part of the reason is that both EGN and IL can promote the electrodeposition of PtCu, and more PtCu is electrodeposited on the EGN-IL film.
As expected the concentrations of H2PtCl6 and CuSO4 affected the peak currents (or
oxidation) of ethanol at the resulting porous PtCu-EGN-IL/GCE (Fig. S2 A). When the concentration of H2PtCl6 was 1 mM, the peak currents of ethanol increased with enhancing CuSO4 concentration
until it was up to 100 mM. Further increasing CuSO4 concentration the peak currents decreased.
Therefore, 1 mM H2PtCl6 and 100 mM CuSO4 were used in the following experiments.
0.0 0.2 0.4 0.6 0.8 1.0 1.2 1.4 10 0 -10 -20 -30 -40 -50 -60 a C u rr e n t d e n s it y / m A c m -2
Potential / V
f
Figure 4. Cyclic voltammograms of GCE (a), EGN-IL/GCE(b), porous PtCu/GCE (c), Pt-EGN-IL/GCE (d), porous PtCu-EGN/GCE (e) and porous PtCu-EGN-Pt-EGN-IL/GCE (f) in 0.5 M H2SO4
containing 0.5 M ethanol.
The influence of electrodeposition time was also explored (Fig S2 C). As a result, when it was increased more PtCu was electrodeposited on the EGN-IL/GCE, and the peaks of ethanol were bigger. The peak currents reached maximum values around 500 s. When electrodeposition time was further increased the peak currents decreased. This should be ascribed to the heavily aggregation of PtCu particles, which affected the removing of Cu and made the active surface area of the resulting porous PtCu-EGN-IL/GCE to decrease.
3.5. Variation of oxidation current with ethanol concentration
0 50 100 150 200
0 -1 -2 -3 -4 -5 -6 -7 -8 C u rr e n t d e n s it y / A c m -2
Time / s 2.0 mM
4.0 mM
1.0 mM
0.5 mM 0.25 mM
0 2 4 6 8 10 12 14 16
0.00 0.04 0.08 0.12 0.16 0.20 C u rr e n t d e n s it y / m A c m-2
[image:7.596.188.405.72.251.2]Concentration / mM
Figure 5. Amperometric response of the porous PtCu-EGN-IL/GCE to successive addition of ethanol. Support electrolyte: 0.5 M H2SO4; applied potential: 0.65 V. Inset: corresponding calibration
[image:7.596.173.426.499.704.2]
The chronoamperometric response curve of the porous PtCu-EGN-IL/GCE to ethanol was recorded (Fig. 5). As could be seen, the oxidation current of ethanol at 0.65 V depended on its concentration. A good linear relationship was obtained over the range of 0.25 −13 mM. The regression equation was I (mA) = 0.011c + 0.0023 (c: mM). The sensitivity was 11 μA mM-1cm-2 and the detection limit was estimated to be 0.05 mM (S/N=3). Compared with other electrodes the porous PtCu-EGN-IL/GCE showed good sensitivity and detection limit [24-28] (Table S1).
3.6. Stability, reproducibility and interference of foreign species
The reproducibility and stability of the porous PtCu-EGN-IL/GCE were tested. When a 5 mM ethanol solution was measured for 12 times by using a porous PtCu-EGN-IL/GCE the relative standard deviation (RSD) of the response current was 4.5%. When the ethanol solution was measured by using five porous PtCu/EGN-IL/GCE electrodes the RSD was 6.9%. After the porous PtCu-EGN-IL/GCE was stored for one week the current response became 86% of its initial value. After a month-storage it decreased by 26%. This was related to the adsorption of foreign species on porous PtCu-EGN-IL/GCE, which could be reduced by cycling the potential in H2SO4 solution before measurement.
The influence of some compounds was also tested. The results showed that for 0.5 mM ethanol at least 100-fold glucose, 0.1-fold of methanol and acetaldehyde did not interfere with the determination of ethanol. The influence of ascorbic acid and some easily oxidized substances could be eliminated by measuring the oxidation current at lower potential. Therefore, the porous PtCu-EGN-IL/GCE can be used for the determination of ethanol in some samples.
3.7. Application
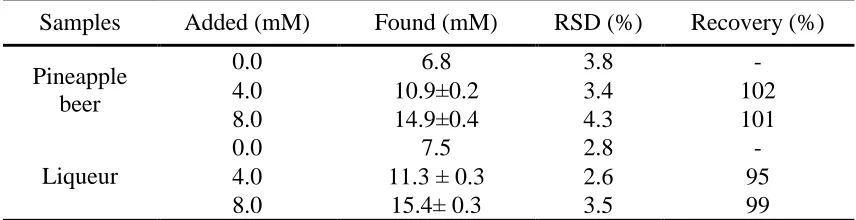
The proposed method was applied to the determination of ethanol in pineapple beer and white wine (from local market). Prior to determination 200 L pineapple beer sample was diluted to 10 mL with 0.5 M H2SO4, and 10 L liqueur sample was diluted to 10 mL with 0.5 M H2SO4. The
[image:8.596.84.512.652.762.2]measurement results were shown in Table 1. The ethanol contents in the original pineapple beer and liqueur samples were ca. 1.97% and 43.7% respectively, which were in agreement with the declared values on the labels. Standard ethanol solutions were added to the samples to estimate the recoveries and they were 95−102%.
Table 1. Measurement results of ethanol in some samples by using the proposed method. (n=5)
Samples Added (mM) Found (mM) RSD (%) Recovery (%) Pineapple
beer
0.0 6.8 3.8 -
4.0 10.9±0.2 3.4 102
8.0 14.9±0.4 4.3 101
Liqueur
0.0 7.5 2.8 -
4.0 11.3 ± 0.3 2.6 95
4. CONCLUSION
In this work, a porous PtCu alloy film was prepared on an ionic liquid functionalized graphene film by electrodeposition and following electrochemical oxidation. The ionic liquid functionalized graphene could promote the deposition of PtCu, and the Cu in PtCu alloy was more difficult to oxide. The resulting porous PtCu alloy film showed large catalytic active surface and platinum was fully used through this way. It exhibited high catalytic activity to the electrocatalytic oxidation of ethanol in H2SO4 solutions. The porous PtCu alloy film had potential application in constructing full cell and
ethanol sensor.
ACKNOWLEDGEMENTS
The authors appreciate the financial support from the National Natural Science Foundation of China (Grant No.: 21075092 ), the State Key Laboratory of Advanced Technology for Materials Synthesis and Processing (Wuhan University of Technology, Wuhan China, Grant No. 2010-KF-12).
References
1. J. J. Huang, W. S. Hwang, Y. C. Weng and T. C. Chou, Thin Solid Films, 516 (2008) 5210. 2. M. Chatterjee, A. Chatterjee, S. Ghosh and I. Basumallick, Electrochim. Acta, 54 (2009) 7299. 3. J. M. Sieben, M. M. E. Duarte and C. E. Mayer, J. Appl. Electrochem., 38 (2008) 483.
4. C. T. Hsieh, Y. Y. Liu, W. Y. Chen and Y. H. Hsieh, Int. J. Hydrogen Energy, 36 (2011) 15766. 5. E. Antolini, F. Colmati and E. R. Gonzalez, J. Power Sources, 193 (2009) 555.
6. M. B. de Oliveira, L. P. R. Profeti and P. Olivi, Electrochem. Commun., 7 (2005) 703.
7. B. Liu, H. Y. Li, L. Die, X. H. Zhang, Z. Fan and J. H. Chen, J. Power Sources, 186 (2009) 62. 8. E. Devers, C. Geantet, P. Afanasiev, M. Vrinat, M. Aouine and J. L. Zotin, Appl. Catal. A-Gen.,
322 (2007) 172.
9. A. Safavi, N. Maleki, F. Farjami and E. Farjami, J. Electroanal. Chem., 626 (2009) 75. 10.M. L. Yang, J. Power Sources, 229 (2013) 42.
11.X. Z. Wang, H. Xue, L. J. Yang, H. K. Wang, P. Y. Zang, X. T. Qin, Y. N. Wang, Y. W. Ma, Q. Wu and Z. Hu, Nanotechnology, 22 (2011) 395.
12.F. F. Ren, H. W. Wang, C. Y. Zhai, M. S. Zhu, R. R. Yue, Y. K. Du, P. Yang, J. K. Xu and W. S. Lu, ACS Appl. Mater. Interfaces, 6 (2014) 3607.
13.A. A. Balandin, S. Ghosh, W. Z. Bao, I. Calizo, D. Teweldebrhan, F. Miao and C. N. Lau, Nano lett., 8 (2008) 902.
14.R. F. Service, Science, 324 (2009) 875.
15.T. N. Lambert, C. A. Chavez, B. Hernandez-Sanchez, P. Lu, N. S. Bell, A. Ambrosini, T. Friedman, T. J. Boyle, D. R. Wheeler and D. L. Huber, J. Phys. Chem. C, 113 (2009) 19812. 16.X. H. Wang, I. Kholmanov, H. Chou and R. S. Ruoff, ACS Nano 9 (2015) 8737.
17.Y. Y. Shao, J. Wang, M. Engelhard, C. M. Wang and Y. H. Lin, J. Mater. Chem., 20 (2010) 743. 18.S. Wu , X. Q. Lan, L. J. Cui, L. H. Zhang, S. Y. Tao, H. N. Wang, M. Han, Z. G. Liu and C. G.
Meng, Anal. Chim. Acta, 699 (2011) 170.
19.Z. M. Liu, Z. L. Wang, Y. Y. Cao, Y. F. Jing and Y. L. Liu, Sens. Actuators B, 157 (2011) 540. 20.M. H. Yang, B. G. Choi, H. Park, T. J. Park, W. H. Hong and S. Y. Lee, Electroanalysis, 23 (2011)
850.
21.L. Y. Chen, Y. H. Tang, K. Wang, C. B. Liu and S. L. Luo, Electrochem. Commun., 13 (2011) 133. 22.M. H. Martin and A. Lasia, Electrochim. Acta, 53 (2008) 6317.
24.L. N. Wu, M. McIntosh, X. J. Zhang and H. X. Ju, Talanta 74 (2007) 387.
25.Y. Liu, L. Zhang, Q. H. Guo, H. Q. Hou and T. Y. You, Anal. Chim. Acta, 663 (2010) 153. 26.Y. C. Weng, J. F. Rick and T. C. Chou, Biosens. Bioelectr., 20 (2004) 41.
27.M. M. Barsan and C. M. A. Brett, Talanta, 74 (2008) 1505. 28.Y. S. Chen and J. H. Huang, Biosens. Bioelectr., 26 (2010) 207.