White Rose Research Online URL for this paper:
http://eprints.whiterose.ac.uk/127055/
Version: Accepted Version
Article:
Casewell, S.L., Braker, I.P., Parsons, S.G. orcid.org/0000-0002-2695-2654 et al. (9 more
authors) (2018) The first sub-70 minute non-interacting WD-BD system: EPIC212235321.
Monthly Notices of the Royal Astronomical Society. ISSN 0035-8711
https://doi.org/10.1093/mnras/sty245
This is a pre-copyedited, author-produced PDF of an article accepted for publication in
Monthly Notices of the Royal Astronomical Society following peer review. The version of
record Casewell, S.L. et al (2018) The first sub-70 minute non-interacting WD-BD system:
EPIC21223532 is available online at: https://doi.org/10.1093/mnras/sty245
[email protected]
https://eprints.whiterose.ac.uk/
Reuse
Unless indicated otherwise, fulltext items are protected by copyright with all rights reserved. The copyright
exception in section 29 of the Copyright, Designs and Patents Act 1988 allows the making of a single copy
solely for the purpose of non-commercial research or private study within the limits of fair dealing. The
publisher or other rights-holder may allow further reproduction and re-use of this version - refer to the White
Rose Research Online record for this item. Where records identify the publisher as the copyright holder,
users can verify any specific terms of use on the publisher’s website.
Takedown
If you consider content in White Rose Research Online to be in breach of UK law, please notify us by
The first sub-70 minute non-interacting WD-BD system:
EPIC212235321
S. L. Casewell
1
⋆
, I. P. Braker
1
, S. G. Parsons
2
, J. J. Hermes
3
†
, M.R. Burleigh
1
,
C. Belardi
1
, A. Chaushev
1
, N. L. Finch
1
, M. Roy
1
, S. P. Littlefair
2
, M. Goad
1
and E. Dennihy
3
1Department of Physics and Astronomy, Leicester Institute of Space and Earth Observation, University of Leicester,
University Road, Leicester LE1 7RH, UK
2Department of Physics and Astronomy, University of Sheffield, Sheffield, S3 7RH, UK
3Department of Physics and Astronomy, University of North Carolina, Chapel Hill, NC 27599-3255, USA
Accepted XXX. Received YYY; in original form ZZZ
ABSTRACT
We present the discovery of the shortest-period, non-interacting, white dwarf-brown dwarf post-common-envelope binary known. The K2 light curve shows the system, EPIC 21223532 has a period of 68.2 min and is not eclipsing, but does show a large reflection effect due to the irradiation of the brown dwarf by the white dwarf primary. Spectra show hydrogen, magnesium and calcium emission features from the brown dwarf’s irradiated hemisphere, and the mass indicates the spectral type is likely to be L3. Despite having a period substantially lower than the cataclysmic variable period minimum, this system is likely a pre-cataclysmic binary, recently emerged from the common-envelope. These systems are rare, but provide limits on the lowest mass object that can survive common envelope evolution, and information about the evolution of white dwarf progenitors, and post-common envelope evolution.
Key words: brown dwarfs, binaries, white dwarfs,
1 INTRODUCTION
To date, there are only a handful of known close, detached, post-common envelope systems containing a white dwarf with a brown dwarf companion. This is not surprising, as brown dwarf companions to main sequence stars within 3 AU are rare compared to planetary or stellar compan-ions to main sequence stars (Grether & Lineweaver 2006; Metchev & Hillenbrand 2004). For instance, the Super-WASP survey (Pollacco et al. 2006) has discovered over 120 confirmed extrasolar planets, but only one brown dwarf, WASP-30b (Anderson et al. 2011), within the same param-eter space, although this may be due to selective follow-up. Brown dwarf companions to white dwarf stars are even rarer with only 0.5% of white dwarfs having a brown dwarf com-panion (Steele et al. 2011). Despite many candidate systems being discovered from all-sky surveys (e.g. Girven et al. 2011; Debes et al. 2011), only eight post-common enve-lope systems have been confirmed: GD1400 (WD+L6, P=9.98 hrs; Farihi & Christopher 2004; Dobbie et al. 2005; Burleigh et al. 2011), WD0137-349 (WD+L6-L8, P=116 min; Maxted et al. 2006; Burleigh et al. 2006a),
⋆
E-mail: [email protected]
† Hubble Fellow
WD0837+185 (WD+T8, P=4.2 hrs; Casewell et al. 2012), NLTT5306 (WD+L4-L7, P=101.88 min;Steele et al. 2013), SDSS J155720.77+091624.6 (WD+L3-L5, P=2.27 hrs); Farihi et al. 2017, SDSS J1205-0242 (WD+L0, P=71.2 min; Parsons et al. 2017; Rappaport et al. 2017), SDSS J1231+0041 (WD+M/L, P=72.5 min;Parsons et al. 2017) and SDSS J141126.20+200911.1, (WD+T5, P=121.73 min; Beuermann et al. 2013; Littlefair et al. 2014). All of these systems have survived a phase of common-envelope evolu-tion, resulting in the close binary system. These systems are all detached, and the brown dwarf is likely tidally-locked. Eventually, they will become cataclysmic variables, such as SDSS1433+1011 in which the substellar donor was recently detected (Hern´andez Santisteban et al. 2016a).
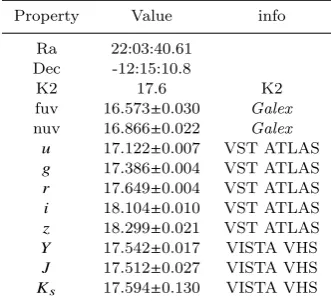
Property Value info Ra 22:03:40.61
Dec -12:15:10.8
K2 17.6 K2 fuv 16.573±0.030 Galex
nuv 16.866±0.022 Galex
u 17.122±0.007 VST ATLAS
g 17.386±0.004 VST ATLAS
r 17.649±0.004 VST ATLAS
i 18.104±0.010 VST ATLAS
z 18.299±0.021 VST ATLAS
Y 17.542±0.017 VISTA VHS
J 17.512±0.027 VISTA VHS
Ks 17.594±0.130 VISTA VHS
consistent with the cloud composition of an L dwarf, sug-gesting that these objects can be used as directly detected proxies for exoplanets.
Here we present the discovery of the shortest-period, non-interacting, white dwarf-brown dwarf post-common-envelope binary known to date.
2 KEPLER OBSERVATIONS
The Kepler 2 (K2) mission (Howell et al. 2014) has ob-served hundreds of spectroscopically and photometrically identified white dwarfs. EPIC212235321 was identified as a photometric candidate white dwarf from the SuperCos-mos Sky Survey (Hambly et al. 2001a,b,c) and was proposed as a target by PI Kilic in Campaign 3 field (RA 22:26:40, DEC -11:05:48). See Table1for the photometric parameters. EPIC212235321 was observed by K2 for≈69days between 2014 Nov 15 and 2015 Jan 23 in long cadence mode. Our analysis used the K2 Guest Observer Office (Van Cleve et al. 2016) lightcurve obtained through the Mikulski Archive for Space Telescopes (MAST). The light curve was nor-malised and flagged points (such as those affected by cosmic ray hits) were removed resulting in a lightcurve with 3151 data points. We searched for periodicity in the lightcurve using Lomb-Scargle (Lomb 1976; Scargle 1982) and dis-crete fourier transform periodograms in idl and the peri-odogram software packages Vartools (Hartman & Bakos 2016) and Period04 (Lenz & Breger 2005). These identi-fied a most likely period of 0.047369569±0.000000056days (≈68.21 minutes) with period uncertainties determined using the bootstrap resampling (with replacement) methodology detailed in Lawrie et al. 2013a; with a normalised ampli-tude of 0.05650±0.00009. A Monte Carlo significance test was undertaken on the period as outlined inCumming et al. 1999; Lawrie et al. 2013b yielding a False Alarm Proba-bility of < 0.001. The lightcurve is shown in Figure 1. A sine curve was fitted to the data using MPFIT (Markwardt 2009) as implemented byLawrie et al. 2013bgiving a com-bined ephemeris of BJD = (2457011.653656±0.000013) + (0.047369569±0.000000056) * E.
[image:3.595.314.537.107.270.2]Due to the large number of points in the K2 lightcurve (3151), this fitting produced a very precise period which is still more precise than our follow-up high cadence data, taken a year later.
Figure 1. Phase folded K2 long cadence data lightcurve for EPIC21223535321 binned over 50 equally spaced bins. The red line shows the sinusoidal fit to the lightcurve.
3 OPTICAL PHOTOMETRY
We observed EPIC212235321 using the Sutherland High-speed Optical Camera (SHOC;Coppejans et al. 2013) cam-era on the SAAO 1.0 m telescope. The first observations were conducted in white light on the night of the 11th of July 2016, with subsequent observations conducted again on the 24th to 27th of November 2016 in thegandiband filters respectively. Observing conditions were affected by some scattered high cloud during the beginning of the night on the 11th of July which may have affected the white light observations.
The data were reduced using the standard procedure with sky flats and bias frames taken during the observing run. We used thestarlink packageautophotom to per-form the photometry of the target and comparison stars. The aperture was fixed for the data and was set to be two times the mean seeing (full width at half-maximum;Naylor (1998)). This aperture size limited the impact of the back-ground noise in the aperture. The sky backback-ground level was determined using the clipped mean of the pixel value in an annulus around the stars and the measurement errors were estimated from the sky variance. To remove atmospheric fluctuations, the light curve was divided by the light curve of one of the comparison stars.
The g and i band lightcurves in Figure 2, folded on the 68.21 minute period, show no eclipses, which would have been detected with the cadence of the observations. If present, these should have been identified within the K2 data, however, there is a chance that the long cadence of the data means a short eclipse was missed. The lightcurves have been fitted with a sine curve, and have slightly different T0, indicative of a phase shift between the two bands,
sim-ilar to that seen in WD0137-349 byCasewell et al.(2015). The difference is only 2.1 minutes, however, this is slightly less than twice the maximum error derived for the T0. The
[image:3.595.78.244.124.276.2]dis-Table 2.Observations taken at the SAAO of EPIC212235321. The T0determined in each waveband is also given. Theiband data were
combined to calculate one value for the waveband.
Date filter Exp time (s) Total time (hours) T0(HJD)
20160711 white light 5 4.92 2457581.60276±0.00013 20161124 i 60 0.85
-20161125 i 30 1.36
-20161126 g 30 2.01 2457581.60225±0.00085 20161127 i 30 1.64 2457581.60371±0.00032
Figure 2. g (blue) and i (red) band lightcurves for
EPIC21223535321. The semi-amplitudes were 0.028±0.003 mags in the g band and 0.170±0.008 in thei band. The photometry has been binned into 25 equal bins. The lightcurves have been duplicated over two periods for display purposes.
crepancy of ≈52s between the i band and K2 T0 derived
from theiband filter when compared to the K2 pass band, however this is is within a 1 sigma error in the period over the∼12,000 cycles between the two T0 values.
4 ISIS SPECTROSCOPY
To confirm the nature of the primary star, we observed EPIC212235321 on the night of 20150909 with ISIS on the William Herschel Telescope on La Palma. We used the 1” slit with the R600B grating in the blue arm and the GG495 filter with the R600R grating in the red arm. We took four exposures of 900 s, at airmass of∼1.5 and seeing between 0.8” and 1.5”. We also observed arc lamps and flux stan-dards to calibrate the data. The data were reduced using irafroutines for long slit spectroscopy as in Dobbie et al. (2006).
The spectra confirm that the target is indeed a white dwarf. We determined the effective temperature (Teff) and
surface gravity (log g) of the white dwarf, from the Balmer absorption lines (omitting Hαand Hβas they are affected by emission features) by comparing to the predictions of white dwarf model atmospheres using the spectral fitting program FITSB2 (v2.24;Napiwotzki et al. 2004).
We generated pure hydrogen DA models with mixing length ML2/α=0.8 (Koester 2010) and Balmer/Lyman lines calculated with the modified Stark broadening profiles of Tremblay et al.(2009). We then generated a model grid from 6000 to 80000 K in 1000 K steps with log g ranging from
0.4 0.6 0.8 1 1.2 1.4 1.6 1.8 2
-40 -20 0 20 40
H10
H9
H8
H ε
H δ
H γ
Relative flux
[image:4.595.45.295.129.368.2]δ wavelength (Angstroms)
Figure 3.ISIS spectrum of EPIC212235321 with the best fitting model Teff = 24490±150 K, log g = 7.63±0.02 overplotted. Hα
and Hβhave been omitted as they are the most affected by the emission features.
6.5 to 9.5 in 0.25 dex steps. We used FITSB2 to fit our grid of model spectra to the six Balmer absorption lines ranging from Hδ to H10 in each exposure. In addition, points in the observed data lying more than 3σfrom the model were clipped from subsequent iterations of the fitting process. The best fit values were Teff = 24490±150 K, log g = 7.63±0.02 (Table3, Figure3).
5 SOAR SPECTRA
[image:4.595.364.507.247.493.2]tra.
The SOAR spectra were normalised to 1 and phase-binned on the ephemeris using Tom Marsh’smolly1 soft-ware. There is clearly an emission feature in the centre of the Hα line that moves in antiphase with the Hα absorp-tion features from the white dwarf. To model these ab-sorption and emission features we used the technique in Parsons et al.(2017), using three Gaussian profiles to model the absorption from the white dwarf that change position according toγ1+K1sin(2πφ), where φ is the orbital phase,
and two Gaussian components to model the Hα emission from the companion star that change position according to γem+Kemsin(2πφ), and vary in strength according to
(1−cosφ)/2. We also allowed an offset to be fit to take into account the error on the period. The errors on the radial velocity parameters were determined as in Casewell et al. (2015), with 1 kms−1added in quadrature in order to achieve
a reduced chi-squared with χν2 ∼1. The final velocities were K1=42±4 km s−1 and Kem=305±7 km s−1 with γ1=30±2
km s−1andγ
em=-4±6 km s−1. There is a notable difference
in the gamma velocities indicative of the low resolution of the spectrograph and suggesting there are systematic errors that have not been accounted for.
6 XSHOOTER SPECTRA
We also observed EPIC212235321 with the medium resolu-tion echelle spectrograph XSHOOTER (Vernet et al. 2011), mounted on VLT-UT2 at Paranal, Chile. X-shooter covers the spectral range from the atmospheric cut-off in the UV to the near-infrared K band in three separate arms, known as the UVB (0.30 – 0.56 microns), VIS (0.56 – 1.01 mi-crons) and NIR (1.01 – 2.40 mimi-crons). We observed with XSHOOTER on the VLT on the night of 31 August 2017 and obtained 10 spectra in the UVB and VIS arms with exposure times of 330s each. The data were taken in stare mode, and so the NIR arm data is dominated by the sky background and is not used. The data were reduced using the standard pipeline release of the XSHOOTER Common Pipeline Library (CPL) recipes (version 2.6.8) within ES-ORex, the ESO Recipe Execution Tool. The accuracy of the wavelength calibration of XSHOOTER data from the pipeline reduction is 0.03 nm in the UVB and 0.02 nm in the VIS arm, corresponding to a velocity precision of∼10 km s−1
at Hα. The data were analysed in the same manner as the SOAR data, although the data were of better quality, and so four Gaussians were used, two for the emission and two for the absorption. The fit parameters can be seen in Table 3. The XSHOOTER data have a resolution R∼7500, higher than the R∼5000 for the SOAR data, hence the errors are much smaller. These are the parameters that are therefore used within the rest of this paper. We tested the discrep-ancy between the γ values in the XSHOOTER and SOAR data by fixing them to the XSHOOTER values and refitting the SOAR data. The fits then agree to within 1 per cent, indicating our assumption about the underestimated errors on the SOAR data was correct.
1 http://deneb.astro.warwick.ac.uk/phsaap/software/
molly/html/INDEX.html
6540 6560 6580 Wavelength (Å) 1 2 3 4 5 6 7 8 9 Sp ec tr um n um be r
6540 6560 6580 Wavelength (Å) 1 2 3 4 5 6 7 8 9
[image:5.595.309.540.104.282.2]6540 6560 6580 Wavelength (Å) 1 2 3 4 5 6 7 8 9
Figure 4.Trailed XSHOOTER spectra showing Hα (left), the model fit (centre) and the residuals (right).
Table 3. Derived system parameters, where 1 refers to the white dwarf and em the emission from the brown dwarf.
Property Value Units K2 P 0.047369569±0.000000056 days K2 T0 2457011.653656±0.000013 HJD
Teff1 24490±194 K
log g1 7.63±0.02
-K1 41±2 kms−1
γ1 47.5±1.6 kms−1
R1 0.017±0.005 R⊙
Kem 308±5 kms−1
γem 35±5 kms−1
Rem 0.0973 R⊙
a 0.44 R⊙
The XSHOOTER spectra show evidence of the Ca ii triplet at 8498.02 8542.09 8662.14 ˚A and Mgi at 8806.76 ˚
A in emission within our spectra. We did not detect any Nai in emission, but we do detect interstellar Na iin ab-sorption at 5889.95 and 5895.92 ˚A. We also do not detect Fei, Feii, Tiior Kiin emission, as are seen in WD0137-349B (Longstaff et al. 2017). There are also no Mg ii or Caiiabsorption features which could be attributed to accre-tion from a dust disk as are seen in SDSS1557 (Farihi et al. 2017). SDSS1557 has a similar effective temperature to EPIC212235321, however it only shows Balmer line emis-sion features from the brown dwarf, and not emisemis-sion from other atoms within the brown dwarf atmosphere.
7 DISCUSSION
The log g and Teff of the white dwarf mean that it falls in
[image:5.595.330.519.377.507.2]the uncertainties due to Teffand log g are much smaller than
the difference in mass determined between the grids. As both sets of models give consistent results we take the mass of the white dwarf to be 0.47 ±0.01 M⊙. The radius determined from theFontaine et al.(2001) models is 0.017±0.005 R⊙.
The difference in the γvelocities is 13±6 km s−1. This
value is consistent with the gravitational redshift of the white dwarf calculated using the mass and radius which is 16.4±0.5 km s−1, serving as an independent check.
The mass ratio of the binary taken from theKvelocities is q = M2/M1 = 0.135. Assuming a white dwarf mass of
0.47 M⊙gives a companion mass of 0.063 M⊙, or 66.4 MJup.
However,Kem only represents the emission from the heated
hemisphere of the brown dwarf, not the true centre of mass velocity of the secondary but a lower limit, and hence an upper limit on the mass determination. This means that the secondary is definitely a brown dwarf (M < 70 MJup)
and that a correction must be applied to get the true centre of mass velocity. We used the formula from Parsons et al. (2012) with f=0.5 corresponding to optically thick emission as Hα emission from similar systems has been found to be optically thick (e.g.Parsons et al. 2017,Parsons et al. 2012). Since EPIC212235321 is not an eclipsing system we have no direct measurement of the radius of the brown dwarf, needed to calculate this correction. We can however, estimate the radius using the knowledge that the system is not interacting via Roche lobe overflow.
We used the Roche lobe calculations in Breedt et al. (2012), and white dwarf mass and orbital separation, to calculate the Roche lobe for a range of secondary masses. We then compared these predictions on the size of the Roche lobe with the upper limit on the mass determi-nation 66.4 MJup, and radii predicted by the BT-Cond
models (Allard et al. 2012). The size of the Roche lobe is 0.0988±0.007 R⊙, and as there are no signs of accretion within this system, this is the maximum size possible for the secondary . Using this brown dwarf radius allows us to deter-mine that the inclination of the system is likely to be greater than 48 degrees, which when combined with the K correc-tion, gives a mass range for the secondary of47 <M2 <65
MJup. If we assume the emission feature is due to uniform
emission from the heated hemisphere of the brown dwarf, then the inclination of the system is 56 degrees, and the brown dwarf mass is 58 MJup. In the following discussions, this is taken to be the mass of the brown dwarf. Figure5is a diagram of the system showing both binary constituents and their Roche lobes.
The BT-COND evolutionary models of brown dwarfs indicate that in order for the brown dwarf to not fill its Roche lobe at this orbital period, it must be older than 700 Myr with a radius of 0.0973 R⊙. Such a brown dwarf has Teff∼2000 K, which gives an estimated spectral type of early L, around L3 (Golimowski et al. 2004). If the brown dwarf is older, the effective temperature is likely to be cooler. The cooling age of the white dwarf was estimated using the white dwarf models, resulting in 18±1 Myr from the C/O core models and 14±8 Myr from the He core models. Clearly, while the white dwarf is relatively newly formed, the system itself is much older.
[image:6.595.324.555.140.387.2]While we cannot use an initial-final mass relationship for white dwarfs (e.g.Casewell et al. 2009) to determine the mass of the white dwarf progenitor, it is possible to use
Figure 5. Diagram showing the Roche lobes of the white dwarf (left) and brown dwarf (right) in the system for a case with uniform emission (K2=346 kms−1), and mass ratio of 0.12.. The brown dwarf radius is 0.0973 R⊙ and
the orbital separation is 0.44 R⊙. The white dwarf is not
shown to scale.
main sequence models to determine the maximum progeni-tor mass. We have ignored the cooling time and the time for the common envelope phase as they are so short in comparison to the lifetime of the system (seeParsons et al. 2017for a more detailed description of the common enve-lope phase), and have assumed that the total system age is equal to the main sequence lifetime. The Marigo et al. (2017) PARSEC-COLIBRI models predict that at 700 Myr, the minimum age permitted, the maximum progenitor mass is 2.60 M⊙, at 4 Gyr, the maximum progenitor mass is 1.35 M⊙, while if the system is older, say 10 Gyr, this drops to 1.04 M⊙. The initial-final mass relation for white dwarfs (e.g.Casewell et al. 2009) predicts that a 1 M⊙star should produce a white dwarf with mass near to the average white dwarf mass of∼0.6 M⊙, indicating that the evolution of the white dwarf progenitor has been truncated by the common envelope phase.
The period of this system is very short, ∼ 3 minutes shorter than that of the two newly discovered K2 systems presented in Parsons et al. (2017), and the masses of the components are very similar. The evolution of these systems was also discussed in depth inRappaport et al.(2017), and so for further discussion of how these systems will evolve into a CV, we refer to these two papers.
were able to independently investigate the possible spectral type of the secondary by using SED fitting. EPIC212235321 is in both the VST ATLAS DR3 (Shanks et al. 2015) and VISTA VHS DR4 catalogues providing ugrizY J H Ks
photometry. The VISTA Data Flow System pipeline pro-cessing and science archive are described in Irwin et al. (2004), Hambly et al. (2008) and Cross et al. (2012). We converted the VST ATLAS AB magnitudes, the VISTA Hemisphere Survey Vega magnitudes, and the Galex AB magnitudes shown in Table 1 into flux in mJy using the relevant zeropoints. We also adjusted the Galex magni-tudes using the non-linearity transformations presented in Camarota & Holberg (2014). These fluxes were then com-pared to a white dwarf model of the primary star, as well as combined white dwarf-brown dwarf/M dwarf templates of spectral type M8 (VB10;Burgasser et al. 2004), L0 (2MASP J0345432+254023; Burgasser & McElwain 2006) and L3 (2MASSW J1146345+223053; Burgasser et al. 2010). Fig-ure 6 shows that there is clearly an excess in the near-IR wavelengths. However, the excess is indicative of spectral type earlier than M8 in theY and J bands, and allows as late a spectral type of L3 in theKsbands. At the estimated
age of the brown dwarf, the masses indicate the effective temperatures should be ∼ 2000 K depending on the mass of the secondary and the age. This effective temperature is consistent with a spectral type of L3 (Golimowski et al. 2004).
We used theJura(2003) disk model to determine if it is possible some of the excess seen is due to a circumbinary dust disk as for J155720.77+091624.6 (Farihi et al. 2017). We used the parameters given inDebes et al.(2011) for the outer an inner disk radius. These parameters, when com-bined with the white dwarf parameters give an outer disk temperature of 600 K, and an inner temperature of ∼1500 K, close to the sublimation temperature. Such a disk how-ever, only begins to make a noticeable contribution within the SED of the combined system in theKsband - the flux is
negligible inY J. When we combine this with the fact that we see no pollution in the XSHOOTER spectrum indicative of the white dwarf being a DAZ, we can discount the presence of a dust disk in the system.
It is possible that the majority of the ”excess” seen is due to a large reflection effect. The VISTA data were taken at phases 0.46 inY, 0.55 in Jand 0.65 inKs, meaning that
theY photometry was observed as the hot side of the brown dwarf comes into view, and the J band was observed just past the peak emission from the brown dwarf at phase 0.5. In order for the excess seen to be due to the reflection effect in the system, we would have to have variations with semi-amplitudes of ∼0.25-0.3 mags in the Y and J bands. For comparison, the lightcurve of WD0137-349AB, varies by∼ 15 per cent in theKsband. EPIC212235321 shows this level
of variability in theiband, due to its much shorter period, and hotter white dwarf. Thus we expect large variability at longer wavelengths (e.g. in the mid-IR) from this system. Indeed, JWST will provide an excellent suite of instruments with which to study these shorter period, highly irradiated brown dwarfs in more detail.
0.1 1
0.5 1 1.5 2 2.5
[image:7.595.319.533.116.271.2]Flux (mJy) Wavelength (microns) WD WD+M8 WD+L0 WD+L3
Figure 6.Photometry of EPIC212235321 fromGalex, VST AT-LAS and the VISTA VHS, with a Teff= 24490±150 K, log g =
7.63±0.02 white dwarf model, and template M and brown dwarf spectra. The 3σerror bars are shown.
8 CONCLUSIONS
We have discovered EPIC212235321, the first sub-70 minute non-interacting WD+BD binary known. The lightcurves of this system show a significant reflection effect, which is sup-ported by a large near-IR excess when the VISTA magni-tudes are compared to a model white dwarf atmosphere com-bined with brown dwarf spectra. There are emission features seen from the hydrogen balmer lines as well as Ca II and Mg I, similar to the emission features seen in WD0137-349B (Longstaff et al. 2017). The radial velocity measurements of the system suggest that the mass of the white dwarf is 0.47 ±0.01 M⊙, and the mass of the brown dwarf companion is 58 MJup, consistent with a Teff=2000 K and a spectral type of L3. This system, along with SDSS J1205-0242, and SDSS J1231+0041 (Parsons et al. 2017) are the shortest pe-riod detached post-common envelope binaries containing a white dwarf and a brown dwarf known. All three have peri-ods shorter than those of some CVs that are actively accret-ing (e.g.Hern´andez Santisteban et al. 2016b;Burleigh et al. 2006b). These three systems also have low mass white dwarf primaries suggesting common envelope evolution has trun-cated the lifetime of the red giant star that was the white dwarf progenitor.
9 ACKNOWLEDGEMENTS
Allard F., Homeier D., Freytag B., 2012,Philosophical Transactions of the Royal Society of London Series A,370, 2765
Anderson D. R., et al., 2011,ApJ,726, L19
Beuermann K., et al., 2013,A&A,558, A96
Breedt E., G¨ansicke B. T., Girven J., Drake A. J., Copperwheat C. M., Parsons S. G., Marsh T. R., 2012,MNRAS,423, 1437
Burgasser A. J., McElwain M. W., 2006,AJ,131, 1007
Burgasser A. J., McElwain M. W., Kirkpatrick J. D., Cruz K. L., Tinney C. G., Reid I. N., 2004,AJ,127, 2856
Burgasser A. J., Cruz K. L., Cushing M., Gelino C. R., Looper D. L., Faherty J. K., Kirkpatrick J. D., Reid I. N., 2010,ApJ,710, 1142
Burleigh M. R., Hogan E., Dobbie P. D., Napiwotzki R., Maxted P. F. L., 2006a,MNRAS,373, L55
Burleigh M. R., et al., 2006b,MNRAS,373, 1416
Burleigh M. R., et al., 2011, in Schuh S., Drechsel H., Heber U., eds, American Institute of Physics Conference Series Vol. 1331, American Institute of Physics Conference Series. pp 262–270 (arXiv:1102.0505),doi:10.1063/1.3556209
Camarota L., Holberg J. B., 2014,MNRAS,438, 3111
Casewell S. L., Dobbie P. D., Napiwotzki R., Burleigh M. R., Barstow M. A., Jameson R. F., 2009,MNRAS,395, 1795
Casewell S. L., et al., 2012,ApJ,759, L34
Casewell S. L., et al., 2015,MNRAS,447, 3218
Clemens J. C., Crain J. A., Anderson R., 2004, in Moorwood A. F. M., Iye M., eds, Proc. SPIEVol. 5492, Ground-based Instrumentation for Astronomy. pp 331–340,doi:10.1117/12.550069
Coppejans R., et al., 2013,PASP,125, 976
Cross N. J. G., et al., 2012,A&A,548, A119
Cumming A., Marcy G. W., Butler R. P., 1999, The Astrophysical Journal, 526, 890 Debes J. H., Hoard D. W., Wachter S., Leisawitz D. T., Cohen M., 2011,ApJS,197, 38
Dobbie P. D., Burleigh M. R., Levan A. J., Barstow M. A., Napiwotzki R., Hubeny I., 2005,A&A,439, 1159
Dobbie P. D., et al., 2006,MNRAS,369, 383
Farihi J., Christopher M., 2004,AJ,128, 1868
Farihi J., Parsons S. G., G¨ansicke B. T., 2017,Nature Astronomy,1, 0032
Fontaine G., Brassard P., Bergeron P., 2001,PASP,113, 409
Girven J., G¨ansicke B. T., Steeghs D., Koester D., 2011,MNRAS,417, 1210
Golimowski D. A., et al., 2004,AJ,127, 3516
Grether D., Lineweaver C. H., 2006,ApJ,640, 1051
Hambly N., et al., 2001a,Monthly Notices of the Royal Astronomical Society, 326, 1279
Hambly N., Irwin M., MacGillivray H., 2001b,Monthly Notices of the Royal Astronomical Society, 326, 1295
Hambly N., Davenhall A., Irwin M., MacGillivray H., 2001c,Monthly Notices of the Royal Astronomical Society, 326, 1315 Hambly N. C., et al., 2008,MNRAS,384, 637
Hartman J. D., Bakos G. ´A., 2016,Astronomy and Computing,17, 1
Hern´andez Santisteban J. V., et al., 2016a,Nature,533, 366
Hern´andez Santisteban J. V., et al., 2016b,Nature,533, 366
Howell S. B., et al., 2014,PASP,126, 398
Irwin M. J., et al., 2004, in Quinn P. J., Bridger A., eds, Proc. SPIEVol. 5493, Optimizing Scientific Return for Astronomy through Information Technologies. pp 411–422,doi:10.1117/12.551449
Jura M., 2003,ApJ,584, L91
Koester D., 2010, Mem. Soc. Astron. Italiana,81, 921
Lawrie K. A., Burleigh M. R., Dufour P., Hodgkin S. T., 2013a,MNRAS,433, 1599
Lawrie K. A., Burleigh M. R., Goad M., 2013b, EThOS,2381, 28179
Lenz P., Breger M., 2005,Communications in Asteroseismology,146, 53
Littlefair S. P., et al., 2014,MNRAS,445, 2106
Lomb N. R., 1976,Ap&SS,39, 447
Longstaff E. S., Casewell S. L., Wynn G. A., Maxted P. F. L., Helling C., 2017,MNRAS,471, 1728
Marigo P., et al., 2017,ApJ,835, 77
Markwardt C. B., 2009, in Bohlender D. A., Durand D., Dowler P., eds, Astronomical Society of the Pacific Conference Series Vol. 411, Astronomical Data Analysis Software and Systems XVIII. p. 251 (arXiv:0902.2850)
Maxted P. F. L., Napiwotzki R., Dobbie P. D., Burleigh M. R., 2006,Nature,442, 543
Metchev S. A., Hillenbrand L. A., 2004,ApJ,617, 1330
Napiwotzki R., et al., 2004, in Hilditch R. W., Hensberge H., Pavlovski K., eds, Astronomical Society of the Pacific Conference Series Vol. 318, Spectroscopically and Spatially Resolving the Components of the Close Binary Stars. pp 402–410 (arXiv:astro-ph/0403595) Naylor T., 1998,MNRAS,296, 339
Panei J. A., Althaus L. G., Benvenuto O. G., 2000, A&A,353, 970
Panei J. A., Althaus L. G., Chen X., Han Z., 2007,MNRAS,382, 779
Parsons S. G., et al., 2012,MNRAS,420, 3281
Parsons S. G., et al., 2017,MNRAS,471, 976
Pollacco D. L., et al., 2006,PASP,118, 1407
Rappaport S., et al., 2017,MNRAS,471, 948
Scargle J. D., 1982,ApJ,263, 835
Shanks T., et al., 2015,MNRAS,451, 4238
Steele P. R., Burleigh M. R., Dobbie P. D., Jameson R. F., Barstow M. A., Satterthwaite R. P., 2011,MNRAS,416, 2768
Steele P. R., et al., 2013,MNRAS,429, 3492
Van Cleve J. E., et al., 2016,PASP,128, 075002