University of Southern Queensland
Faculty of Health, Engineering and Sciences
CROSS-LAYER OPTIMISATION OF
QUALITY OF EXPERIENCE FOR VIDEO
TRAFFIC
A thesis submitted by
Qahhar Muhammad Qadir
B.Sc. (Eng.) & M.Sc. (Eng.)
in fulfilment of the requirements for the degree of
Doctor of Philosophy
by
Qahhar Muhammad Qadir
Abstract
Realtime video traffic is currently the dominant network traffic and is set to increase in volume for the foreseeable future. As this traffic is bursty, providing perceptually good video quality is a challenging task. Bursty traffic refers to inconsistency of the video traffic level. It is at high level sometimes while is at low level at some other times. Many video traffic measurement algorithms have been proposed for measurement-based admission control. Despite all of this effort, there is no entirely satisfactory admission algorithm for variable rate flows. Furthermore, video frames are subjected to loss and delay which cause quality degradation when sent without reacting to network congestion. The perceived Quality of Experience (QoE)-number of sessions trade-off can be optimised by exploiting the bursty nature of video traffic.
This study introduces a cross-layer QoE-aware optimisation architecture for video traffic. QoE is a measure of the user’s perception of the quality of a network ser-vice. The architecture addresses the problem of QoE degradation in a bottleneck network. It proposes that video sources at the application layer adapt their rate to the network environment by dynamically controlling their transmitted bit rate. Whereas the edge of the network protects the quality of active video sessions by controlling the acceptance of new sessions through a QoE-aware admission con-trol. In particular, it seeks the most efficient way of accepting new video sessions and adapts sending rates to free up resources for more sessions whilst maintaining the QoE of the current sessions.
rate adaptation enhances the video quality, accepting more sessions than a link can accommodate will degrade the QoE.
The video’s instantaneous aggregate rate was compared to the average aggregate rate which is a calculated rate over a measurement time window. It was found that there is no substantial difference between the two rates except for a small number of video flows, long measurement window, or fast moving contents (such as sport), in which the average is smaller than the instantaneous rate. These scenarios do not always represent the reality.
The finding discussed above was the main motivation for proposing a novel video traffic measurement algorithm that is QoE-aware. The algorithm finds the upper limit of the video total rate that can exceed a specific link capacity without the QoE degradation of ongoing video sessions. When implemented in a QoE-aware admission control, the algorithm managed to maintain the QoE for a higher number of video session compared to the calculated rate-based admission controls such as the Internet Engineering Task Force (IETF) standard Pre-Congestion Notification (PCN)-based admission control. Subjective tests were conducted to involve human subjects in rating of the quality of videos delivered with the proposed measurement algorithm.
Mechanisms proposed for optimising the QoE of video traffic were surveyed in detail in this dissertation and the challenges of achieving this objective were dis-cussed. Finally, the current rate adaptation capability of video applications was combined with the proposed QoE-aware admission control in a QoE-aware cross-layer architecture. The performance of the proposed architecture was evaluated against the architecture in which video applications perform rate adaptation with-out being managed by the admission control component. The results showed that our architecture optimises the mean Mean Opinion Score (MOS) and number of successful decoded video sessions without compromising the delay.
iii
at the university. Data obtained from the simulations was analysed with analysis of variance (ANOVA) and the Cumulative Distribution Functions (CDF) for the performance metrics were calculated.
my lovely mother,
my deceased father, who had wished to see this work, my beloved wife and my children,
Certification of Dissertation
I certify that the ideas, designs and experimental work, results, analyses and conclusions set out in this dissertation are entirely my own effort, except where otherwise indicated and acknowledged.
I further certify that the work is original and has not been previously submitted for assessment in any other course or institution, except where specifically stated.
Qahhar Muhammad Qadir
0061022180
/ /2016
Signature of Candidate Date
ENDORSEMENT
/ /2016 Dr. Alexander A. Kist, Principal supervisor Date
Acknowledgments
First and foremost, I praise almighty Allah for granting me the blessing, health, patience, and knowledge to accomplish this work. My special thanks to my principal supervisor Associate Professor Alexander A. Kist who has been my mentor and support throughout the period of my candidature. His constructive and critical comments made a real difference. I would also like to express my appreciation to my associate supervisor Dr. Zhongwei Zhang for his comments and suggestions. Without Alex and Zhongwei supervision and constant support, this dissertation would have not been possible.
A special thank-you to my family for their prayers and cheerfulness at all the times. They provided me with the hassle free environment necessary for the achievement of my goal. Words cannot express how grateful I am to each of you, I owe you all.
I should have not forget volunteers who participated in the subject tests and spent hours in front of the computer screen. Last but not least, thanks to Prof. Yury Stepanyants, Dr. Saddam Al-Lwayzy, Dr. Iain Brookshaw, Prof. Shah-jahan Khan and Ms. Sandra Cochrane who assisted me in one way or another throughout this work.
Qahhar Muhammad Qadir
University of Southern Queensland
Publications
The research that is reported in this thesis has led to the following publications:
Peer reviewed journal publications
Qadir M., Q., Kist, A. A. and Zhang Z., “A QoE-Aware Cross-Layer Architecture for Video Streaming Services”, under revision.
Qadir M., Q., Kist, A. A. and Zhang Z., “A Novel Traffic Rate Measurement Algorithm for QoE-Aware Video Admission Control”,IEEE Transaction on Mul-timedia, Vol. 17, No. 5, pp. 711-722, May 2015.
Qadir M., Q., Kist, A. A. and Zhang Z., “The probability relationship between videos instantaneous and average aggregate rates”, Multimedia Tools and Appli-cations, Vol. 74, No. 9, pp 1-16, May 2015.
Peer reviewed conference publications
Qadir M., Q., Kist, A. A. and Zhang Z., “Optimization of Quality of Experi-ence for Video Traffic”, 22nd International Conference on Telecommunications, Sydney, Australia, April 2015
Qadir, S.1, Kist, A. A. and Zhang Z., “QoE-Aware Cross-Layer Architecture for
Video Traffic over Internet”, IEEE TENSYMP, Kuala Lumpur, Malaysia, April 2014.
Qadir, S.1 and Kist, A. A., “Video-Aware Measurement-Based Admission
con-trol”, IEEE ATNAC Conference, Christchurch, New Zealand, November 2013.
Qadir, S.1and Kist, A. A., “Quality of Experience Enhancement Through
Adapt-ing Sender Bit rate”, IEEE TENCON Spring Conference, Sydney, Australia, April 2013.
1The author has changed his name from “Safeen Qadir” to “Qahhar Muhammad Qadir”.This
Contents
Abstract i
Acknowledgments vi
Publications vii
List of Figures xiii
List of Tables xviii
Definitions xx
Notations xxi
Acronyms xxiii
Chapter 1 Introduction 1
1.1 Problem Statement . . . 3
1.2 Scope of the Thesis . . . 5
1.4 Main Contributions . . . 8
1.5 Dissertation Outline . . . 9
Chapter 2 QoE of Video Streaming Services 11 2.1 Factors Affecting QoE . . . 12
2.2 Video Quality Assessment . . . 14
2.3 Quality Metrics . . . 17
2.4 QoE Prediction Models . . . 20
2.5 Methodology for Subjective Quality Assessment . . . 21
2.6 Summary . . . 22
Chapter 3 QoE Enhancement through Adapting Sender Bit Rate 23 3.1 Related Work . . . 24
3.2 Video Quality Model . . . 27
3.3 Evaluation Environment . . . 28
3.4 Results and Discussions . . . 31
3.5 Summary . . . 35
Chapter 4 Instantaneous versus Calculated Video Rates 39 4.1 Proposed Model for Probability Estimation . . . 40
4.2 Evaluation Environment . . . 42
CONTENTS xi
4.3.1 Impact of Number of Flows on δ. . . 44
4.3.2 Impact of Video Content on δ . . . 48
4.3.3 Impact and Setting of Measurement Time Window (kτ) on δ 49 4.4 Summary . . . 52
Chapter 5 Protecting QoE through a QoE-Aware Measurement Algorithm 53 5.1 Related Work . . . 55
5.2 Assumptions . . . 60
5.3 Proposed Models . . . 61
5.3.1 Proposed Model for Measurement Algorithm . . . 61
5.3.2 Proposed Model forβ . . . 64
5.4 Evaluation Environment . . . 69
5.5 Results and Discussions . . . 71
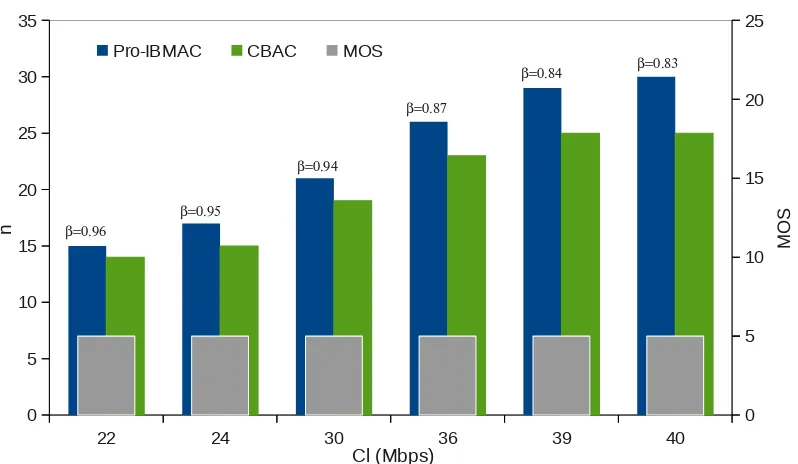
5.5.1 Pro-IBMAC vs CBAC . . . 71
5.5.2 Impact of β onPro-IBMAC . . . 74
5.6 Subjective Tests . . . 78
5.7 Validation of the Proposed Models . . . 80
5.8 Summary . . . 82
6.1 QoE Optimisation Challenges and Motivation . . . 86
6.2 A Survey on QoE Optimisation for Video Traffic . . . 88
6.2.1 QoE Optimisation through Cross-Layer Designs . . . 89
6.2.2 QoE Optimisation through Scheduling . . . 100
6.2.3 QoE Optimisation through Content and Resource Manage-ment . . . 103
6.3 QoE-Aware Cross-Layer Architecture . . . 105
6.4 Evaluation Environment . . . 110
6.5 Performance Evaluation of the Architecture . . . 111
6.5.1 Cross-layer architecture vs Adaptive architecture . . . 112
6.5.2 Comparison between cross-layer architecture, adaptive ar-chitecture and non-adaptive architecture . . . 121
6.6 Summary . . . 123
Chapter 7 Conclusions and Further Work 125 7.1 Summary of Contribution . . . 125
7.2 Conclusions . . . 127
7.3 Further Work . . . 128
Bibliography 131
List of Figures
1.1 Mobile video Multiplies other traffic. Adopted from (Cisco documentation 2014b) . . . 2
1.2 Topology scenario considered in the thesis . . . 6
1.3 Schematic diagram of the chapters of dissertation . . . 10
2.1 QoE technical and non-technical parameters. Adopted from (Brooks & Hestnes 2010) . . . 13
2.2 Taxonomy of objective quality assessment methods. Adopted from (Takahashi et al. 2008) . . . 16
3.1 A snapshot of the video sequences used in Chapter 3 and Chapter 6, MAD (left) and Grandma (right) . . . 28
3.2 Network topology used in the simulations in Chapter 3 and Chap-ter 6 . . . 29
3.3 Relationship of MOS with the instantaneous arrival rate . . . 32
3.4 CDF of the mean MOS of the video flows in the adaptive architec-tureandnon-adaptive architecture for MAD and Grandma sequences 33
3.5 CDF of the mean number of sessions in the adaptive architecture
3.6 Mean MOS of the video flows and mean number of sessions in the
adaptive architecture and non-adaptive architecture for MAD and Grandma sequences . . . 35
3.7 CDF of the mean delay of the video flows in theadaptive architec-ture andnon-adaptive architecturefor MAD and Grandma sequences 36
3.8 CDF of the mean jitter of the video flows in the adaptive architec-ture andnon-adaptive architecturefor MAD and Grandma sequences 37
4.1 A snapshot of the test video sequences from left to right: Tokyo Olympiad (74-minutes), Silence of the lambs (30-minutes), Star wars IV (30-minutes), Sony demo (10-minutes) and NBC news (30-minutes) . . . 42
4.2 Mean and confidence interval of the probability relationship be-tween the instantaneous and average aggregate rates for different
number of flows . . . 45
4.3 CDF of the probability relationship between the instantaneous and average aggregate rates for different number of flows . . . 46
4.4 Mean and confidence interval of the instantaneous and average aggregate rates for 5 flows over time periods . . . 47
4.5 Mean and confidence interval of the instantaneous and average aggregate rates for 100 flows over time periods . . . 48
4.6 Mean and confidence interval of the probability relationship be-tween the instantaneous and average aggregate rates for news and sport . . . 49
LIST OF FIGURES xv
4.8 Mean and confidence interval of the probability relationship be-tween the instantaneous and average aggregate rates of 40 flows
for different measurement windows . . . 51
4.9 CDF of the probability relationship between the instantaneous and average aggregate rates for different measurement windows - 40 flows 52 5.1 The admissible and supportable rate AR(l), SR(l) defines three types of pre-congestion. Adopted from (Menth et al. 2010) . . . . 58
5.2 Snapshots of the video sequences used in Chapter 5, MAD (left) and Paris (right) . . . 65
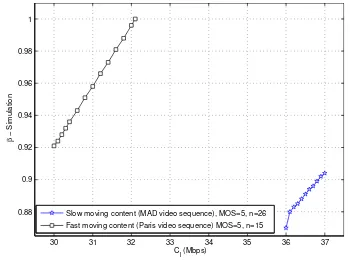
5.3 β - Link capacity relationship . . . 66
5.4 β -Number of sessions relationship . . . 67
5.5 β - QoE relationship . . . 68
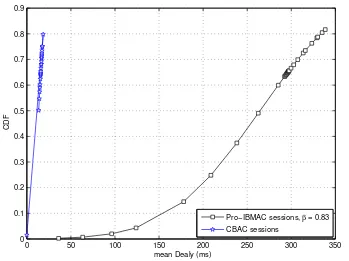
5.6 MOS of theCBAC and Pro-IBMAC admitted sessions . . . 72
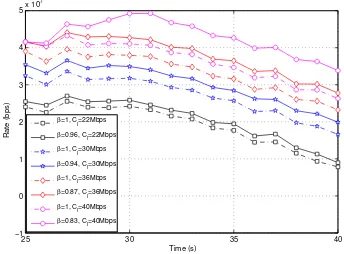
5.7 CDF of the mean delay of theCBAC and Pro-IBMAC sessions . 73 5.8 IAAR and upper limit of the exceedable rate for different link capacities over time period . . . 74
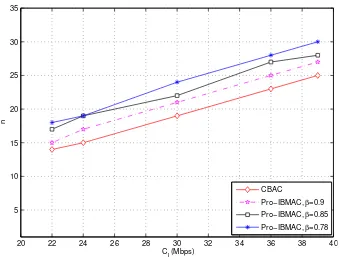
5.9 Admitted sessions of CBAC and Pro-IBMAC for different link capacities . . . 75
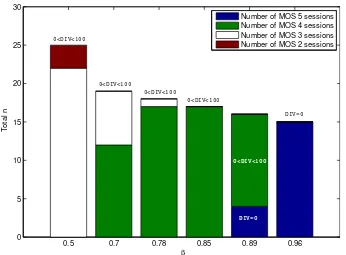
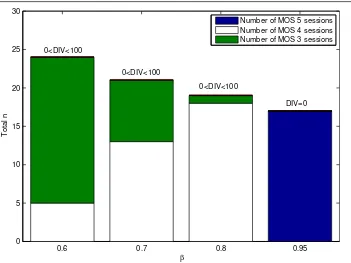
5.10 Impact of β on MOS andn, Cl=22Mbps . . . 76
5.11 Impact of β on MOS andn, Cl=24Mbps . . . 77
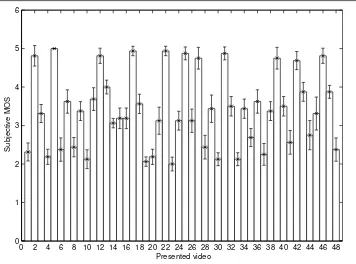
5.12 Bar chart of subjective MOS with confidence interval for individual video . . . 79
5.14 Validation of thesimulated MOS with subjective MOS . . . 81
5.15 Validation of the proposed model ofβ with simulation results . . 82
6.1 An automatic architecture to enable the QoE maximisation of mul-timedia services (Latr´e et al. 2009) . . . 93
6.2 A cross-layer adaptation architecture for HAS-specific QoE opti-misation (Oyman & Singh 2012) . . . 94
6.3 A possible end to end QoE assurance system (Zhang & Ansari 2011) 95
6.4 Joint framework for multilayer video optimisation (Fu et al. 2013) 96
6.5 Overview of system components and their relationships (Mathieu et al. 2011) . . . 99
6.6 Modification of the PCN-based admission control system toward the optimisation of video services in access network (Latr´e, Klaas, Wauters & DeTurck 2011) . . . 104
6.7 QoE-aware cross-layer architecture for video traffic . . . 107
6.8 CDF of the mean MOS of the video flows in thecross-layer archi-tecture and adaptive architecture for MAD and Grandma sequences 112
6.9 CDF of the meannumber of sessions in thecross-layer architecture
and adaptive architecture for MAD and Grandma sequences . . . 113
6.10 Mean MOS of the video flows and meannumber of sessions in the
cross-layer architecture and adaptive architecture for MAD and Grandma sequences . . . 114
LIST OF FIGURES xvii
6.12 CDF of the mean transmitted packet of the video flows in the
cross-layer architecture and adaptive architecture for MAD and Grandma sequences . . . 116
6.13 CDF of the mean delay of the video flows in the cross-layer archi-tecture and adaptive architecture for MAD and Grandma sequences 117
6.14 CDF of the mean jitter of the video flows in the cross-layer archi-tecture and adaptive architecture for MAD and Grandma sequences 118
6.15 Utilisation of thecross-layer architecture andadaptive architecture
for MAD and Grandma sequences . . . 119
6.16 CDF of the mean MOS of the video flows in the cross-layer ar-chitecture, adaptive architecture and non-adaptive architecture for MAD and Grandma sequences . . . 120
6.17 CDF of the mean number of sessions in the cross-layer architec-ture,adaptive architecture andnon-adaptive architecture for MAD and Grandma sequences . . . 121
List of Tables
2.1 Absolute metrics . . . 18
2.2 Comparative metrics . . . 19
2.3 Possible PSNR to MOS mapping . . . 19
3.1 Description of video sequences used in Chapter 3 and Chapter 6 . 29
3.2 Simulation parameters used in Chapter 3 and Chapter 6 . . . 30
4.1 Encoder settings . . . 43
4.2 Classification of slow and fast moving contents . . . 44
4.3 ANOVA results for δ and each of content, number of flows and measurement window . . . 44
4.4 Burstiness of the instantaneous and average aggregate rates . . . . 47
5.1 Description of video sequences used in Chapter 5 . . . 64
5.2 ANOVA results for main and interaction effects . . . 68
LIST OF TABLES xix
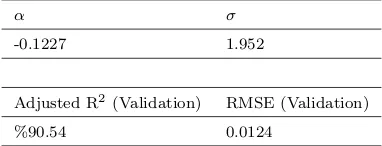
5.4 Coefficients ofβprediction model and model validation correlation coefficients-fast moving content (Paris video sequence) . . . 69
5.5 Encoder and network settings . . . 70
5.6 Packet drop ratio and admitted sessions of Pro-IBMAC and CBAC 72
5.7 Packet drop ratio and admitted session ofPro-IBMAC for different
β,Cl=22Mbps . . . 77
6.1 Comparison of QoE optimisation mechanisms through cross-layer designs . . . 101
6.2 Comparison of QoE optimisation mechanisms through scheduling 102
6.3 Comparison of QoE optimisation mechanisms through content and resource management . . . 105
Definitions
adaptive architecture A network architecture in which video sources imple-ment rate adaptation only
CalR(k) Calculated Rate over k slots
CBAC CalR-Based Admission Control
cross-layer architecture A network architecture in which video sources imple-ment rate adaptation and the gateway impleimple-ments the QoE-aware admission control
IAAR(t) Instantaneous Aggregate Arrival Rate ofF at t
ISP access links ISP links which are directly connected to and
con-trolled by the gateway in Figure 1.2
mean MOS The average of the MOS of admitted video sessions over 30 simulation runs
mean number of sessions The average of the number of admitted video sessions over 30 simulation runs
non-adaptive architecture A network architecture in which video sources do not implement rate adaptation and the gateway does not control video sessions
number of flows The number of video flows
number of sessions The number of successfully admitted video sessions for a specific simulation run
Pro-IAAR(t) Proposed IAAR at t
Pro-IBMAC ProposedPro-IAAR-Based Measurement Admission
Notations
AR(l) PCN admissible rate on link l
c A counter
Cl Link capacity
d Destination image
EhIAAR(t)i Expectation value of IAAR att
EhXinst(t)i Expectation value of Xinst at t
f A video flow
F A set of video flows
F-statistics F values of ANOVA
h A variable
j jth time slot
k Total number of time slots
kτ Measurement time window
l A network link
M A set of network links
n Number of video sessions
N A set of network nodes
p/p-value p value of ANOVA
pi(t) Probability the session i is active/inactive at t
Pr Probability
r(l) PCN traffic rate on link l
Rk Peak rate of a video session over k slots
SR(l) PCN supportable rate on link l
t Time
xi(t) Instantaneous arrival rate (throughput) of video session i att
xmini (t) Minimum rate of xi(t)
xmax
i (t) Peak rate of xi(t)
Xinst(t) Instantaneous aggregate arrival rate ofF att
xnew Rate of requested video session
Y(k) Sum of Xinst(t) over k slots
α A coefficient of β prediction model
β Total bitrate of enrolled video traffic that exceed Cl without
degra-dation to QoE
δ Upper bound of the probability thatµr(t) is smaller thanXinst(t) by
n or more
A positive number
µr(t) Average aggregate arrival rate of F at t
σ A coefficient of β prediction model
Acronyms
2G Second Generation 3D Three Dimensional 3G Third Generation
3GPP 3rd Generation Partnership Project 4G Fourth Generation
A
ABR Adaptive Bit Rate
ACR Absolute Category Rating
AIHD Additive-Increase Heuristic-Decrease ANOVA Analysis of Variance
ARPANET Advanced Research Projects Agency Network AS Autonomous System
AVC Advanced Video Coding
B
BPSK Binary Phase Shift Keying
C
CBR Constant Bit Rate
CDF Cumulative Distribution Function CDN Content Delivery Networks
CIF Common Intermediate Format
D
DASH Dynamic Adaptive Streaming over HTTP DIV Distortion In Interval
DSCQS Double-Stimulus Continuous Quality-Scale DSIS Double-Stimulus Impairment Scale
DVB-H Digital Video Broadcast-Handheld DVQ Digital Video Quality
E
ECN Explicit Congestion Notification
F
FEC Forward Error Correction FIFO First In First Out
FR Full-Reference FT Flow Termination FTP Tile Transfer Protocol
G
GoP Group of Picture
H
HAS HTTP Adaptive Streaming
HSDPA High Speed Downlink Packet Access HTTP Hypertext Transfer Protocol
HVS Human Visual System
HWN Heterogeneous Wireless Networks
I
Acronyms xxv
IP Internet Protocol IPTV IP Television
ISO/IEC International Organization for Standardization/IEC ISP Internet Service Provider
ITU-T International Telecommunication Union-Telecommunication
L
LAN Local Area Network LCD Liquid Crystal Display LTE Long Term Evolution
M
MAC Media Access Control MAD Mother And Daughter
MARC Mobile-Aware Adaptive Rate Control MBAC Measurement-Based Admission Control MCS Modulation and Coding Scheme
MDP Media Degradation Path MIH Media Independent Handover MIMO Multi-Input Multi-Output MOS Mean Opinion Score
MPCN Mobile Packet Core Network MPD Media Presentation Description MPEG Moving Picture Experts Group MPQM Moving Pictures Quality Metric MS-SSIM MultiScale Structural Similarity MSE Mean Squared Error
N
NS-2 Network Simulator-version 2
O
OFDMA Orthogonal Frequency Division Multiple Access OSI Open Systems Interconnection
P
P2P Peer-to-Peer
PCN Pre-Congestion Notification
PQSM Perceptual Quality Significance Map PSNR Peak-Signal-to-Noise Ratio
PSQA Pseudo Subjective Quality Assessment PSTN Public Switched Telephone Network
Q
QCIF Quarter Common Intermediate Format QoE Quality of Experience
QoS Quality of Service QP Quantisation Parameter
QPSK Quaternary Phase Shift Keying
R
RAN Radio Access Network RMSE Root Mean Squared Error RNN Random Neural Network ROI Region Of Interest RR Reduced-Reference RS Reed-Solomon
RTP Real-time Transport Protocol
S
Acronyms xxvii
SDSCE Simultaneous Double Stimulus for Continuous Evaluation SLA Service Level Agreement
SNR Signal-to-Noise Ratio SS Single Stimulus
SSCQE Single Stimulus Continuous Quality Evaluation SSIM Structural Similarity
SVBR Shaped-Variable Bit Rate SVC Scalable Video Coding
T
TCP Transport Control Protocol
TCP/IP Transport Control Protocol/Internet Protocol TFRC TCP Friendly Rate Control
U
UDP User Datagram Protocol
UMTS Universal Mobile Telecommunication Systems
V
VBR Variable Bit Rate
VCEG Video Coding Experts Group VoD Video on Demand
VoIP Voice over IP
VQM Video Quality Metric VSSIM Video Structural Similarity
W
WF Water-Filling WiFi Wireless Fidelity
Chapter 1
Introduction
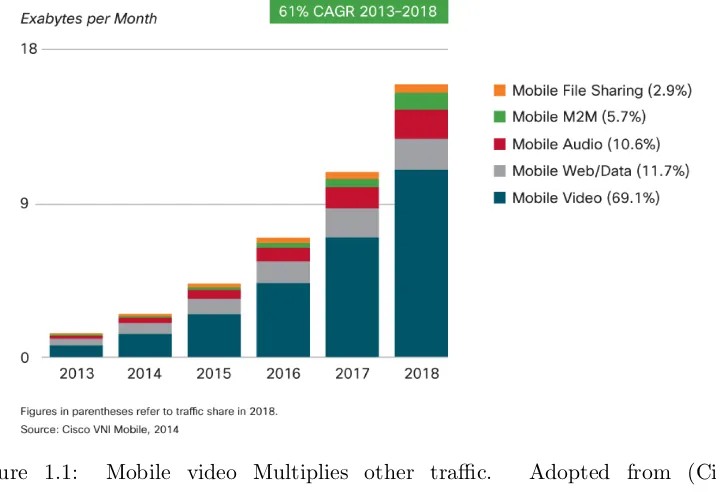
The transmission of video traffic over the Internet has grown exponentially in the past few years and it shows no sign of waning. The majority of the Internet traffic currently is video and this trend is expected to continue for the foreseeable future. The emergence of video based applications such as video calls, sports broadcasts and telemedicine have continually increased the amount of video traffic over the Internet. Cisco predicts that, “the sum of all forms of video (TV, Video on Demand [VoD], Internet, and Peer-to-Peer [P2P]) will be in the range of 80 to 90 percent of global consumer traffic by 2018” and that, “it would take an individual over 5 million years to watch the amount of video that will cross global IP networks each month in 2018. Every second, nearly a million minutes of video content will cross the network by 2018” (Cisco documentation 2014a). In 2011, 58.6% of the total Internet traffic in North America was caused by real-time entertainment services such as Hulu and Netlix (Weller & Woodcock 2013). Figure 1.1 shows that video will remain the dominant data for mobile devices as well. These Cisco figures are based on a combination of analysts’ projections, in-house estimates and forecasts, and direct data collection.
Figure 1.1: Mobile video Multiplies other traffic. Adopted from (Cisco
documentation 2014b)
transport protocols. Bursty traffic refers to inconsistency of the video traffic level. It is at high level sometimes while is at low level at some other times.
Cisco forecasts that, “the number of devices connected to IP networks will be nearly twice as high as the global population in 2018” (Cisco documentation 2014a). Non-PC devices generate the majority of IP traffic (Cisco documentation 2014b), and most of these devices have high quality video playback capabilities. This feature is a key driver of the evolution of new mechanisms recommending video rate adaptation towards delivering enhanced Quality of Experience (QoE) for a higher number of accommodated sessions. One approach to maintain good QoE is done through transport protocols such as the Transport Control Protocol (TCP). Rate adaptation may also be implemented by the sender, receiver, or both. The sender can encode the video content at different bit rates and switch these bit rates dynamically. Different techniques such as receiver-driven layered multicast and buffer requirements are used at the receiver (Liu et al. 2011). In this study, the sender style rate adaptation is performed by the video sources.
1.1 Problem Statement 3
browsers is HTTP Adaptive Streaming (HAS) (Oyman & Singh 2012). A client and the web/media server decide the rate at which they communicate. Many companies have introduced HAS solutions such as Microsoft Smooth Streaming, Apple HTTP Live Streaming and Adobe HTTP Dynamic Streaming. Other solutions have also been proposed to tackle the challenge of video traffic growth such as WiFi offloading (Maallawi et al. 2014).
Since video traffic is very bursty, it is hard to estimate traffic parameters. This is one of the weaknesses of the Measurement-Based Admission Control (MBAC) solutions which rely on more predictable traffic rates. The challenge in delivering video services therefore, is more rigorous when it is associated with the QoE of video sessions.
1.1
Problem Statement
So is the Internet really broken? Okay, maybe that was an exaggeration. But
the 40-year-old router sure needs an overhaul. I should know Lawrence Roberts, one of the founders of the Internet, 2009 (Roberts 2009)
Forty-eight years ago, the ancestor of today’s Internet, the Advanced Research Projects Agency Network (ARPANET) was built to send data as small indepen-dent packets with no attention to their arrival time or order (Roberts 2009). Since then, enhancements have been added to the initial infrastructure of ARPANET to do more than what was originally designed for, through the addition of intel-ligence to the network hosts and routers. This is due to the critical feature of self-controlling behaviour of the TCP which kept the Internet stable for decades.
over-dimensioned optical backbone networks to accommodate the growth in re-altime traffic; often running well below the full link capacity.
Although these techniques have enabled the Internet to provide some level of guar-anteed Quality of Service (QoS) for realtime traffic, some consider the Internet is broken when facing the challenges of modern Internet traffic (Roberts 2009). Evo-lution and popularity of video application such as videoconferencing and video streaming services, as well as video devices, have contributed to the explosive growth of the video traffic on the Internet. QoE extends the scope of expecta-tion beyond the network layer to include higher layers. To protect the quality of video, both an admission control at the edge of network and rate adaptation at source of the flows are required. Admission control algorithm however, must not rely on the worst-case bounds or instantaneous video arrival rate as they do not reflect the bursty nature of video traffic. This is due to the fact that the burstiness of video flows can be compensated by the silence of other flows. The perceived QoE-Session relationship can be greatly optimised by exploiting the bursty nature of video traffic.
Taking these into accounts, we propose the following hypothesis: “QoE can be optimised by combining techniques from application and network layers. In
ad-dition to implementing rate adaptation by the video applications, a QoE-aware
admission control can balance the QoE and number of sessions relationships”. This dissertation attempts to validate this hypothesis.
The hypothesis is based on the following facts:
• The Internet has been over-provisioned in the way that huge bandwidth is offered to handle multimedia traffic spikes. However, on average it is running below its full capacity (Roberts 2009)
1.2 Scope of the Thesis 5
• Video streams share limited bandwidth and compete on access to the network. This causes packet loss and delay which leads to QoE degradation. Admission procedures are necessary to maintain the QoE of active video sessions; however they are not required to be static, they can be problematic. Admitted sessions and QoE became a direct trade-off
• Currently, there is no entirely satisfactory admission algorithm for variable rate flows (Auge et al. 2011).
1.2
Scope of the Thesis
This work assumes a simplified network diagram as shown in Figure 1.2. It shows a typical scenario where video sources are depicted on the left hand side. They share the bandwidth of the ISP access links (ISP links which are directly connected to and controlled by the gateway in Figure 1.2), the focus of this thesis. As routing and load balancing are beyond the scope of this study, a single
ISP access link is considered for structuring and evaluating the mathematical foundations. It is also assumed that there is sufficient bandwidth available in the backbone, i.e. the Internet. The proposed QoE-aware admission control is implemented at the ISP gateway while the sources perform rate adaptation based on the available bandwidth of the ISP access links.
ISP network Video sources
Distribution network Core network
Access network
Internet
Figure 1.2: Topology scenario considered in the thesis
This study does not consider the bottlenecks caused by a Wireless Local Area Network (WLAN) connecting end users to the wired network. Since, quality degradation is typically noticed most in video streaming service, this work focuses on this type of video services. This is not a principal limitation of the models that have been developed as part of this thesis. They can be adapted to other bottleneck situations easily.
1.3
Research Objectives
The main aim of this thesis is to improve the QoE of video traffic by imple-menting the adaptability of video streams to share a bottleneck bandwidth. It considers optimisation techniques across different layers and network equipment. The following objectives are addressed:
Objective One
To analyse the impact of Sender Bit Rate (SBR) on the perceived video quality and evaluate the performance of video flows in the adaptive architecture and
non-adaptive architecture. In thenon-adaptive architecture video sources do not implement rate adaptation. Whereas, video flows in the adaptive architecture
1.3 Research Objectives 7
transport layer. Applications that have the capability to adapt their rate need to be more aware of what is occurring in the network. Variations in the sender rate indicate the level of the quality delivered to end users.
Objective Two
To model and evaluate a suitable rate to be used by admission procedures for video traffic. Calculated Rate (CalR) over time windows has been proposed to better suit variable rates. This rate will be compared to the instantaneous rate in the context of bursty video traffic.
Objective Three
To determine the number of video sessions that can share the bandwidth of a network link without affecting the QoE of active sessions. Links cause most network bottlenecks (Chen et al. 2013, Camara et al. 2010). The traditional way to handle this and maintain the quality of on-going traffic, is to have some sort of service management techniques such as flow and admission controls. Current amounts of video traffic on the Internet require a less restrictive technique in order to serve maximum number of users with acceptable quality. This is possible because video traffic is bursty in nature and error correction at the decoder level can tolerate some packet loss.
Objective Four
1.4
Main Contributions
This dissertation provides a cross-layer and cross-device QoE optimisation for video streaming services. It addresses the problem of QoE degradation in a bottleneck network. In particular, it allows video sources at the application layer to adapt to the network environment by controlling the transmitted bit rate dynamically. While, the edge of the network protects the quality of active video sessions by controlling the acceptance of new session through a proposed QoE-aware admission control. The application layer contributes to the optimisation process by dynamically adapting source bit rate based on the conditions of the network and the network layer controls admission of new video sessions based on the rate follows the novel mechanism introduce here. The thesis contributes to the research field of QoE optimisation of video traffic. The main contributions are summarised in the following points:
Contribution One
A comprehensive survey of mechanisms proposed for optimising QoE of video traffic has been undertaken. The focus was the work that had been published in the last 10 years. The mechanisms have been categorised according to their functions and compared in each category. The survey was published in (Qadir et al. 2015a).
Contribution Two
A novel model is proposed to quantify the probability relationship between the instantaneous and average aggregate rates. The proposed model has been vali-dated through extensive simulations. The estimated quantified probability has been investigated using different video contents (slow moving content such as news and fast moving content such as sports) and measurement windows. The model was published in (Qadir et al. 2015c, Qadir & Kist 2013b).
Contribution Three
1.5 Dissertation Outline 9
has been used to validate the parameters of the proposed model. The algorithm was published in (Qadir et al. 2015b).
Contribution Four
The measurement algorithm proposed in the previous point has been imple-mented, in a QoE-aware admission control procedure for video admission. Ex-tensive simulations, subjective tests and statistical analysis were performed to confirm the suitability of the proposed algorithm for video streaming services. The QoE-aware admission control was published in (Qadir et al. 2015b).
Contribution Five
A cross-layer architecture has been proposed to optimise the QoE of video traffic. The combination of rate adaptation at the application layer and the proposed QoE-aware admission control at the network layer was presented. The proposed architecture through extensive simulations and statistical indices, has shown a considerable improvement of the QoE-number of sessions trade-off when com-pared to an architecture without the proposed QoE-aware admission control algorithm. The performance of the architecture was evaluated and published in (Qadir et al. 2015d, Qadir et al. 2014).
1.5
Dissertation Outline
This dissertation is divided into seven chapters. Relevant literature is discussed in the individual chapters. A schematic diagram of the remaining chapters is shown in Figure 1.3. The following points summarise the organisation of the thesis.
Chapter Twoexplains QoE for video streaming services. A background overview of QoE is provided. The reason behind the transition from QoS to QoE is ex-plained. The trend towards QoE-driven management of the Internet is discussed. QoE models and metrics as well as methods of subjective tests are surveyed.
Ch. 4 Ch. 5
Ch. 6 QoE-aware rate measurement
& admission control
Rate measurement mechanisms QoE-aware cross-layer architecture QoE fundamentals
Rate adaptation
Ch. 3 Ch. 2
Figure 1.3: Schematic diagram of the chapters of dissertation
The performance of the video flows in theadaptive architectureandnon-adaptive architecture are studied. The investigation was published in (Qadir & Kist 2013a).
Chapter Four investigates the suitability of the instantaneous and average aggregate traffic rates for video traffic. An algorithm for quantifying the prob-ability relationship between both rates is modelled. The impact of the number of video flows, video content and measurement window on this probability are investigated.
Chapter Five proposes and models a QoE-aware traffic measurement algo-rithm for video traffic. A parameter that defines the limit of the exceedable traffic is modelled and the model parameters are found using analysis of variance (ANOVA). The performance of the proposed algorithm is studied and simulation results are compared to the subjective and predicted results from the proposed model.
Chapter Six presents the design of a cross-layer architecture for optimising QoE of video traffic based on the models proposed in Chapters 3, 4 and 5. An overview research conducted in the area of QoE optimisation through different techniques and across layers is provided. The performance of the proposed architecture are compared to other architectures.
Chapter 2
QoE of Video Streaming Services
Over the last decade, efforts have been made to provide QoS within the core network by considering technical performance parameters at the network layer such as bandwidth, delay, and jitter (variation in delay). Differentiated Ser-vices (Blake et al. 1998) is an example of these paradigms that can ensure QoS. However, quality from the end user perspective, does not equate to QoS on the network layer. The research community and ISPs have made subjective quality as perceived by the end users known as QoE, a main research target. The In-ternational Telecommunication Union-Telecommunication (ITU-T) defines QoE as “The overall acceptability of an application or service, as perceived subjec-tively by the end-user” (ITU-T Document FG IPTV-IL-0050 2007). The design of the Internet has to consider extending the scope of QoS to consider end-to-end quality, be content-aware and user centric. The European network of excellence (Qualinet) aims at extending the network-centric QoS by introducing the concept of QoE (Qualinet 2013).
decoding and across the access and core networks are involved in providing an end-to-end QoE to end users.
QoE as a main performance metric target is used in this study. It is discussed in the context of video streaming services.
2.1
Factors Affecting QoE
The perception of quality mainly depends on (but is not limited to) the quality of the source in addition to all other elements of the communication system such as the network, equipment, codecs, techniques, protocols and terminals (Stankiewicz et al. 2011). Various technical and non-technical factors affect the quality measure of QoE. Among these factors are those which are related to service preparation, delivery and presentation. Technically, the perceived video quality is mainly affected by the trade-off relationship between encoding redundancy and network impairment. Brooks & Hestnes (2010) list a number of technical and human variables such as conscious and unconscious psychological factors to be considered in developing the concept of QoE and its measurement. Figure 2.1 lists the attributes of QoE and shows a breakdown of QoE into a set of parameters. In the networking domain, for example, quality is closely linked to network parameters such as bandwidth, delay and packet loss ratio.
2.1 Factors Affecting QoE 13
Figure 2.1: QoE technical and non-technical parameters. Adopted from (Brooks
& Hestnes 2010)
The discussion here has highlighted some of the factors at the present time. We will discuss our assumption in details in Section 5.6.
2.2
Video Quality Assessment
Video has changed the main role of some Internet enabled devices to a simple TV screen. It has therefore, become crucial for video content providers to increase the user engagement and resource utilisation. The objective of initially developed models was to address compression artifacts. Frame freezing due to unreliable transmissions such as Real-time Transport Protocol (RTP) over User Datagram Protocol (UDP) has promoted more sophisticated models that can conceal some level of packet loss. More recently, progressive download over HTTP led to new models (Moller & Raake 2014). Reliable prediction models to assess video quality have become indispensable and have received a lot of attention by the research community during the last decade. The outcome of these efforts include a number of video quality assessment models with different levels of computational com-plexity and accuracy. In general, quality is assessed by the following principal methods (Moller & Raake 2014):
2.2 Video Quality Assessment 15
2. Objective assessment, through algorithms and mathematical equations, are normally called “models”. They are intended to overcome the drawbacks of subjective tests (Stankiewicz et al. 2011). In contrast to subjective assess-ment, this type of assessment is less costly and time-consuming; however it lacks the user’s judgement. The disadvantage of this method is that the result is not informative enough and not accurate, thus needs to be verified by sub-jective methods (Stankiewicz et al. 2011). For this reason, the next method of assessment is used
3. Objective assessment with additional consideration of context and user be-haviour (Dobrian et al. 2011). This method is a hybrid of the subjective and objective methods in which both the technical parameters and human rating are taken into account (Cherif et al. 2011) (Piamrat, Viho, Bonnin & Ksentini 2009).
The ITU recommends both objective modelling of measurable technical system performance and subjective testing with people (Brooks & Hestnes 2010). The European telecommunications standards institute developed a complementary approach based on combining objective measures of user performance with quan-titative subjective measures (ETSI STF 354 n.d.). The ITU classifies objective quality assessment methodologies into five categories (Takahashi et al. 2008). Figure 2.2 summaries these methods.
Media-layer model
As no priori information about the system is required, this model can be applied to unknown system such as codec comparison/optimisation. QoE is predicted from speech/video signals. The ITU-T Recommendation J.144 (2001) for video and ITU-T Recommendation P.862.1 (2003) for speech are two examples. These models are also called signal-based models.
Figure 2.2: Taxonomy of objective quality assessment methods. Adopted from
(Takahashi et al. 2008)
only on the distorted information for quality evaluation (Deng et al. 2015). FR compares the reference signal with distorted signal and RR uses the partial information from the reference to estimate the QoE metric. Systems that do not have access to the reference implement NR by analysing the output sig-nal only. The full-reference and reduced-reference media-layer objective video quality assessment methods are reviewed, classified and compared in (Chikkerur et al. 2011).
Parametric packet-layer model
Unlike the media-layer model, the parametric packet-layer model does not re-quire access to the media signal. Instead, QoE is solely predicted from the header of the packet. Since, it doesn’t inspect the payload of the packet, it makes content-based QoE evaluation difficult. In addition to commercial mod-els, ITU-T Recommendation P.564 (2007) is the standard packet-layer model.
Parametric planning model
2.3 Quality Metrics 17
Bitstream-layer model
To overcome the content-based QoE evaluation flaw of the parametric packet-layer model and computational complexity of the media-packet-layer model, the bitstream-layer model uses encoded bitstream information and packet-bitstream-layer information to predict QoE.
Hybrid model
Two or more previously discussed models are combined to predict the QoE in this method.
2.3
Quality Metrics
Objective video quality metrics have been proposed because the QoS parameters such as throughput, delay and jitter do not precisely define the QoE of multimedia services (Latr´e et al. 2009). The most reliable measure of QoE depends on the Mean Opinion Score (MOS). This metric is defined by the ITU as “The mean of opinion scores, i.e., of the values on a predefined scale that subjects assign to their opinion of the performance of the telephone transmission system used either for conversation or for listening to spoken material” (ITU-T Recommendation P.800.1 2006). MOS was initially recommended for voice telephone services and is today also widely used for video services. MOS is considered as an absolute metric compared to other comparative metrics which compare the quality of two tests. Absolute and comparative metrics are illustrated in Tables 2.1 and 2.2 respectively (Stankiewicz et al. 2011). This study relies on the absolute metric (MOS), however Other objective metrics are also briefly discussed in the following three categories.
1. Traditional point-based metrics
(Riley & Richardson 1997). PSNR tool are available to calculate the PSNR value. A possible mapping of PSNR to MOS is shown in Table 2.3 (Ohm 2004). However, this is a problematic approach as PSNR does not directly correspond to MOS (Gross et al. 2004). This straightforward mapping depends on many parameters such as coding, resolution and reference video. A more linear approach is recommended for assessing the QoE of video which is transferred over the lossy networks (packet/frame loss).
PSNR(s, d) = 20 log Vpeak
MSE(s, d) (2.1) where
Vpeak = 2h−1; h bit colour depth
MSE(s,d)= mean square error of s and d.
2. Natural visual characteristic metrics
The Video Quality Metric (VQM) (Pinson & Wolf 2004) and Structural SIM-ilarity (SSIM) (Wang, Bovik, Sheikh & Simoncelli 2004) are two examples of the natural visual characteristics metric. The non standardised (expanded) version of VQM can be used to measure the perceived video quality for var-ious video applications such as wireless or IP-based video streaming systems (Chikkerur et al. 2011). SSIM estimates the perceived quality frame by frame and is considered to have a higher correlation with subjective quality ratings (Group 2008). The SSIM index assumes that the Human Visual System (HVS) is more oriented towards the identification of structural information in video sequences. It produces a score between 0 and 1 from the original and received signals (Wang, Bovik, Sheikh & Simoncelli 2004). There are derivatives of SSIM such as the Video (VSSIM) (Wang, Lu & Bovik 2004), MultiScale SSIM
Table 2.1: Absolute metrics
MOS Quality Impairment
2.3 Quality Metrics 19
Table 2.2: Comparative metrics
Score Description
3 Much better 2 Better 1 Slightly better 0 About the same -1 Slightly worse -2 Worse -3 Much worse
(MS-SSIM) (Wang et al. 2003) and speed SSIM (Wang & Li 2007) (Chikkerur et al. 2011)
3. Perceptual HVS metrics
This metric is based on HVS characteristics. The subjective quality of mov-ing pictures that contain arbitrary impairments is predicted by this met-ric (Chikkerur et al. 2011). The Moving Pictures Quality Metmet-ric (MPQM) (Lambrecht & Verscheure 1996), Digital Video Quality (DVQ) (Watson et al. 2001), and Perceptual Quality Significance Map (PQSM) (Lu et al. 2003) are a few examples of the perceptual HVS metrics.
The FR and RR approaches can use any of the above metrics. A comparison for each of the natural visual characteristics and perceptual (HVS) metrics is provided in (Chikkerur et al. 2011).
Table 2.3: Possible PSNR to MOS mapping
PSNR MOS Quality
>37 5 Excellent 31 - 37 4 Good 25 - 31 3 Fair 20 - 25 2 Poor
2.4
QoE Prediction Models
QoS-based approaches attempt to guarantee services by either ensuring the value of a particular service metric under the desired limit (e.g., delay under 30 millisec-onds) or differentiating and prioritising traffic into classes such as high, medium or low. On the other hand, QoE models include more subjective aspects re-lated to user perception for measuring network performance (Ernst et al. 2014). The video prediction models discussed in the previous section are limited to short videos of 10 seconds length and laboratory viewing environment which is different from actual viewing conditions.
Addressing quality from end users’ perceptual points-of-view is a new strategy. Proper selection of quality related parameters and mapping are an essential part of model construction. However, research in this area is limited. Most of the existing models are either limited to a few parameters as explained in Section 2.1 or restricted to a specific underlying network. Aspects such as audio-visual quality, field testing, and user impact characterization must be considered to obtain a more accurate QoE-centric prediction model (Moller & Raake 2014). The ITU-T Study Group 9 (ITU-T Recommendation J.343 2014) is working on the standardisation of non-intrusive hybrid perceptual/bitstream models for IP television (IPTV) and mobile video streaming applications (Khan et al. 2012). Therefore, objective QoE models which cover most services’ end-to-end parame-ters that directly or indirectly related to quality, become an important research area.
2.5 Methodology for Subjective Quality Assessment 21
A non-intrusive QoE prediction model was established in (Khan et al. 2012) for low bitrate and resolution H.264 encoded videos. It targets the Universal Mobile Telecommunication Systems (UMTS) and is an extension of previous work (Khan, Sun, Ifeachor, Fajardo, Liberal & Koumaras 2010). QoE-content type and sender bitrate from the application layer and block error and mean burst length from the network layer are taken as parameters of the model. Joskowicz et al. (2013) present a general parametric model based on the results of a comparison of several parametric models. The model takes into account bit rate, frame rate, display resolution, video content and the percentage of packet loss.
2.5
Methodology for Subjective Quality
Assess-ment
Subjective tests aim to assess the performance of a system by using measure-ments that directly reflect the perception of people who are using the system. It complements objective measurements of a system. The ITU provides methodolo-gies for assessing picture quality. These include general methods, grading scales and viewing conditions as well as guidelines for analysing collected data (ITU-R Recommendation BT.500-13 2012, ITU-T Recommendation P.910 1999). The following methods are recommended:
1. Double-Stimulus Impairment Scale (DSIS) [ITU-R Rec. BT.500-13]
In this method, the reference sequence is presented then the test sequence in an order that is known to the assessor. Both sequences are rated on a discrete five-level scale, ranging from very annoying to imperceptible
3. Single Stimulus (SS) [ITU-R Rec. P.910]
This method is also called Absolute Category Rating (ACR). Sequences are presented one at a time and are rated independently on a scale from 1 (bad) to 5 (excellent)
4. Pair-comparison [ITU-R Rec. P.910]
The same test sequences are presented under varying conditions in pairs and both are evaluated
5. Single Stimulus Continuous Quality Evaluation (SSCQE) [ITU-R Rec. BT.500-13]
The test video sequence are presented and rated instantaneously on a scale of bad to excellent
6. Simultaneous Double Stimulus for Continuous Evaluation (SDSCE) [ITU-R Rec. BT.500-13]
The reference and test video sequences are presented at the same time and judged by moving the slider of a handset-voting device.
The SS/ACR method with five grade scale from 1 to 5 was used to conduct the subjective tests in this study (as explained in Section 5.6). Similar studies (Khan et al. 2012) used this method for rating the quality of video over the IP networks.
2.6
Summary
Chapter 3
QoE Enhancement through
Adapting Sender Bit Rate
With the rapid growth of video traffic over the Internet, providing perceptually good video quality is a challenging task. Improving QoE can be achieved by focusing on all relevant layers and across the networks end-to-end. Video frames are subject to loss and delay which degrades quality when sent without reacting to the congested network. Constant rate encoding does not guarantee smooth video quality and is not feasible for the Internet (Kim & Ammar 2005), while adjusting the encoding rate can minimise network congestion and improve video quality. Adaptive encoding, switching between multiple pre-encoded rates or hierarchical encoding can be implemented to address this issue (Koo & Chung 2010).
Rate-adaptation has been proposed as a mechanism to enhance the QoE of video services. In this chapter, QoE improvement by adapting SBR, is investigated. Related works in the area of rate adaptation to achieve quality improvement are surveyed. The impact of SBR on QoE is analysed to see how the perceived video quality is affected by this parameter. Furthermore, a mathematical relationship between QoE and bit rate is established which can be extended to include other parameters. Then, implementing rate adaptation by video sources for enhancing the video quality is evaluated.
3.1
Related Work
Adaptive video rate is not a new topic. It has been proposed by researchers to enhance video quality. Kim & Ammar (2005) address the problem of quality variations for layered Variable Bit Rate (VBR) video over the Internet while efficiently utilising the available network bandwidth. They propose an optimal adaptation algorithm and a real-time adaptation algorithm based on whether the network conditions are known a priori. The quality adaptation algorithm is composed of quality and rate smoothing algorithms. The quality smoothing algorithm reduces the quality variability for the layered Constant Bit Rate (CBR) video using bidirectional layer selection; and the rate smoothing algorithm ensures that the data rate of the encoded video is sufficiently smooth to exhibit nearly CBR. The experimental results showed that the proposed algorithms maintain consistent video quality over TCP and TCP Friendly Rate Control (TFRC); however the algorithms are limited to layered video delivery such as SVC.
3.1 Related Work 25
The proposed algorithm is based on the parameters of the leaky-bucket such as rate and virtual buffer size. Despite the reduction of VBR traffic burstiness, the leaky-bucket increases delay due to extra buffering.
A rate control algorithm was proposed by Rodriguez-Escalona (2011) for H.264/SVC VBR applications with buffer constraints. Unnecessary QP fluctuation is man-aged based on the Gaussian processes regression model. Buffer starvation is pre-vented by allowing an incremental variation of QP with respect to the previous picture. The experimental results included a consistent quality, secured buffer, and smooth target bit rate. The algorithm proposes a set of buffers (one per tem-poral resolution sub-stream) which introduce more buffering delay. Moreover, it is assumed that consecutive pictures within the same scene often exhibit similar degrees of complexity which is not a valid assumption for video scenes.
Koo & Chung (2010) propose an adaptive streaming scheme called Mobile-Aware Adaptive Rate Control (MARC) which adjusts the quality of the bit-stream and transmission rate of video streaming in mobile broadband networks based on the status of the wireless channel and network as well as client buffer for SVC. The scheme provides a seamless multimedia playback service in wireless broadband networks and improves the QoS of multimedia streaming services by mitigating the discontinuity of multimedia playback and allocating a suitable buffer to a client. An Additive-Increase Heuristic-Decrease (AIHD) congestion control is proposed to reduce rate oscillation. Simulation results show that the proposed MARC can appropriately control the transmission rate of video streaming based on the mobile station status in the wireless network, though it is limited to the layered video such as SVC.
increased compared to the existing solutions including the Institute of Electrical and Electronics Engineers (IEEE) 802.11 standard. The tool is based on statistic learning using the Random Neural Network (RNN). The RNN is trained using mapping between QoE scores and technical parameters. It has to be re-trained whenever new parameters have to be taken into consideration. The application of this work is limited to wireless LANs managed by one access point.
The authors of (Khan, Sun, Jammeh & Ifeachor 2010) use a QoE prediction model from their previous work (Khan et al. 2009b) to adapt SBR for video over wireless that is suitable for some network resources and content types. The model identifies the optimum trade-off between video SBR and frame rate. It optimises QoE and wireless network utilisation through SBR adaptation based on the requested QoE. For a requested QoE level, an appropriate SBR is identified by content providers and optimised resources are provided by network operators. QoE is predicted by relying on a limited number of parameters such as content type, SBR and frame-rate from the application layer and packet error ratio from the network layer.
A user-centric discretized streaming model was specially designed for live rate-adaptive streaming in modern Content Delivery Networks (CDN)s in (Liu et al. 2014). The objectives are to enhance the minimum satisfaction among users and maximise the average satisfaction of users. Algorithms were also proposed for the CDN’s content placement, content delivery and user assignment. The system with limited CDN resources in a dynamic environment achieves high user satisfaction shown by a large simulation campaign.
3.2 Video Quality Model 27
to support for differentiated services and fairness with conventional TCP flows. The proxy at the edge of a wireless network maximises the weighted sum of video qualities of different streams by iteratively allocating rates for each stream based on their respective rate-quality relations, wireless link throughputs and buffer status (without feedback from receivers). The subjective quality is related to a given rate by choosing the optimal frame rate and quantisation stepsize through an analytical rate-quality trade-off model. The study is limited to the layered video. Furthermore, it did not justify how quality based on which the rate is allocated to individual stream, has been estimated without feedback from the receiver.
3.2
Video Quality Model
In this section, we draw a mathematical relationship between QoE and the arrival rate of a video source. Letxi(t) be the instantaneous arrival rate (SBR) of video
session i at time t. We consider a network of N nodes and M ⊆ N × N links, where linkl ∈M and F denotes the set of flows wheref ∈F. The instantaneous aggregate arrival rate Xinst(t) of on-going flows F at time t is
Xinst(t) = n
X
i=1
xi(t) (3.1)
for i >0 and t >0. Where n is the number of sessions.
xi(t) is taken into consideration, as an application layer parameter affecting the
video quality, based on our experimental results and results of (Ries & Nemethova 2008, Khan et al. 2012, Calyam et al. 2007). From (Thakolsri et al. 2009), a user’s QoE (in terms of MOS) for video streaming can be defined by a simplified utility function as a function of transmission rate as is given by Equation (3.2)
Figure 3.1: A snapshot of the video sequences used in Chapter 3 and Chapter 6,
MAD (left) and Grandma (right)
Equation (3.2) indicates that a higher SBR guarantees a better quality. The relationship between SBR and MOS is plotted and analysed in Section 3.4.
3.3
Evaluation Environment
In this section, an adaptive architecture in which video sources adapt their SBR, was compared to anon-adaptive architecture in which video sources send without adapting their SBR.
3.3 Evaluation Environment 29
.
.
.
.
.
.
Sources
Receivers
QoE
.
.
.
.
.
.
Figure 3.2: Network topology used in the simulations in Chapter 3 and Chapter 6
bit rates). The description of the video contents as well as coding and network parameters are shown in Tables 3.1 and 3.2 respectively.
The MAD and Grandma video sequences were utilised by the NS-2 simulator through a video trace file using EvalVid-RA. The objective of having two different video resolutions, Quarter Common Intermediate Format (QCIF) and Common Intermediate Format (CIF), was to see the impact of video frame size on the performance metrics not to compare these two resolutions. Due to dissimilar characteristics of each resolution, different link capacity and queue size were used in the simulation to subject both videos to the bottleneck condition. Same link capacity and queue size do not guarantee this condition for both videos (One large and another small). Same simulation parameters for both resolutions do not add credibility as we are not comparing them as mentioned earlier in this section. The studied metrics for both resolutions are plotted under each other in this chapter and Chapter 6 for the sake of convenience not comparison. MOS was measured
Table 3.1: Description of video sequences used in Chapter 3 and Chapter 6
Description Video sequence 1 Video sequence 2
Name Mother And Daughter (MAD) Grandma
Description A mother and daughter speaking at low motion
A woman speaking at low motion
Frame size CIF (352x288) QCIF (176x144)
Duration (second) 30 28
Table 3.2: Simulation parameters used in Chapter 3 and Chapter 6
Parameter Value
Encoder
Frame rate (fps) 30
GoP 30
Video quantizer scale/QP 2 (Non-adaptive traffic) 2-31 (Adaptive traffic)
Network
Link capacity (Mbps) 32 (MAD) 7 (Grandma)
VBR sources 24
FTP sources 48
Packet size (byte) 1052 UDP header size (byte) 8 IP header size (byte) 20
Queue size (packet) 300 (MAD) 100 (Grandma) Link delay (millisecond) 1
Queue management Droptail
Queue discipline FIFO (First In First Out) Simulation time (second) 500
using Evalvid (Gross et al. 2004) which provides a set of tools to analyse and evaluate video quality by means of PSNR and MOS metrics. The Evalvid MOS metric (referred to as simulated MOS in this dissertation) calculates the average MOS value of all frames for the entire video. The MOS metric represents the impression of end users for the entire received video and has been widely used by the research community (Zheng et al. 2015, Li & Pan 2010, Khan, Sun & Ifeachor 2010, Kim & Chung 2012, Khan et al. 2009b, Tommasi et al. 2014, Papadimitriou & Tsaoussidis 2007, Khan et al. 2009a, Ma et al. 2012, Aguiar 2008, Erdelj 2013, Tan 2013, Escuer 2014). Although the MOS metric does not map very well to the subjective impression for a long video sequence, it is used for short (up to 45 second) video sequences in this dissertation.
3.4 Results and Discussions 31
The CDF function of MATLAB was used in this study. CDF or complemen-tary CDF (CCDF) has been used by researchers for the similar purpose (Menth & Lehrieder 2012, El Essaili et al. 2014, Liu et al. 2014, Zhao et al. 2014, Li et al. 2015, Dobrian et al. 2011).
3.4
Results and Discussions
This section presents and discusses the results obtained from a number of simu-lations. Figure 3.3 explains the relationship between MOS and SBR. The figure shows how the video quality is influenced by the bit rate. It can be noticed that there is a logarithmic relationship between MOS and SBR. A bitrate of 100Kbps or higher provides the maximum value of MOS (5) and excellent video quality for the specific video content described in Table 3.1. However, since the maximum MOS value for any multimedia applications is 4.5 (Thakolsri et al. 2009), this simulation result can not be generalised. Furthermore, this relationship depends on the video content type (Khan et al. 2012). A lower MOS and less quality are expected for medium and high content movement videos for the same bitrate (Khan et al. 2012).
In a further simulation, rate adaptation is implemented by the video sources and investigated in terms of quality, number of successfully admitted and decoded sessions, delay and jitter. As both architectures simply accept all the VBR and FTP flows without any restrictions, only video sessions that have been success-fully decoded and played back by the receiver were considered for the number of sessions metric. There would be more sessions, but as they were not decoded and played back successfully by the receiver, they have not been taken into account.
The CDF of the mean MOS of the video flows in the adaptive architecture and
0 10 20 30 40 50 60 70 80 90 100 110 3
3.5 4 4.5 5 5.5
SBR (Kbps)
MOS
Figure 3.3: Relationship of MOS with the instantaneous arrival rate
video flows about the network condition in the adaptive architecture than the video flows in the non-adaptive architecture. The video sources in the adaptive architecture attempt to scale their sending rate according to the resources avail-able. This is done at the application layer in contrast to the traditional TCP self-controlling done at the transport layer. Variations in the sender rate indicate the level of the quality delivered to end users. FTP traffic is also allowed to share the bandwidth in either scenario, thus not being penalised by the video flows. This is the main reason the video flows do not achieve high values of MOS. As video traffic is the main target of this dissertation, the fairness among flows (FTP and VBR) is not investigated.
A higher number of video sessions can be decoded successfully in the adaptive architecture than in the non-adaptive architecture. However this depends on the video resolution. The CDF of the mean number of the video sessions in the
3.4 Results and Discussions 33
1 1.5 2 2.5
0 0.1 0.2 0.3 0.4 0.5 0.6 0.7 0.8 0.9 1 mean MOS CDF Adaptive architecture Non−adaptive architecture
(a) MAD (CIF)
1 1.5 2 2.5
0 0.1 0.2 0.3 0.4 0.5 0.6 0.7 0.8 0.9 1 mean MOS CDF Adaptive architecture Non−adaptive architecture
(b) Grandma (QCIF)
Figure 3.4: CDF of the mean MOS of the video flows in theadaptive architecture
andnon-adaptive architecture for MAD and Grandma sequences
architecture and non-adaptive architecture for both resolutions. Please note that we do not compare thenumber of sessions of both resolutions due to their specific simulation settings.
0 5 10 15 20 25 0 0.1 0.2 0.3 0.4 0.5 0.6 0.7 0.8 0.9 1 mean n CDF Adaptive architecture Non−adaptive architecture
(a) MAD (CIF)
0 5 10 15 20 25
0 0.1 0.2 0.3 0.4 0.5 0.6 0.7 0.8 0.9 1 mean n CDF Adaptive architecture Non−adaptive architecture
(b) Grandma (QCIF)
Figure 3.5: CDF of the mean number of sessions in the adaptive architecture and
non-adaptive architecture for MAD and Grandma sequences
While, there were 2.09 and 21 respectively for the CIF sequence in the adaptive architecture compared to 1.66 and 19.93 respectively in the non-adaptive archi-tecture.
3.5 Summary 35
Adaptive architecture Non-adaptive architecture 0 5 10 15 20 25 0 1 2 3 4 5
mean n mean MOS
n
M
O
S
(a) MAD (CIF)
Adaptive architecture Non-adaptive architecture 0 5 10 15 20 25 0 1 2 3 4 5
mean n mean MOS
n MOS
(b) Grandma (QCIF)
Figure 3.6: Mean MOS of the video flows and meannumber of sessionsin the
adap-tive architecture and non-adaptive architecture for MAD and Grandma sequences
3.5
Summary
70 75 80 85 90 95 100 105 110 115 120 0 0.1 0.2 0.3 0.4 0.5 0.6 0.7 0.8 0.9 1
mean Delay (ms)
CDF
Adaptive architecture Non−adaptive architecture
(a) MAD (CIF)
70 75 80 85 90 95 100 105 110 115 120
0 0.1 0.2 0.3 0.4 0.5 0.6 0.7 0.8 0.9 1
mean Delay (ms)
CDF
Adaptive architecture Non−adaptive architecture
(b) Grandma (QCIF)
Figure 3.7: CDF of the mean delay of the video flows in the adaptive architecture
and non-adaptive architecture for MAD and Grandma sequences
applications to provide an acceptable level of QoE for a higher number of video users.
3.5 Summary 37
6.5 7 7.5 8 8.5 9 9.5 10 10.5 11
0 0.1 0.2 0.3 0.4 0.5 0.6 0.7 0.8 0.9 1
mean Jitter (ms)
CDF
Adaptive architecture
Non−adaptive architecture
(a) MAD (CIF)
6.5 7 7.5 8 8.5 9 9.5 10 10.5 11
0 0.1 0.2 0.3 0.4 0.5 0.6 0.7 0.8 0.9 1
mean Jitter (ms)
CDF
Adaptive architecture
Non−adaptive architecture
(b) Grandma (QCIF)
Figure 3.8: CDF of the mean jitter of the video flows in theadaptive architecture