ECONOMIC
Perspective
DEVOLUTION AND PUBLIC SPENDING: ARGUMENTS AND EVIDENCE by Arthur Midwinter, Department of Government, University of Strathclyde
INTRODUCTION
The financial arrangements for devolved government in Scotland have been regarded as problematic since the publication of the White Paper in 1997. Scotland's Parliament inherited the block and formula system for determining Scotland's share of annual changes in departmental expenditure from the Scottish Office, supplemented by a modest tax-varying power. These provisions have been criticised for creating a relationship with the UK government of fiscal dependency, with limited autonomy and accountability, and a potential for creating a constitutional conflict over spending. That said, it should be acknowledged that the Scottish arrangements are similar to those pertaining in the regional government systems in Europe, in which the main source of funding is a block grant, and tax powers are minimal.
Within the UK Government, the key principle in the public finances is the allocation of resources on the basis of relative needs, with the objective of setting broadly similar standards of public service throughout the UK, irrespective of fiscal contributions to the Exchequer. Additional Scottish needs have been recognised both within resource formulae and in political allocations for most of the last century. This approach to governance has been termed territorial politics, whereby Scottish ministers and civil servants sought to argue the Scottish case for resources within the unitary state, usually with considerable success.
There has been a growing differential between Scotland and the UK average since 1945, which rose to around 14 per cent above in the 1950s, and upwards to 26% above in 1969-70, before falling under the Heath Government. It remained around 20% higher in the 1970s (1). These comparisons
relate to what is termed 'identifiable public expenditure', which can be identified as having been incurred in a particular country. During this period the Scottish Office bargained over its individual programmes with the Treasury in the conventional way. The result was that significant increases in public expenditure were negotiated for Scotland in the context of an active regional policy. It was during this period also that the principle of treating the Scottish totals as a block, which can be adjusted at the margins, was established. This led one observer to conclude that:
" the system of building up a total of Scottish expenditure by reference to Scottish expenditure by reference to Scottish needs in particular areas has produced higher per capita public expenditure in Scotland in almost every category of public expenditure." (2)
McCrone regards this as a reflection of the "powerful advocacy of successive Secretaries of State when presenting Scotland's case". The success of this approach became transparent during the devolution debates of the 1970s, and led to greater political attention being paid to Scottish spending levels, partly by Labour MPs in Northern England concerned at the Scottish 'advantage', and partly by Conservative MPs hostile to devolution. That Scotland has higher expenditure needs than the UK as a whole has generally been accepted by both major parties, but the scale of those higher needs has not been determined with any precision. This is an issue we shall return to later.
After 1978, British Governments used a formulaic approach to determining territorial expenditure, in which Scottish totals were calculated by apportioning its share of the increases/decreases bargained by English departments, in comparable spending programmes. The expenditure baseline was carried forward from the previous year, and the increase determined by Scotland's share of the British population, using a ratio of 85:10:5, for England, Scotland and Wales. This gave Scotland
10/85 of any increase from England. One recent review regarded this system as offering three advantages for Scotland, in that it protected the existing advantages, avoided the need for detailed negotiations, and retained the power to reallocate resources. (3)
More recently, however, the arrangements have been criticised by a number of economists for creating a situation whereby there will be a gradual convergence of public expenditure per capita across the UK, and that this is inequitable given Scotland's higher expenditure needs, on grounds of poverty, poor health and sparsity. Such critics point to the implications of the mathematics underlying the Bamett formula causing very real problems for the devolved Parliament.
The difficulty is that the credibility of the Parliament with the electorate relies on its ability to deliver effective public services. But the Barnett squeeze implies that even if these services are growing in real terms, they will not be growing as rapidly in Scotland as they will in England and Wales" (5).
Predictions of such convergence have been made for over twenty years, but there is very little evidence of it occurring in practice, because of the capacity of politicians to take decisions which
'bypass' the formula, and because of the offsetting effect of Scotland's relative population decline (6). However, the critics argue that the administrative reforms to the system instituted in 1992 tighten up the Treasury's controls over such factors, and predict that Barnett will bite much harder in future (7).
My view is that this is an unduly mechanistic interpretation of a political process. I do not deny that the Barnett formula is an important element of the funding arrangements, but it is not the only element, and in a system of incremental budgeting, political acceptability is the key test in resource allocation. Formulae which do not deliver acceptable outcomes will be tweaked, supplemented or reformed if necessary to provide outcomes that politicians can live with.
In this paper, my objective is to examine the empirical evidence of the impact of the formula on expenditure outcomes since 1992. There have been number of studies on the impact of the formula over the period 1979-92, which show Scotland continuing to receive expenditure allocations on a range from some 14% to 24% above the UK average. Moreover, such studies show no consistent trend, other than Scotland's spending differential remaining higher (8). The empirical analysis falls into two parts. Firstly, I examine expenditure outcomes using outturn data from 1992-1997. Secondly, I consider expenditure plans from 1997-2003. It is necessary, however, to put the study in context, by a systematic exposition of the development of the formula and the arguments of its critics.
THE FORMULA AND ITS CRITICS
The use of the formula for resource allocation to Scotland began in 1978, and is the mechanism by which changes in public expenditure in England are apportioned to Scotland and Wales (9). It has been argued that it was introduced as a transitional mechanism pending the development of a robust needs-based approach, but it has remained in operation since then, with only minor adjustments in 1992. (10) Its operation appears deceptively simple, in that the formula, "provided that, in settling new plans for public expenditure, Scotland and Wales should receive a share of the planned cash changes in provision for equivalent public services in England which is proportionate to their population. In other words, Scotland and Wales' share of changes in relevant expenditure are the same proportions as their populations represent of England's population. The formula applies only to changes in spending plans not to the underlying baselines which remain unaffected". (11)
The effect of this system was to greatly reduce the need for annual budgetary negotiations between the Scottish Office and the Treasury, the system which applied between 1958 and 1978, and which continues to determine departmental totals in England. Twigger and Dyson observed three advantages of this approach to the Scottish Office:
1. "the operation of the formula protects (to a large extent) the existing situation where spending per head is above the national average.
2. There is no need for the department to argue the case for equal treatment on each occasion that a relevant programme in England receives increased funding.
3. The Secretary of State retains the freedom to allocate the block between programmes" (12)
The mechanics of this system were not wholly straightforward. Firstly, it only applied to the Scottish Block, which concerned around 96% of the Scottish budget. Non-block expenditure was allocated through the conventional incremental bidding model. Secondly, not all expenditure within services in the block is "comparable".
Thirdly, there were expenditure functions within the Scottish Block which have no English counterpart, requiring negotiated allocations, as occurred at water privatisation (14).
It is important, at this stage to clarify certain misconceptions about the block and formula arrangements. Firstly, the formula is not a needs assessment model per se, although population is a key determinant of expenditure, and the system delivers higher percentage increases to those with growing populations. However, the totals reflect the cumulative outcomes of Treasury/departmental bargaining over expenditure needs in the general sense. Therefore, in establishing a formulaic approach based on population, "The Treasury accepted that the current balance of spending between the UK and the territories identified in the review was sufficient to justify entrenching through introducing a population formula rather than some other kind" (15)
In short, the settlement recognised that Scotland did have higher expenditure needs than the UK average, and whilst this could not be assessed with precision, the differentials were acceptable.
Secondly, it should now be clear that the formula does not distribute resources throughout the UK, as the media often report. Rather it allocates funding to the devolved governments. Much of the criticism of imbalances of needs and resources comes from regions within England, where no comparable administrative structures exist Barnett is a formula which applies to the devolved governments, not English departments, whose allocations remain negotiated directly with the Treasury.
Thirdly, Barnett does not determine the overall size of the block, but only the share of changes. Baseline expenditure is the dominant element of the new block allocation to Scotland.
Fourthly, it is not a mechanism for delivering full convergence - i.e. equal spending per capita across the UK. Convergence is not government policy, and never has been. Convergence only occurs in certain condition such as expenditure growth within the block, population stability and the absence of offsetting decisions outwith the formula. The Treasury identified four factors, which continue to affect the expenditure relativities. These are:
1. The rate of increase/decrease in cash in equivalent English spending programmes. 2. Changes in population relativities which are
not reflected in the underlying expenditure baselines
3. Changes in relative public spending per head on programmes outwith the block
4. Changes made in year to provision for the block allocations (16).
As previous research has shown, all these factors have been important in offsetting any trend to convergence in Scottish budgets in the past Analysis of Scottish expenditure which concentrates wholly on the formulaic element invites misleading conclusions. In practice, there is considerable 'give and take' between Scottish officials and the Treasury. The underlying assumption that Scotland has higher needs remains. Scottish officials regard the approach as advantageous even if some modest degree of convergence were to occur. Former Scottish Secretary Ian Lang, in agreeing to the changes introduced in 1992, observed that "as part of the agreement to make the change it was recognised that spending needs in Scotland were higher and that convergence would not fall below that relatively higher spending need." (17) That view has been reaffirmed by the Labour Government, which sees the system as providing fair settlements for Scotland.
The administrative changes introduced in 1992 were important ones. Firstly the Scottish share of increases had remained based on its population relativity as it applied in 1976, and despite the continuing decline in Scotland's share of the UK population, Scotland continued to receive 10/85ths of any increase/decrease. This was adjusted in 1992 to reflect the 1991 census, and is now recalculated annually. In 1976 Scotland had 11.76% of the English, Scottish and Welsh populations (separate arrangements applied to Northern Ireland). In 1992, it had fallen to 10.66% and is currently at 10.32%. It will continue to fall.
Economists interpretation of these changes are uniform. McGregor, Stevens, Swales and Yin argue that these "should promote faster convergence" (21); Cuthbert argues that "the Barnett formula now has teeth in a way that it did not have originally" (22);
Kay argues that this will result in "a major change in Scotland's relative share of public spending over a very short period" (23) and McCrone sees" the straight application of the Barnett Formula bringing gradual but painful convergence" (24).
The main policy response suggested is for a new needs assessment study. The Scottish Council Foundation did so as a means of protecting the devolution settlement, for
otherwise:-"Revising a formula may well fall in the future to a government at Westminster which is hostile to devolution and resentful of Scotland's share of public expenditure. Such a government may be tempted to cut the Scottish grant below the level of need perhaps to per capita levels" (25).
Similar views were expressed by Heald and Geaughan, who see a new needs assessment study as "both inevitable and proper" (26) and by McCrone, as the only means of providing "a rational basis" for spending differentials (27). Moreover, there is a further argument that such a review would lead to a reduction in Scottish spending. Heald and Geughan question "whether the 16% differential revealed in 1996-97 (in a Treasury study) will hold up in full" (28); Cuthbert argues that "the view that all of Scotland's current level of spending can be justified on grounds of relative need is also likely to be unsustainable" (29); whilst McCrone believes it would have unpalatable results which require a strategy "for bringing expenditure into line with justified need at a pace than can be tolerated (30). In the context of devolution, McCormick and Alexander (the latter now a Labour Minister in the Executive) argued that a new needs assessment is "inevitable" in the long run.
"In the early years, the Block allocation can be expected to grow in line with Labour's national commitment to fairer taxation and the closure of tax loopholes. However, the opportunities for spending in Scotland will eventually be influenced by the outcomes of adjusting Scottish expenditures in line with a new needs assessment" (31).
This disappointing feature of these two orthodoxies on convergence and needs assessment is the extent to which such judgements have been reached on the basis of limited evidence. Research to assess convergence trends has only revealed the degree of convergence anticipated by the critics (32).
Likewise the argument that Scotland is "over-funded" is offered in the absence of evidence, apart from the "heavily qualified" Treasury study of 1979 (33).
The political response from regions which see themselves as disadvantaged has been to support demands to replace the existing demographic approach with a needs-based formula. Again, there have been few expositions as to how this would be carried out in practice. The problems of needs assessment reported in Heald's (1979) major study of devolution finance remain, and we shall consider these later. The nationalist response has been to argue that Scotland is in fiscal surplus, and the answer lies in "full fiscal autonomy" whereby the Scottish Parliament would raise all its taxes and make a contribution to UK services (34). The SNP's fiscal arithmetic has been challenged by most academic analysts (35), and remains a dubious proposition under devolution.
Pressure for change within the UK remains, however. The Treasury Committee reported in favour of review in 1997, shortly after the devolution referendum in favour of the Government's proposals, and argued for the Government to bring the needs assessment up to date (36). London mayoral candidates argued for such a review in the 2000 election, and the Liberal leader, Charles Kennedy has recently supported the case for a needs based assessment throughout the UK. The Treasury Committee is to reconsider the matter in 2000-2001, with one protagonist arguing that the speed of convergence is inadequate (37). It is important therefore that some consideration of the existing evidence is undertaken. In the remainder of this paper, I offer a start to this process, presenting and assessing evidence on expenditure, and on needs indicators, in the public domain.
see whether the formula impacts on spending as a whole, rather than simply the increases in the block element. To assess the convergence effect systematically requires analysis of all elements of public spending.
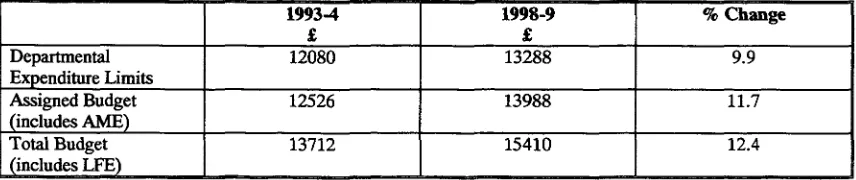
The Labour Government has reformed the expenditure framework since coming to power. It now distinguishes analytically between departmental expenditure limits (to which the formula applies); annually managed expenditure (which are negotiated each year with the Treasury); and locally financed expenditure (in effect the projected income from property taxes). This data is available from 1993-4 in the government's planning documents. In the five-year period from 1993-4, there were much greater increases in the non-formulaic elements, which worked to offset any convergence trend in the block (DEL).
Convergence refers to per capita expenditure. To assess this effect we have used the Public Expenditure Statistical Analyses published annually by HM Treasury. This is the approach used by Gavin McCrone (38). Because this series ends in 1997-98 we have utilised the period 1992-93 to 1997-98. Identifiable expenditure remained 18% above the UK average over this period, and social security spending also remained stable at 8% above. We concentrate below on spending on public services, but unlike McCrone, we have retained spending on agriculture, fisheries, food and forestry in the calculation, as this constitutes devolved expenditure. The results are illustrated below (Tables 2, 3 and 4). Whereas identifiable expenditure on public services grew by 1.3% less than the UK average over the period in budget terms, it grew by 0.3% more in per capita terms (Table 2). In short, no convergence took place in a period of public expenditure growth, when according to the theory of the Barnett formula critics, it should have. What is even more striking about those outturn figures is the high degree of stability. The relative shares of identifiable expenditure remained the same throughout the five year period for all four nations of the UK, with England receiving 80%, Scotland 10%, Northern Ireland 6% and Wales 4%. Not surprisingly, there was also a high degree of stability in the spending differentials, using the UK as an index of 100 (Table 3).
In the Scottish case the outcomes reflect the growth in agriculture, fisheries and food programme from 1996-7 (which is outwith Barnett) and the growth in the social security differential in 1997-8. This confirms our argument that non-formulaic spending programmes influence the convergence effect (as can population decline). This is illustrated in Table 4, which reveals a fairly consistent pattern cross the block programmes (i.e excluding social
security and agriculture) with the exception of other environmental services which is complicated by the non-privatisation of water and sewerage in Scotland. These changes in programme differentials of course reflect changes in the spending programmes of all four nations of the UK
What do these results mean for the predicted Barnett squeeze on convergence in future? The problem is that for the years since 1997-8 we can only utilise the Departmental Expenditure Limits, which account for only 86% of the Scottish budget Spending Review 2000 shows that Scotland's Departmental Expenditure limit will grow by 8% per annum, from £13120m in 1998-9 to £16230m in 2001-2. In terms of public spending, there is clearly no spending squeeze. Scottish critics argue that the Spending Review is unfair as it gives Scotland a lower percentage increase. In any resource allocation formula, population is the major driver of expenditure need (38), so with Scotland's relative share of the UK population in decline by 0.4% per annum, a lower percentage increase is to be expected (Indeed, differential percentage increases are the norm for local authorities and health boards, and taken for granted). Over the three-year period, the Scottish share will fall from 7.7% to 7.5%. This fall is modest and will be partially offset in per capita terms by population trends, and further influenced by the non-formulaic elements of the Scottish budget. In short, predictions of convergence because of the Bamett effect are dubious, because they cannot take account of the offsetting factors.
Any change in the per capita spending differential relative to the UK is likely to be modest, and will not cause problems of financial management, in the context of real spending growth of around 5% per annum. Any Barnett effect will be more of a "tickle" than a "squeeze". The modest degree of convergence is, however, criticised from elsewhere in the UK as Scotland is perceived to be overfunded. Indeed, Lord Barnett himself recently told the Treasury Committee that "Scotland gets far more than it should" because the formula is not needs based. This requires investigation.
confines itself to identifiable expenditure on services within the block. The spending data includes a small amount of spending by UK departments (less than 4%) so this should not affect the trend. Over the five year period, Scottish spending within the block fell by 2% relative to the UK as a" whole. As we saw earlier, however, significant increase in the non-block elements of the Scottish budget worked to offset the convergence Bamett, leaving the Scottish position unchanged overall. Under New Labour's spending plans, significant real term's growth will be the pattern from 1998-99, after three years of real reductions since 1994-5. That should result in a stronger convergence trend within the block, but whether or not this will result in convergence in the total budget will depend on the outcomes of non-formulaic decisions.
When the degree of convergence was discussed at the Treasury Committee in July, Jim Cousin's MP argued that Barnett does not deliver convergence at all. The reality is, that in certain conditions, the application of the formula will result in convergence, but in other conditions it may not. Some MPs (and Lord Barnett) appear to believe that a change to a needs-based formula would inevitably result in Scotland receiving less. Such critics have pointed to Scotland's progress in terms of GDP per capita and average income levels since 1979. These are misleading indicators of spending needs. Of course, Scotland's score on both these indicators has been influenced by oil, but these are not measures which would be used in any of the public service programmes to which Barnett applies. We can explore this further.
In the most recent year for which data is available, Scotland received public expenditure per capita of £4722, compared with a UK average of £4051, an excess of £721. However, we would require to discount the sums arising from agriculture, fisheries, food and forestry (much of which is driven by EC decisions) and social security (which is demand led) as neither of these programmes are within the Block. Together those count for £218 of the Scottish excess. This reduces the amount accrued by Barnett to £503 per capita. If the Scottish Block was funded at the same level as the rest of the UK, it would lose £2.6 billions to the rest of the UK. However, this is clearly implausible, given Scotland's higher needs.
The existence of factors contributing to higher expenditure needs was acknowledged in Treasury's evidence to the Treasury Committee's review of the Barnett Formula. These included greater levels of sparsity, poverty and poor health. The undertaking of a new needs assessment study is a major task, which must be completed by Government as the only institution having the capacity to generate the
necessary data. My own position has been to argue that a new needs assessment would face considerable technical difficulties, in that the more sophisticated statistical models of need which are now in use for distributing resources to health authorities and local government could not be utilised in this case. There are too few data points for statistical reliability, the methods are replete with problems of interpretation, and the dependent variables used (expenditure and usage) are inappropriate in the absence of a common statutory and funding framework, and the means to adequately control the effect of political decisions on resource allocation (39).
Empirical methods have the advantage of deriving weightings for some factors mathematically on the basis of regression techniques. Normative methods, which are also in use, determine such weightings on the basis of judgement. Whilst evidence may underpin those judgements, - and both empirical and normative approaches require interpretation and judgement, - the scope for argument remains substantial. A new needs assessment will not provide definitive objective answers to questions of resource distribution. The word 'assessment' is more appropriate than 'measurement'. This problem was noted in the 1975 White Paper on Scottish devolution, and its observations remain sound today.
"No neat formula could be devised to produce fair shares for Scotland in varying circumstances from year to year. The task involves judgements of great complexity and political sensitivity. Nevertheless, objective information on standards and needs would help the Scottish administration, the Government and Parliament to make their judgements." (40)
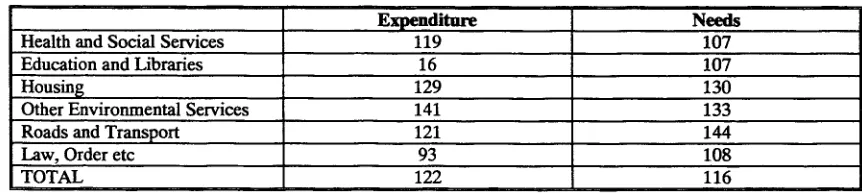
Assessment of need is part of the language of resource allocation. It need not imply a formulaic approach, although it is often interpreted in this way. The Treasury needs assessment study of 1979 provided a benchmark to assist those judgements, but it did not provide the basis for resource allocation, which requires consideration of existing commitments and the scope for change. As noted earlier, the decision to entrench the existing spending differentials in the Bamett Formula in 1978 was recognition that in broad terms, the differences in expenditure were reflective of need, and that the needs assessment study was not 'exhaustive'. That study concluded that Scottish expenditure was some 6% greater than its needs, and 22% greater than England (See Table 5), a relative position which, as we have shown, pertains today. (41)
population, numbers of school children or unemployed, or infrastructure provision such as road mileage and public housing, which were the major determinant of expenditure need in particular programmes, and a range of secondary factors, such as demographic structure (age and sex), poverty, sparsity and climactic conditions which placed additional needs/costs on public authorities. We would need access to a comparable body of research information to begin to make assessments about the relative weights to be applied to such factors today.
However, my purpose is more limited. It is simply to demonstrate that, on the basis of the key indicators available in the public domain, it is clear that Scotland (and Wales and Northern Ireland) continues to have expenditure needs above the UK average, and that it is premature to assume that any needs assessment study would inevitably result in reduced allocations to Scotland.
According to the recent Cabinet Office report, Scotland has levels of GDP which are 92-96% of the UK average; unemployment 11% above the UK average; housing benefit levels 30% above the UK level and poor health which is 15% above the UK level. (42) From other sources, we know that social security expenditure is 8% above the UK level (43); public housing is 70% above the UK level; road mileage is 54% above the UK norm; and Scotland has a level of sparsity which is four times the UK average. That is reflected in smaller schools (the Treasury study assessed the cost of educating rural pupils as 8% above the average); smaller list sizes for GPs and special allowances to compensate; longer stays in hospital for rural patients; and Scotland's share of the rural population is about 30% compared with 8.7% of the total UK population.
If we examine the degree of excess in the service programmes within the block, then the questionable nature of the overfunding assumption becomes clearer. The biggest percentage excess (see Table 7) is in trade, industry, energy and employment, which was determined on a UK basis until 1993. The higher spending on roads and housing does not appear extreme given the higher incidence of road mileage and public housing, indeed, needs may be greater, and law and order and other environmental services are insignificant. The two significant differences in cash terms are education and health. Of these, the education spending differential raises the most doubts, although consideration needs to be given to the high level of incoming students to the universities, as Scotland has nearly 12% of students with around 9% of the population. The high levels of poor health and additional sparsity costs, and the need to discount some element of teaching hospital
costs (which involve UK-wide benefits) suggest the health differential may be defensible. (44)
A review of the Barnett formula arrangements at this stage is not yet on the Government's agenda, and the case for such a review is not yet convincing. To claim for the North East, for example, on the basis of a comparison of GDP figures only, that "on any fresh needs assessment public spending per head would be above Scotland's" (45) is a gross distortion, and a judgement wholly lacking in balance. In any case, a review within the present structure of government can only consider the method of allocating funds to the devolved administrations, not the English regions, whose resources are determined by a number of departments and allocated directly to spending agencies. If there are problems of resource allocation within England, these are a matter for the relevant Ministers, and will not be tackled by revising the funding arrangements for devolution. Advocates of reform need to provide more convincing research evidence than simple GDP per head comparisons.
CONCLUSIONS
The rationale for extending the financial arrangements for administrative devolution to the new political institutions is clear. This would provide the continuity and stability necessary for the transition to devolved government. The pattern of spending inherited by the Scottish Parliament both reflects higher needs, provides the resources to meet inherited commitments, and, through allocations at the margins, reflects Scotland's declining population share by funding slower growth than for the UK as a whole.
This preliminary assessment suggests it would be premature to review these arrangements at this time. On the key indicators, Scotland continues to require expenditure levels above the UK average, although the extent of that higher need cannot be determined with precision. Secondly, it is also premature to assume that any such review must result in a redistribution of resources away from Scotland.
Finally, the benefits of the arrangements in terms of financial management should be acknowledged. In government budgets, inherited commitments confine the scope for change to choices at the margins. The devolution arrangements have institutionalised incremental change, bringing stability to allocations, and avoiding the requirement to apply safety nets to limit financial change through the greater turbulence which arises in needs-based systems such as the Scottish Health Authorities Resource Equalisation model (SHARE) or the Revenue Support Grant (RSG) for local authorities. These are valuable properties of the present system which should not be discarded lightly, given the limits to needs assessment. As the Scottish Finance Minister wrote recently "it would be all too easy to conclude from this that measuring relative need is too difficult and should never be done. I do not subscribe to that, however. What I do say is that nobody should underestimate the difficult and complexity of such an exercise. A more limited study which took place in the 1970s took over two years to complete and was unable to present definitive figures for relative need, but rather presented ranges within which these needs might fall.
It is important to realise also that any such study is never going to produce anything resembling a definitive answer. The best outcome is only ever going to be information; information which can then provide a basis for subsequent debate and ultimately political decision. (46)
I agree with this view. The Government rightly moved away from the instability of a model based on assigned revenues to the present assigned budget based on the baseline expenditures, formulaic adjustments, and negotiated annual decisions. Finally, it must be recognised by advocates of change that this issue is no longer a matter within the preserve of the UK Government. The 1997 White Paper recognised this by acknowledging that "any more substantial revisions would need to be preceded by an in-depth study of relative spending requirements and would be subject to full consultation between the Scottish Executive and the UK Govemment.(47)
In any such exercise, a robust and persuasive case that Scotland continues to have higher expenditure needs can be made. Since 1979, there has been much faster growth of private consumption of health, education and housing in England in contrast with Scotland. The differences of sparsity, poverty, unemployment, poor health and climate which influence spending in Scotland remain significant. A convincing case for a review of Barnett has not yet been made.
REFERENCES
1. R Parry (1983) "Public Expenditure in Scotland", in D McCrone (Ed) The Scottish Government Yearbook 1983 (Edinburgh: Unit for the Study of Government in Scotland).
2. G McCrone (1999) "Scotland's Public Finances from Goshen to Barnett", Quarterly Economic Commentary Vol 24, No 2, pp 30-45.
3. R Twigger and J Dyson (1997) "Public Expenditure in Scotland and Wales" House of Commons Library Research Paper 97/98, London, 9 June.
4. M Keating (1985) "Bureaucracy Devolved", in Times Educational Supplement, 5 April.
5. S Dow and D Bell (2000) "The financial powers of the Scottish Parliament", in G Hassan and C Warhurst (Eds) The New Scottish Politics (Norwich: The Stationery Office), p 94.
6. D Heald (1994) "Territorial public expenditure in the United Kingdom", Public Administration Vol 72, Summer, pp 147-175.
7. G McCrone (1999) op cit.
8. R Parry, op cit.
9. M McVicar (2000) "The Barnett Formula", Scottish Parliament Information Centre Research, Note 0/31, 4 May.
10. L Barnett (2000) 'How a temporary expedient became permanent", New Economy Vol 7, Issue No 2, pp 69-71.
11. HM Treasury (1999) Statement of Funding Policy, London, March, p 36.
12. Twigger and Dyson op cit.
13. HM Treasury op cit, p 9,
14. 14,See Ian Lang's evidence to the Scottish Affairs Committee, House of Commons Minutes of Evidence, 21 April 1993.
16. HM Treasury (1997) Supplementary Memorandum in the Second Report of the Treasury Committee, "The Barnett Formula", (London : The Stationery Office) pp 36-39.
17. Ian Lang (1993) op cit p 1.
18. D Heald (1994) op cit.
19. HM Treasury (1997) op cit, supplementary memorandum, p 39.
20. HM Treasury ibid.
21. P McGregor, J Stevens, K Swales and Y Yin (1997), "The economics of the 'tartan tax'", Quarterly Economic Commentary, Vol 22,
22. J Cuthbert (1998), "The Implications of the Bamett Formula", Saltire Paper No. 1, The Scottish National Party, Edinburgh.
23. N Kay (1998) "The Scottish Parliament and the Barnett Formula", Quarterly Economic Commentary, December, p 37.
24. G McCrone (1999) op cit, p 40.
25. Scottish Council Foundation (1997) "Scotland's Parliament: A Business Guide to Devolution" (Edinburgh: SCF).
26. D Heald and N Geaughan (1996) "Financing a Scottish Parliament" in S Tindale (Ed) The State and the Nations - The Politics of Devolution (London: IPPR) pp 167-184.
27. G McCrone (1999) op cit, p 35.
28. D Heald and N Geaughan (1996) op cit.
29. J Cuthbert (1998) op cit, p 8.
30. G McCrone (1999) op cit, p 41.
31. J McCormick and W Alexander (1996) "Firm Foundations: Securing the Scottish Parliament" in S Tindale, (ed), op cit.
32. D Heald (1994) op cit.
33. HM Treasury (1979) Needs Assessment Study (Report) London : HM Treasury.
34. D Fraser (2000) "Reid denies Holyrood new powers", Sunday Herald, 6 August
35. See B Ashcroft (1999) "Are the Nationalists Being Economical with the Truth?", Sunday Herald, 2 May; and G McCrone (1999) op cit.
36. Treasury Committee Second Report (1997) op cit.
37. G McCrone (1998) op cit.
38. See oral evidence of HM Treasury (1997), op cit.
39. For a discussion of these problems, see A Midwinter (1997) "The Bamett Formula and Scotland's Public Expenditure Needs", Memorandum of Evidence, Treasury Committee Second Report, pp 29 - 32.
40. Quoted in D Heald (1980), Financing Devolution Within the United Kingdom, Research Monograph No.32, Australian National University, Canberra.
41. HM Treasury (1979) op cit.
42. Cabinet Office (1999).
43. See Regional Trends 1999.
44. See the report of the Arbuthnott Committee on such costs, "Fair Shares for All", Scottish Executive 1999.
45. I McLean (2000) "Can (or should) the Bamett Formula Survive?" New Economy, Vol 7, Issue 2, p 77.
46. J McConnell (2000) "Funding Devolution: Why Barnett remains better than the alternatives", New Economy Vol 7, Issue 2, p 67.
TABLE 1 DEVOLVED EXPENDITURE Departmental Expenditure Limits Assigned Budget (includes AME) Total Budget (includes LFE) 1993-4 £ 12080 12526 13712 1998-9 £ 13288 13988 15410 % Change 9.9 11.7 12.4
[image:10.521.49.484.261.344.2]Source: Spending Plans for Scotland
TABLE 2 IDENTIFIABLE EXPENDITURE ON PUBUC SERVICES
Scotland UK Scotland UK 1992-3 £bn 13429 122548 £ per capita
2627 2112 1997-8 £bn 15396 142987 £ per capita
3006 2408 % Change 14.6 15.9 14.4 14.1
[image:10.521.57.484.414.476.2]Source: HMTreasury 2000
TABLE 3 EXPENDITURE DDJFERENTIALS SINCE 1992-3
England Scotland Wales N.Ireland
92-3
96 _ J 118 94 134 93-4 96 119 114 134 94-5 96 120 114 133 95-6 96 120 114 133 96-7 96 119 114 135 97-8 96 118 113 135
[image:10.521.51.484.547.699.2]Source: Public Expenditure Statistical Analyses (HM Treasury
TABLE 4 SCOTTISH IDENTDJTABLE EXPENDITURE DIFFERENTIALS SINCE 1992-3 (UK = 100)
Agriculture, fisheries, food and forestry Trade, industry, energy, employment and training
Transport Housing
Other environmental services Law, order and protective services Education
Culture, media and sport
Health and personal social services Social security TOTAL 1992-3 187 139 117 119 133 95 129 109 122 108 118 1993-4 171 145 123 142 141 94 131 123 123 106 119 1994-5 177 155 128 146 140 92 129
L 126
126 106 119 1995-6 176 161 120 171 134 94 132 118 122 106 120 1996-7 243 160 121 171 98 96 127 119 122 106 118 1997-8 239 168 115 153 106 97 125 122 121 108
118 1
TABLE 5 NEEDS ASSESSMENT BY PROGRAMME 1976-7 (ENGLAND = 100)
Health and Social Services Education and Libraries Housing
Other Environmental Services Roads and Transport
Law, Order etc TOTAL
Expenditure 119
16 129 141 121 93 122
Needs 107 107 130 133 144 108 116
[image:11.522.58.483.249.345.2]Source: HM Treasury 1979
TABLE 6 SCOTTISH EXPENDITURE PER CAPITA SINCE 1992-3 Year
1992-3 1993-4 1994-5 1995-6 1996-7 1997-8
Scotland £ 2,497 2,621 2,787 2,875 2,805 2,811
UK £ 2,054 2,096 2,231 2,284 2,304 2,344
Index 122 125 125 126 122 120
TABLE 7 PROGRAMME EXPENDITURE RELATIVE TO UK AVERAGE 1997-8
Trade, Industry Energy and Employment Roads and Transport
Housing
Other Environmental Services Law, Order and Protection Services Education
Culture, Media and Sport
Health and Personal Social Services
£ per capita 72 22 33 10 -10 154 10 186
[image:11.522.59.483.396.500.2]