Int. J. Electrochem. Sci., 14 (2019) 10043 – 10057, doi: 10.20964/2019.11.20
International Journal of
ELECTROCHEMICAL
SCIENCE
www.electrochemsci.org
Simultaneous Electrochemical Determination of Hydroquinone
and Catechol Using a Carboxylated
Graphene/Poly-L-asparagine Modified Electrode
Yanrong Lu, Riya Jin*, Yina Qiao, Jingmin Liu, Xiaojian Wang, Kun Wang, Chaoqi Wang
School of Environment and Safety Engineering, North University of China, Taiyuan 030051, China
*E-mail: [email protected]
Received: 2 June 2019 / Accepted: 9 August 2019 / Published: 7 October 2019
In this study, a novel electrochemical sensor was developed by modifying carboxylated graphene/poly-L-asparagine (CG/poly-L-Asn) on glassy carbon electrode (GCE) using a combination of electropolymerization and adsorption methods. The electrochemical catalytic activity of hydroquinone (HQ) and catechol (CC) was studied by cyclic voltammetry and differential pulse voltammetry. Under the optimized conditions, the peak potential difference between HQ and CC is 108 mV. This indicates the electrochemical sensor has anti-interference ability, and it can simultaneously detect these compounds. The limit of detection (S/N = 3) for HQ and CC is 0.0750 μM and 0.1362 μM, respectively. The results show that the prepared CG/poly-L-Asn/GCE has good repeatability and sensitivity, and the proposed sensor can be prepared using a simple method with a low cost.
Keywords: Electropolymerization; Cyclic voltammetry; Differential pulse voltammetry; Hydroquinone; Catechol
1. INTRODUCTION
spectroscopy[8], chemiluminescence spectroscopy[9], and flow injection analysis[10,11]. However, the chromatographic methods are more complex. Before the signal detection, the sample should be pretreated and separated. At the same time, a large amount of organic solvent is needed to prepare the mobile phase, causing pollution. Spectroscopic methods are similar to chromatographic methods, requiring large instruments. The resulting spectra are complex and should be analyzed in detail. Compared with the above methods, the electrochemical method has the following advantages: simple operation, low cost, rapid detection, sensitive, can be easily miniaturized, and the samples can be analyzed online in real time. Thus, the electrochemical method has a strong application prospect. HQ and CC often coexist in environmental samples. Because of their similar structure and properties[1,12], there are many challenges for the simultaneous determination of HQ and CC using electrochemical methods. For example, their volt-ampere peaks are very wide and overlap each other at ordinary electrode[2,13,14]. In addition, CC and HQ interfere with each other at the time of simultaneous determination, making their individual identification very difficult[15]. The competition between oxidation and adsorption at the electrode surface makes the relationship between voltammetric response and concentration nonlinear[13,16].
To simultaneously determine the isomers of dihydroxybenzene, many materials have been used to modify the electrode. Graphene is a new carbonaceous material composed of a two-dimensional honeycomb lattice structure[17,18]. Graphene has many advantages such as good electron transport performance, large specific surface area, high electrocatalytic activity, good chemical stability, and easy modification[19]. At present, the development and construction of new highly sensitive and highly selective modified electrodes and sensors using graphene’s unique electrochemical properties have become a hot topic of current research.
In this study, carboxylated graphene/poly-L-asparagine (CG/poly-L-Asn) was modified on the surface of glassy carbon electrode (GCE); this further improved the selectivity and sensitivity of electrode and enabled the simultaneous determination of HQ and CC. This is because an electrode modified with a polymer film has many advantages such as a high concentration of active groups, uniform film formation, easy control of thickness, good stability, high selectivity, and strong adhesion to the electrode surface. Therefore, this has been widely studied in the past few years.
In this study, a CG/poly-L-Asn modified electrode was prepared. The presence of HQ and CC in a binary mixture was determined by cyclic voltammetry (CV) and differential pulse voltammetry (DPV). Compared with an ordinary electrode, the modified GCE shows excellent performance and can separate the volt-ampere signals of HQ and CC in the binary mixture. This study reports the sensitivity, selectivity, and stability of CG/poly-L-Asn/GCE for the simultaneous determination of HQ and CC. Thus, this study provides a new idea for the determination of phenolic isomers.
2. EXPERIMENTAL
2.1. Reagents and Instruments
Shanghai Chenhua Instrument Company); three-electrode system: GCE, platinum electrode, and saturated calomel electrode (SCE); freeze dryer; Fourier transform infrared spectrometer (VERTEX 80, Bruker Corporation).
2.2. Preparation of CG
To obtain a uniform suspension of GO in water, 3 mg GO was dispersed in 300 mL water and sonicated for 1 h in a water bath. Then, 18 g of sodium hydroxide was added to the GO suspension and sonicated for 3 h. Then, 15 g chloroacetic acid was added, and the mixture was sonicated for 3 h, converting the hydroxyl and epoxy groups on the surface of GO to carboxyl groups. The CG thus prepared was collected by suction filtration and then washed to neutral pH with ultrapure water; finally, the obtained CG was freeze-dried for 12 h in a vacuum freeze dryer and stored in a vacuum box.
2.3. Preparation of the CG/poly-L-Asn/GCE
The GCE was polished on a polishing pad using alumina powder with a particle size of 0.05 μm until the mirror surface was smooth and washed with ultrapure water. The GCE was then ultrasonically washed with absolute ethanol and ultrapure water for 5 min and finally dried under nitrogen atmosphere. Then, 5 mg of CG was dispersed in 5 mL of aqueous solution and kept in an ultrasonic bath for 20 min to obtain a homogeneous suspension. 10 μL of the suspension was taken with a pipette and placed on the surface of GCE, and the suspension was allowed to dry at room temperature to obtain the CG/GCE. L-Asn was polymerized on the CG/GCE surface by CV. Between the potential windows of –0.6 to 1.6 V, the CG/GCE was scanned for 10 cycles in 0.1 M PBS (pH = 6.8) containing 2.5×10⁻³ M L-Asn at a
scan rate of 140 mV/s. Then, the prepared CG/poly-L-Asn/GCE was thoroughly washed with ultrapure water and used to determine HQ and CC in a binary mixture.
3. RESULTS AND DISCUSSION
[image:3.596.184.410.563.736.2]3.1. Infrared spectrum of GO and CG
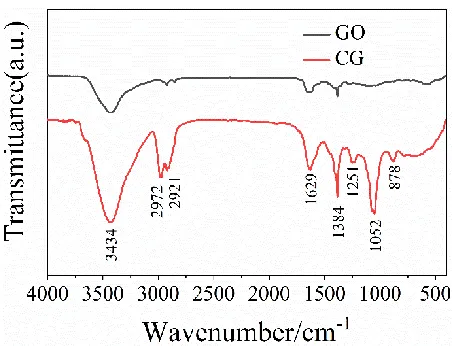
Figure 1 shows a strong absorption peak at 3434 cm−1 owing to O–H stretching vibration. The
relatively weak absorption peak at 2921 cm−1 can be attributed to C–H stretching vibration. The
relatively strong absorption peak at 1629 cm−1 can be assigned to C=O stretching vibration. The
relatively strong absorption peak at 1384 cm−1 can be attributed to O–H bending vibration. The weak
absorption peak at 1251 cm−1 can be assigned to C–O–C stretching vibration. The strong absorption peak
at 1052 cm−1 can be attributed to C–O stretching vibration. The weak absorption peak at 878 cm−1 can
be assigned to C–O–C bending vibration[20]. After the carboxylation of GO, the absorption peak strength of C=O and O–H significantly enhanced, indicating that GO was carboxylated.
[image:4.596.139.459.258.505.2]3.2. Electrochemical behavior of CG/poly-L-Asn/GCE
Figure 2. Cyclic voltammograms of different working electrodes in 5.0 mM [Fe(CN)6]3-/4- containing
0.1 M KCl. (a) GCE, (b) GO/poly-L-Asn/GCE, (c) CG/poly-L-Asn/GCE.
Cyclic voltammetric scan was performed in solutions containing 5.0 mM [Fe(CN)6]3−/4− and 0.1
M KCl. The potential range was set to −0.2 to 0.6 V, and the scan rate was set to 100 mV/s. Figure 2 shows the cyclic voltammograms of [Fe(CN)6]3−/4− oxidation on different working electrodes. Compared
3.3. Effect of Operational Parameters 3.3.1. Effect of support electrolyte and pH
Figure 3. Differential pulse voltammograms of mixtures of 30 μM HQ and CC in different support electrolyte.
[image:5.596.186.415.126.296.2]DPV was performed in different buffer solutions using the CG/poly-L-Asn/GCE on 30 μM HQ and CC mixtures. As shown in Figure 3, the oxidation potentials of HQ and CC are basically the same in pH 6 acetate-sodium acetate buffer solution (HAc-NaAc) and pH 6 phosphate buffer solution (PBS). However, in pH 6.8 B-R buffer solution, both the oxidation potentials negatively shifted. The response of HQ and CC was the best in PBS; therefore, it was selected as the supporting electrolyte.
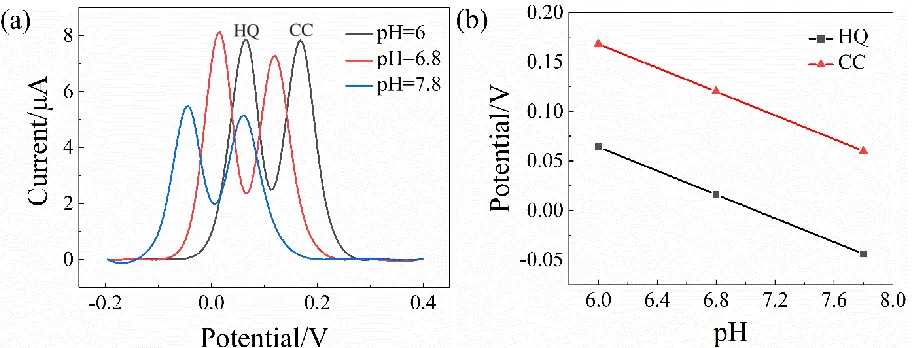
Figure 4. (a) Differential Pulse Voltammograms of mixtures of 30 μM HQ and CC in PBS solution with different pH. (b) Graph of PBS solution vs. peak current.
The response current of 30 μM HQ and CC mixtures with the same concentration was studied at GO/poly-L-Asn/GCE by DPV in PBS solution with different pH. Figure 4(a) shows that the response
CC HQ
[image:5.596.71.527.473.647.2]
current of HQ and CC is better when pH is 6.8 and 7.8. As shown in Figure 4(b), the oxidation potential of HQ and CC shifted continuously with the increase in pH, indicating that the catalytic oxidation of HQ and CC is accompanied by the participation of protons[22,23]. The pH of supporting electrolyte is between 6.0 and 8.0. The oxidation peak potentials of HQ and CC negatively correlated with their linear relationships. Their linear regression equations are Epa = 0.424 − 0.06pH and Epa = 0.528 − 0.06pH (Epa in V, R2 = 1). The slope of both equations is 0.06 V/pH, which is close to the theoretical equation
of proton electron transport of Nernst equation, 0.059 V/pH. This indicates that protons participated in the oxidation reactions of HQ and CC, and the number of transferred electrons is equal to the number of protons. In conclusion, pH 6.8 PBS solution was selected as the supporting electrolyte in subsequent experiments. According to the formula −0.059x/n = −0.06 (where n is the number of transferred electrons, and x is the number of protons involved in the reaction), x = n = 2. The redox process of both HQ and CC is shown in Scheme 1.
Scheme 1. Electrochemical oxidation mechanism of HQ and CC
[image:6.596.72.526.527.704.2]3.3.2. The effect of polymerization substrate and pH
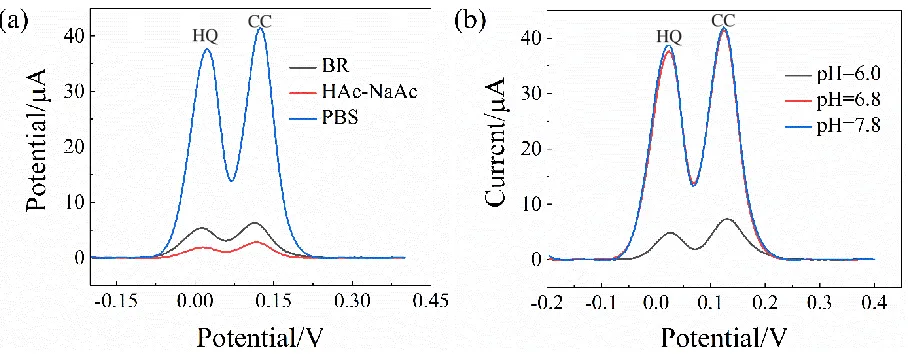
Figure 5. Effect of polymerization substrate (a) and pH (b) on peak current response of mixtures of 30 μM CC and HQ in 0.1 M PBS of pH 6.8
In a 0.1 M PBS (pH 6.8), 0.1 M HAc-NaAc (pH = 6), and BR (pH = 6.8) containing 2.5 μM L-Asn, L-Asn was polymerized on the surface of CG/GCE by CV to form a polymer film. The effect of polymerization substrate on the electrocatalytic activity of HQ and CC was evaluated by the DPV detection of 30 μM HQ and CC mixtures. As shown in Figure 5(a), compared with HAc-NaAc and BR, CG/poly-L-Asn/GCE formed by polymerizing L-Asn in PBS showed a significant response during the simultaneous detection of HQ and CC; thus, L-Asn was polymerized in PBS. The effect of polymer films formed under different pH of polymerization substrate solution on the electrocatalytic activity of HQ and CC was evaluated by the DPV detection of 30 μM HQ and CC mixtures. Figure 5(b) shows that at pH 6.8 and 7.8, the CG/poly-L-Asn/GCE obtained by polymerizing L-Asn has a better response to HQ and CC, whereas at pH 6.0, the response is very low. In this study, pH 6.8 PBS was used as the polymerization substrate solution for subsequent experiments.
[image:7.596.160.436.311.525.2]3.3.3. The effect of polymerization potential
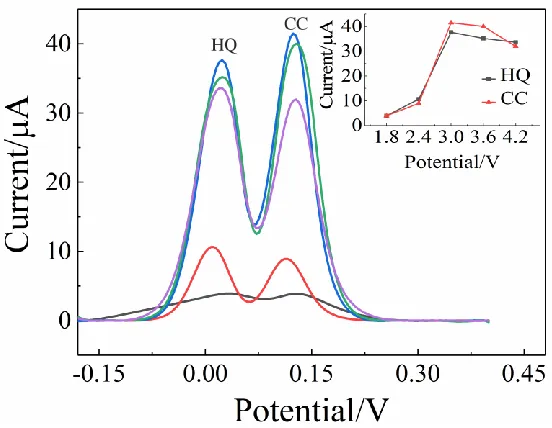
Figure 6. Graph of anodic peak current of oxidation of mixtures of 30 μM CC and HQ in 0.1 M PBS of pH 6.8 vs. number of polymerization potential.
The initial potential was maintained at −1.2 V, and the final potential was 1.8, 2.4, 3.0, 3.6, and 4.2 V. Only when the final potential is greater than 1.5 V, the oxidation of amino group can form the corresponding cation radical, forming a C–N bond with the carbon electrode surface to obtain a polymer film[24,25]. As shown in Figure 6, the response to 30 μM HQ and CC mixtures is the highest when the final potential is 3.0 V. Therefore, a potential range of −0.6 V to 3.0 V was considered to be optimal.
HQ
3.3.4. The effect of polymerization scan rate and cycles
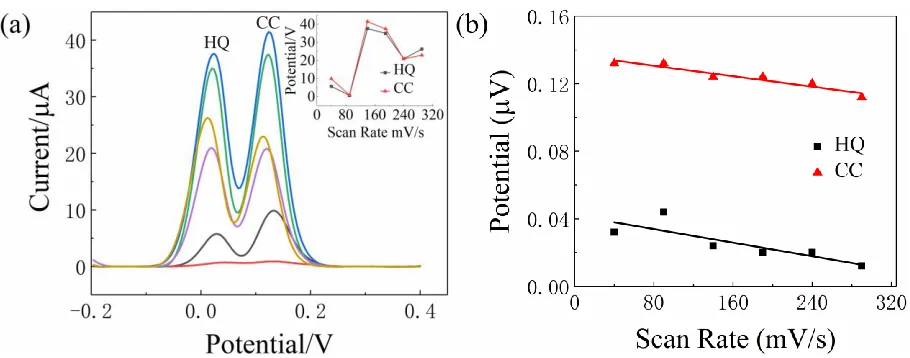
Figure 7. (a) Effect of polymerization scan rate on peak current response of mixtures of 30 μM CC and HQ in 0.1 M PBS at pH 6.8. (b) Graph of peak potential of mixtures of CC and HQ vs. number of polymerization scan rate
-0.2 0.0 0.2 0.4 0
10 20 30 40
0 15 30 45 60 10
20 30 40
Current/
A
Cycles HQ CC
Current/
A
[image:8.596.71.526.95.274.2]Potential/V
Figure 8. Effect of polymerization cycles on peak current response of mixtures of 30 μM CC and HQ in 0.1 M PBS at pH 6.8
The electrocatalytic properties of an electrode modified with a polymer film are significantly affected by its thickness. When the polymer film is prepared by CV, the thickness of film can be easily controlled by changing the scan rate and number of cycles[25]. In this study, different scan rates (40, 90, 140, 190, 240, and 290 mV/s) were first analyzed, and the electrocatalytic behavior of 30 μM HQ and CC was studied by DPV in 0.1 M PBS (pH 6.8). Figure 7(a) shows that the peak current reached the maximum when the scan rate is 140 mV/s. As shown in Figure 7(b), with the increase in scan rate, the peak potential of HQ and CC shifted negatively with a linear relationship. Subsequently, the effects of different polymerization cycles (6, 10, 20, 30, 40, 50, and 60) on the electrocatalytic activity of 30 μM
HQ
CC HQ
HQ and CC mixture were evaluated under the above optimization conditions. As shown in Figure 8, the test results show that the peak current of HQ and CC increased and reached the maximum when the number of polymerization cycles increased from 6 to 20. After 20 cycles of polymerization, the measured peak current started to decrease. This is probably because an increase in the thickness of film would prevent electron transfer[24],which also reflects the growth of electroactive polymer to saturation. Therefore, “20 cycles” was selected as the optimized cycle for L-Asn electropolymerization.
3.3.5Effect of Scan Rate on the Electrochemical Behavior of HQ and CC
-0.2 -0.1 0.0 0.1 0.2 0.3 0.4 -100 -50 0 50 100 Current/ A Potential/V (a) a f
50 100 150 200 250 300 15 30 45 60 75 90 HQ CC Current ( A)
Scan Rate (mV/s) (b)
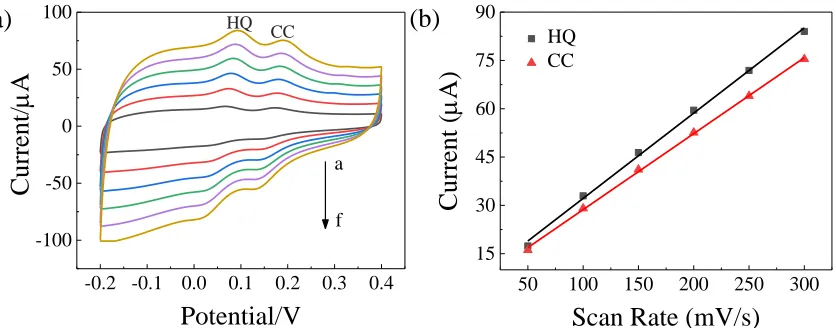
Figure 9. (a) Cyclic voltammograms of mixtures of HQ and CC in 0.1 M PBS solution of pH 6.8 at Poly-L-Asn/CG/GCE with different scan rate (a - f: 50, 100, 150, 200, 250, 300 mV/s). (b) Graph of anodic peak current vs. scan rate
The effect of scan rate on the electrochemical behavior of HQ and CC was studied by CV. As shown in Figure 9(a), with the increase in scan rate, the peak current of HQ and CC also increased. Figure 9(b) shows that the oxidation peak current (Ipa) of HQ and CC has a good linear relationship with scan rate (v). The linear equations are Ipa = 5.7213 + 0.2646v (R2 = 0.9976) and Ipa = 5.112 +
0.2358v (R2 = 0.9993). For HQ and CC, two pairs of symmetrical redox peaks were observed, indicating
that the oxidation of HQ and CC is a completely reversible electrode process, and that the electrode is mainly controlled by adsorption.
3.4. Simultaneous determination of HQ and CC using DPV
Under the optimized conditions, DPV was used to detect HQ and CC simultaneously. The CG/poly-L-Asn/GCE resolved the voltammetric peaks of CC and HQ into two well-distinguished peaks located at 84 mV and 192 mV, respectively. The peak potential difference between HQ and CC was 108 mV. Figure 9 shows the linear relationship between the peak current and concentration of HQ and CC mixtures. When the concentration of HQ and CC were simultaneously increased, the corresponding peak current also increased proportionally. When the concentration range of HQ is 3.3–20 μM and 20–40 μM, the corresponding linear equations are Ip = 73.0967 + 0.8327c (R2 = 0.9903) (Ip in μA, c in μM) and Ip
= 81.8070 + 0.3914c (R2 = 0.9879), respectively. The limit of detection (LOD) calculated using the 3σ
method is 0.0750 μM, and the sensitivity is 0.8327 μA/μM. When the concentration range of CC is 3.3– HQ
[image:9.596.94.512.216.380.2]
20 μM and 20–66.7 μM, the corresponding linear equations are Ip = 40.4547 + 1.2499c (R2 = 0.9960)
and Ip = 55.8219 + 0.5217c (R2 = 0.9859), respectively. The LOD is 0.1362 μM, and the sensitivity is
1.2499 μA/μM. In the high concentration of HQ and CC, a linear deviation was observed due to the saturation of electrode surface. The LOD is obviously lower than that of Chinese national standard (GB 8978-1996). The allowable emission of phenolic compounds is 0.5 mg/L (that for dihydroxybenzene is 4.54 μM). Table 1 shows the linear range, LOD, and sensitivity of CG/poly-L-Asn/GCE while simultaneously detecting HQ and CC.
[image:10.596.77.523.216.392.2]Figure 10. Differential pulse voltammograms for variation in (a) HQ and CC concentration simultaneously in 0.1 M PBS (pH 6.8). From a to p, the concentrations are 3.3, 6.7, 10, 13.3, 16.7, 20, 26.7, 33.3, 40, 46.7, 53.3, 60, and 66.7 μM for HQ and CC mixtures. The corresponding calibration curve for (a) is shown in (b).
Table 1. CG/ poly-L-Asn /GCE detection of HQ and CC at the same time through DPV
LOD(µM) Linear range(µM) Sensitivity (μA·μM−1)
HQ 3.3-20 and 20-40 0.0750 0.8327
CC 3.3-20 and 20-66.7 0.1362 1.2499
3.5. Repeatability measurement
[image:10.596.50.548.500.586.2][image:11.596.185.411.68.241.2]
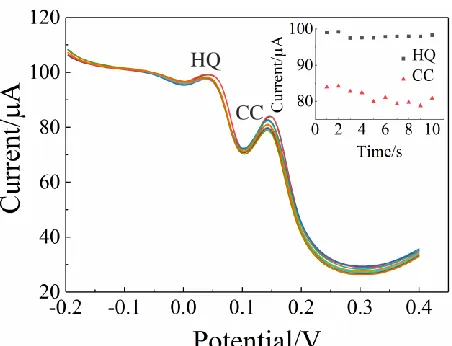
Figure 11. Repeatability measurements of HQ and CC mixtures on CG/poly-L-Asn/GCE. Inset shows detection frequency vs. peak current curve of HQ and CC.
Table 2. Standard deviation of peak current value. HQ and CC were detected with CG/poly-L-Asn/GCE, and the measurement was repeated 10 times.
Time 1 2 3 4 5 6 7 8 9 10 RSD
Peak current/μA
HQ 99.06 99.22 97.51 97.63 97.59 97.86 97.93 97.95 97.91 98.28 0.61% CC 83.94 84.17 82.74 82.37 79.92 81.06 79.30 79.71 78.76 80.86 2.38%
[image:11.596.46.555.327.653.2]3.6 Interference Study
Figure 12. DPV response toward HQ concentration in the presence of 20 μM of CC. From a to n, the concentrations are 1.7, 3.3, 6.7, 10, 13.3, 16.7, 20, 26.7, 33.3, 40, 46.7, 53.3, 60 and 67 μM of HQ. The corresponding calibration curves is shown in inset.
HQ
[image:11.596.185.411.467.646.2]
Figure 13. DPV response towards CC concentration in the presence of 20 μM of HQ. From a to q, the concentrations are 1.7, 3.3, 5.0, 6.7, 8.3, 11.7, 13.3, 20.0, 26.7, 33.3, 40.0, 46.7, 53.3, 60.0, 73.3, and 86.7 μM of CC. The corresponding calibration curves are shown in inset.
Interference studies were conducted in sample mixtures containing CC and HQ. The concentration of one analyte was kept constant while changing the concentration of another analyte. As shown in Figure 12, the concentration of CC is constant at 20 μM, and the oxidation peak current increased linearly with the increase in HQ concentration. When the concentration range of HQ is 1.7– 26.7 μM and 33.3–66.7 μM, the corresponding linear equations are Ip = 63.1347 + 0.3375c (R2 = 0.9826)
and Ip = 86.2576 + 0.062c (R2 = 0.9588), respectively. The LOD is 0.1848 μM. Similarly, Figure 13
shows the differential pulse voltammograms for different concentrations of CC in the presence of 20 μM HQ. The oxidation peak current of CC has a linear relationship with its concentration in the range of 1.7–26.7 μM and 26.7–86.7 μM. The linear equations are Ip = 42.7302 + 0.2854c (R2 = 0.9906) and Ip
= 53.9316 + 0.1471c (R2 = 0.9870), respectively. The LOD is 0.5966 μM. Therefore, the method
proposed in this paper can detect HQ and CC sensitively at the same time and does not interfere with each other.
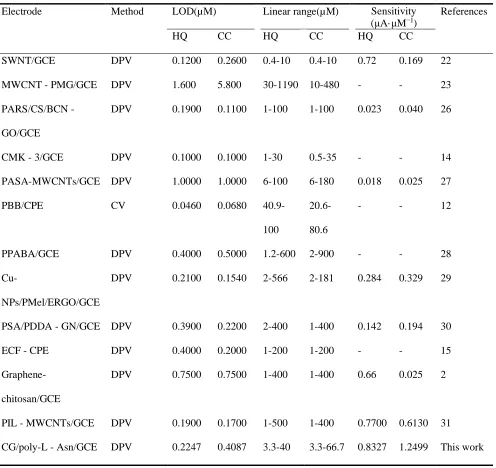
Table 3. Comparison of various polymer modified carbon electrodes reported in literature for the simultaneous determination of HQ and CC.
Electrode Method LOD(µM) Linear range(µM) Sensitivity
(μA·μM−1)
References
HQ CC HQ CC HQ CC
SWNT/GCE DPV 0.1200 0.2600 0.4-10 0.4-10 0.72 0.169 22
MWCNT - PMG/GCE DPV 1.600 5.800 30-1190 10-480 - - 23
PARS/CS/BCN
-GO/GCE
DPV 0.1900 0.1100 1-100 1-100 0.023 0.040 26
CMK - 3/GCE DPV 0.1000 0.1000 1-30 0.5-35 - - 14
PASA-MWCNTs/GCE DPV 1.0000 1.0000 6-100 6-180 0.018 0.025 27
PBB/CPE CV 0.0460 0.0680
40.9-100
20.6-80.6
- - 12
PPABA/GCE DPV 0.4000 0.5000 1.2-600 2-900 - - 28
Cu-NPs/PMel/ERGO/GCE
DPV 0.2100 0.1540 2-566 2-181 0.284 0.329 29
PSA/PDDA - GN/GCE DPV 0.3900 0.2200 2-400 1-400 0.142 0.194 30
ECF - CPE DPV 0.4000 0.2000 1-200 1-200 - - 15
Graphene-chitosan/GCE
DPV 0.7500 0.7500 1-400 1-400 0.66 0.025 2
PIL - MWCNTs/GCE DPV 0.1900 0.1700 1-500 1-400 0.7700 0.6130 31
CG/poly-L - Asn/GCE DPV 0.2247 0.4087 3.3-40 3.3-66.7 0.8327 1.2499 This work
SWNT - single-wall carbon nanotube; MWCNT - multiwalled carbon nanotubes; PMG - poly-malachite green; CMK-3 - mesoporous carbon; PASA – poly(amido sulfonic acid); PBB – poly(brilliant blue); PPABA – poly(p-aminobenzoic acid); Cu-NPs – copper nano particles; PMel – poly(melamine); ERGO – electrochemically reduced graphene oxide;
PSA – poly(sulfosalicylic acid); PDDA - poly(diallyldimethylammonium chloride); ECF - electrospun carbon nanofiber; PIL – poly ionic liquid; GCE – glassy carbon electrode
4. CONCLUSION
[image:13.596.54.550.109.577.2]
of CC and HQ, and the peak currents of CC and HQ clearly increased. In addition, the voltammetric peaks of HQ and CC can be clearly distinguished by CG/poly-L-Asn/GCE. The peak potential difference between HQ and CC was 108 mV. The LODs of both analytes are acceptable in the lower concentration range. In conclusion, the prepared electrochemical sensor exhibits excellent performance in sensitivity, selectivity, and stability.
NOTES
The authors declare no competing financial interest.
ACKNOWLEDGMENTS
This work was supported by the Key Research and Development Projects of Shanxi Province (201803D31058).
References
1. A. J. S. Ahammad, S. Sarker, M. A. Rahman and J. J. Lee, Electroanalytical, 22 (2010) 694-700. 2. H. Yin, Q. Zhang, Y. Zhou, Q. Ma, T. liu, L. Zhu and S. Ai, Electrochim. Acta, 56 (2011) 2748-2753. 3. A. Anil Kumar, B. E. Kumara Swamy, T. Shobha Rani, P. S. Ganesh and Y. Paul Raj, Mater. Sci.
Eng. C. Mater. Biol. Appl., 98 (2019) 746-752.
4. Y. Kong, X. Chen, C. Yao, M. Ma and Z. Chen, Anal. Methods, 3 (2011) 2121.
5. G. Marrubini, E. Calleri, T. Coccini, A. F. Castoldi and L. Manzo, Chromatography, 62 (2005) 25-31.
6. S. C. Moldoveanu and M. Kiser, J. Chromatogr. A, 1141 (2007) 90-97.
7. P. Nagaraja, R. A. Vasantha and K. R. Sunitha, J. Pharm. Biomed. Anal., 25 (2001) 417-424. 8. X. Xia and H. Sun, Anal. Methods, 5 (2013) 6135.
9. L. Zhao, B. Lv, H. Yuan, Z. Zhou and X. Dan, Sensors, 7 (2007) 578-588.
10. Y. Chao, X. Zhang, L. Liu, L. Tian, M. Pei and W. Cao, Microchim. Acta, 182 (2014) 943-948. 11. Garcia-Mesa, A. José and R. Mateos, J. Agr. Food. Chem., 55 (2007) 3863-3868.
12. P. S. Ganesh and B. E. Kumara Swamy, J. Electroanal. Chem., 756 (2015) 193-200. 13. M. A. Ghanem, Electrochem. Commun., 9 (2007) 2501-2506.
14. J. Yu, W. Du, F. Zhao and B. Zeng, Electrochim. Acta, 54 (2009) 984-988.
15. Q. Guo, J. Huang, P. Chen, Y. Liu, H. Hou and T. You, Sens. Actuators B Chem., 163 (2012) 179-185.
16. R. M. D. Carvalho, C. Mello and L. T. Kubota, Anal. Chim. Acta, 420 (2000) 109-121.
17. K. Bustos-Ramirez, A. L. Martinez-Hernandez, G. Martinez-Barrera, M. Icaza, V. M. Castano and C. Velasco-Santos, Materials (Basel), 6 (2013) 911-926.
18. Y. Wang, Y. Li, L. Tang, J. Lu and J. Li, Electrochem. Commun., 11 (2009) 889-892. 19. D. Chen, L. Tang and J. Li, Chem. Soc. Rev., 39 (2010) 3157-3180.
20. Z. K. Wang, G. X. Zhang and Y. C. Liu, Aerospace Manuf. Technol., 5 (2012) 28-30.
21. I. Y. Jeon, Y. R. Shin, G. J. Sohn, H. J. Choi, Bae, S. Y. Bae and J. Mahmood, Proc Natl Acad Sci U S A, 109 (2012) 5588-5593.
22. Z. Wang, S. Li and Q. Lv, Sens. Actuators B: Chem., 127 (2007) 420-425.
23. Y. Umasankar, A. P. Periasamy and S. M. Chen, Anal. Biochem., 411 (2011) 71-79. 24. J. Li and X. Zhang, Am. J. Anal. Chem., 03 (2012) 195-203.
26. J. Qu, Y. Wang, J. Guo, Y. Dong and T. Lou, J. Electrochem. Soc., 161 (2014) 220-224.
27. D. M. Zhao, X. H. Zhang, L. J. Feng, L. Jia and S. F. Wang, Colloids Surf. B Biointerfaces, 74 (2009) 317-321.
28. P. Yang, Q. Zhu, Y. Chen and F. Wang, J. Appl. Polym. Sci., 113 (2009) 2881-2886. 29. P. S. Dorraji and F. Jalaliz, J. Electrochem. Soc., 162 (2015) B237-B244.
30. C. Li, W. Liu, Y. Gu, S. Hao, X. Yan, Z. Zhang and M. Yang, J. Appl. Electrochem., 44 (2014) 1059-1067.
31. X. Feng, W. Gao, S. Zhou, H. Shi, H. Huang and W. Song, Anal. Chim. Acta, 805 (2013) 36-44.
![Figure 2. Cyclic voltammograms of different working electrodes in 5.0 mM [Fe(CN)6]3-/4- containing 0.1 M KCl](https://thumb-us.123doks.com/thumbv2/123dok_us/1773455.131309/4.596.139.459.258.505/figure-cyclic-voltammograms-different-working-electrodes-containing-kcl.webp)