Structure-property relationships in glass reinforced polyamide: 2) The effects of average fibre diameter and diameter distribution.
J. L. Thomason Abstract
We present the results of an extensive study of the influence of average fibre diameter and the width of the diameter distribution on the performance of injection moulded glass-fibre reinforced polyamide 66. In the average fibre diameter range from 9-18μm dry-as-moulded (DaM) composite unnotched impact and tensile strength decreased significantly. The composite notched impact performance and tensile modulus showed little dependence on fibre diameter. The influence of broadening the fibre diameter distribution by blending glass fibre samples of different average diameter was found to be particularly negative on the level of composite unnotched impact when compared at equal number average diameter. After hydrolysis treatment the composite tensile strength and modulus exhibited a large drop compared to the DaM results. In contrast, the unnotched impact results became insensitive to fibre diameter after hydrolysis. The average level of unnotched impact after hydrolysis was sufficiently high to show an increase over DaM when the fibre diameter was above 14μm. Residual fibre length correlated significantly with fibre diameter with a lower average length for thinner fibres. The interfacial shear strength was found to be in the range of 26-34 MPa for DaM composites. There was a highly significant inverse correlation between the DaM interfacial strength and the average fibre diameter. It is shown that results from both tensile and unnotched impact measurements can be brought back to single trend lines by using a Z average value for the average fibre diameter which is more heavily weighted to the thicker fibres in the distribution.
Introduction
Glass reinforced thermoplastics continues to be one of the most exciting growth areas in the composites market. In recent years there has been an increasing growth in the use of glass-fibre-thermoplastic composite systems in semi-structural and engineering applications. These thermoplastic matrix composite systems combine ease of processing with property advantages such as enhanced toughness and an unlimited shelf life. Furthermore, their intrinsic recyclability is rapidly being recognised as a strong driving force for their further application. Their potential for high-volume processing combined with high levels of end use property levels and associated lower manufacturing costs has spurred the current expansion of research and development activities on thermoplastic matrix composites. Parallel to this growth has been the increasing recognition of the need to better understand and measure the micro-mechanical material parameters and processing parameters which control the performance of such composite parts. Glass fibre reinforced polyamides, such as nylon 6 and nylon 66, are excellent composite materials in terms of their high levels of mechanical performance and temperature resistance. However, the mechanical properties of polyamide based composites decrease markedly upon the absorption of water and other polar fluids. The mechanical performance of these composites results from a combination of the fibre and matrix properties and the ability to transfer stresses across the fibre-matrix interface. Variables such as the fibre content, diameter, orientation and the interfacial strength are of prime importance to the final balance of properties exhibited by injection moulded thermoplastic composites (1-11). The optimization of composite processibility and performance through control of the base materials and the various steps of fibre-matrix combination and parts production is already a major technical challenge. The challenge to a fibre reinforcement supplier is how to offer outstanding reinforcement products which can meet the demands of all the intermediaries in the composite chain and match the internal manufacturing and financial targets. For some time we have been engaged in a programme to further elucidate the structure-processing-property relationships in glass fibre reinforced thermoplastics. In this report we focus on the influence of average fibre diameter and the width of the fibre diameter distribution.
use of different glass formulations (E-glass and S2 glass®) as well as fibre diameters. Chu also reported (11) data on the mechanical performance of injection moulded glass reinforced polypropylene where the fibre diameter was varied from 10-16 μm. He observed trend in mechanical performance very similar to those reported in polyamide, with a 25% drop in unnotched impact, 10% drop in tensile strength and no dependence of notched impact moving from 10 μm to 16 μm diameter fibres. Interestingly Moon (12) reported a 20-30% reduction in the interfacial shear strength of single glass fibres embedded in polyethylene or epoxy resin droplets when the fibre diameter increased from 10 μm to 20 μm.
In this report we present an in-depth discussion of the results on of a number of trials of short glass fibre reinforced polyamide 66. We present results on injection moulded
composites manufactured with chopped glass fibres with a range of average fibre diameters. We have also investigated the effects of widening the fibre diameter distribution by blending fibres of different average diameter into a single composite. Mechanical properties have been measured on both dry-as-moulded samples and after hydrolysis conditioning. These samples have also been characterised on the micro-mechanical level by measuring residual fibre length distributions, fibre orientation parameter and interfacial shear strength.
Experimental
The fibres used in this study were all produced using the Owens Corning Cratec™ process for chopped strands (13) using E-glass. These samples were chopped to a length of 4 mm. All glass fibre samples were coated with the sizing formulation 123D which is design for compatibility with polyamide resins. 123D is a typical sizing designed to maximise the “dry as moulded” (DaM) performance of glass reinforced polyamides where the main ingredients are aminosilane coupling agent and a commercial polyurethane dispersion (14,15). The sample C10 was taken from the normal commercial production of 123D-10C. Five chopped glass samples (series A) were produced on a smaller scale pilot fibre-forming facility. Target fibre diameters were 9,10,14,16,18 microns (P9-P18). A number of broader fibre diameter distribution composite samples were produced using these single diameter distribution samples. Dry blends of the pilot plant samples were produced (series B), 50:50 weight blends of P18:P9 (P18-9) and P16:P10 (P16-10) were made and blends of all five glasses at 20% weight fraction of each glass (P20W) and 20% number fraction of each glass (P20N). A series of blends (series C) was also produced by replacing 20% by number of the fibres in the commercial C10 sample using the pilot fibres of different diameters (CP9 to CP18). A description of the various samples is given in Table 1 along with a calculated value of the nominal average fibre diameter of each blend.
93°C. Hydrolysis conditioning took place in a temperature controlled pressurized vessel with samples fully immersed in a 50:50 mixture of water and glycol. On removal from
conditioning container samples were cooled to room temperature in a bath of 50/50 water/glycol, then stored in plastic bags for immediate mechanical testing.
Tensile properties were measured in accordance with the procedures in ASTM D-638, using ASTM Type I specimens at a crosshead rate of 5 mm/min (0.2 inches/min) and an extensometer gauge length of 50 mm (2 inches). Flexural properties were measured in accordance with the procedures in ASTM D-790, at a crosshead rate of 2.5 mm/min (0.1 inches/min) and a span width of 50 mm (2 inches). Izod and modified Charpy impact properties were measured on ten specimens in accordance with the procedures in ASTM D-256 and ASTM D-4812. Deflection temperature under load (DTUL) was measured on three specimens of each sample according to ASTM D648. Unless otherwise stated, all
mechanical property testing was performed at 23°C and at a relative humidity of 50%. Fibre length and diameters were determined by image analysis and optical microscopy on fibre samples removed from the moulded bars after high temperature ashing. Measurement of fibre orientation was carried out on cross sections of moulded tensile bars cut perpendicular to the flow direction. The sections were polished and a series of optical micrographs was taken systematically across the thickness of the bar. The orientation of any fibre can be determined from its elliptical profile using the equation (16,17)
cos (φ) = W/L = 4A/πL2 (1)
where φ is the angle the fibre axis makes with the flow direction, W is the minor axis of the ellipse which should also represent the fibre diameter, L is the ellipse major axis, and A is the area of the ellipse. Either of possibilities in equation 1 may be used, however it has been shown (17) that the greatest experimental error comes from the measurement of W and that the area method produces values with a lower degree of uncertainty. The Hermans
orientation parameter (fp) can be calculated from this data using
fp = 2< cos2(φ) > -1 (2)
where the average value of <cos2 φ > is approximated by
< cos2(φ) > =
Σ
i [ N(φi) cos2(φi) ]/Σ
i [ N(φi) ] (3)The values of N(φi) must first be adjusted (18) by dividing by cos (φi) due to the lower
probability of the section crossing fibres with higher values of φ. The average fibre orientation factor (ηo) used in the Cox-Krenchel theory for composite modulus can be
calculated using (19,20)
Results
The fibre diameter distributions of the six individual chopped glass fibre samples in this study are shown in Figure 1. The average filament diameter and percentage standard deviation are given in Table 2. An important observation from Figure 1 is that the
distributions for the low micronage samples (C10, P9,P10) have no significant overlap with that of sample P18 and very little overlap with the distribution of sample P16. This means that in any composite containing a mix of these low and high average diameter products we can distinguish the origin of any fibre from its measured diameter.
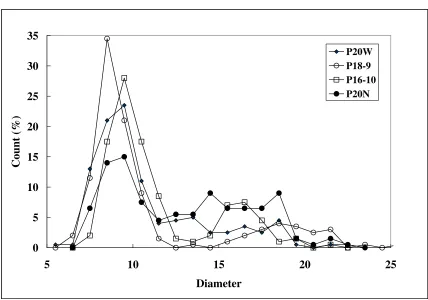
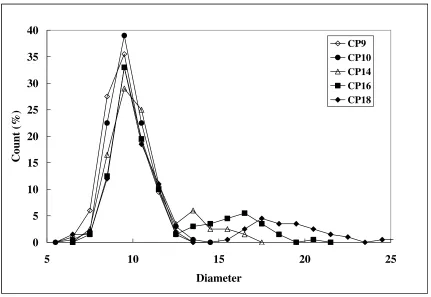
The fibre diameter distribution of the two series of fibre blends are show in Figures 2 and 3. For the A series of blends the distributions are characterised by a large peak at
approximately 10 μm. The mixtures containing higher micronage fibres are characterised by a small shoulder at higher diameters. All the distributions show a large 10 μm peak despite the fact that some mixtures contain significantly high weight fractions of thicker fibres. This emphasizes the fact that the measurement technique depends on counting the number of fibres present, which is disproportionably weighted to the inverse of the square of the diameter of the fibres. This trend is confirmed in the data in Figure 3. The
comparison of the weight (P20W) and number blends (P20N) show the difference clearly. The weight blend of five individual samples also shows the large peak at 10 μm. However, the number blends shows a much more uniform distribution, the peak around 10 μm is still present due to the fact that the distributions of the individual samples P9 and P10 are close together. Using the distributions in Figure 1 together with the average fibre diameters of these samples and the weight ratios used in the blends it is possible to calculate an expected distribution for each of the blended samples. Examples of the comparison between expected and measured distributions are shown for samples P20N and P20W in Figure 4 and 5. It can be seen that the measured distributions agree well with the expected values from the above calculation. The calculated and measured number average diameters for all blended
samples are compared in Figure 6. A least squares regression analysis shows a highly significant correlation between these values with a slope very close to unity which also indicates measured and calculated values are well in agreement.
A comparison of the mechanical performance of the various blended sample is compared with that of the individual diameter samples in Figures 9-15. In all cases the solid lines shows the trends for the individual diameter samples. In Figure 9 we can see that the Young's modulus of the blended samples appear to fall slightly below the trend line for the individual diameter samples. This lower trend for the blended samples is more evident in the tensile strength results shown in Figure 10, in this case all the blends containing a fraction of the higher diameter fibres (i.e. 〈 14 μm) exhibit a significantly lower strength than the individual diameter samples. In contrast to this trend, in Figure 11 we can see that there is no significant difference in the tensile elongation behaviour of the blended diameter samples as compared to the individual diameter samples. In Figure 12 it can be seen that the notched Izod performance of the blended samples is significantly below the individual diameter samples. In Figures 13 and 14 we can see that the unnotched performance of the blended samples is well below that of the individual diameter samples. It can also be seen in these two Figures that the slope of the trend line for the blended samples is even more negative than that of the individual samples. It therefore appears that the negative effect of increased fibre diameter on unnotched impact performance in polyamide 66 is magnified when the breadth of the fibre diameter distribution is increased.
The results of the mechanical performance of these composites after 200 hours conditioning in water/glycol mixture at 120°C are summarised in Figures 15-18. In Figures 15-17 it can be seen that after conditioning there is no significant difference between the diameter dependence trends for Young’s modulus, tensile elongation and unnotched Charpy impact. In Figure 18 it is apparent that there is still a negative effect of diameter blending apparent in composite tensile strength even after conditioning. In Figure 19 we have attempted to give an overview of the global effects of hydrolysis conditioning on mechanical
performance. In this Figure we compare the hydrolyzed performance of all samples with the DaM performance of the individual diameter samples. For any particular mechanical property the DaM and hydrolyzed data have been normallised to the DaM performance of the P10 sample. It can be seen that conditioning reduces the tensile performance (strength and modulus) by 50-60%, most likely due to the plasticisation of the polyamide matrix by the aqueous conditioning fluid. It is very interesting to note that the change in unnotched impact performance due to conditioning is dependent on the average fibre diameter of the sample. The trend lines for unnotched Charpy impact for DaM and hydrolyzed samples intersect at approximately 14 μm average fibre diameter. Below this value unnotched impact is lowered by the conditioning. However, above 14 μm average fibre diameter we actually get an increase in unnotched Charpy performance after conditioning.
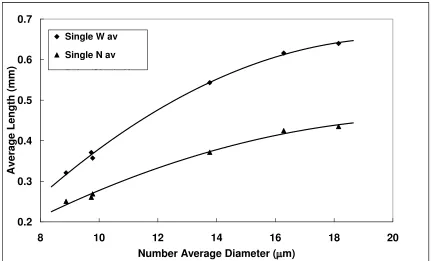
It is well known that the processing of glass fibres into injection moulded composites leads to large reductions in the fibre length (21-24). Figure 20 shows both number average (Ln )
and weight average (Lw ) length versus average fibre diameter for the series of composites
also leads to an increased apparent melt viscosity resulting in higher bending forces on the fibres during compounding and moulding. It is interesting to note that, in this range, many mechanical properties increase as fibre diameter decreases despite the decrease in residual fibre length.
In Figure 21 we compare the average residual fibre length in the blended composites are compared with the trend lines for the individual diameter samples. It can be seen that the average fibre lengths in the blended samples clearly fall below the trend lines for the individual diameter samples. As noted above some of the blends in this study were made with non-overlapping diameter distributions. This enabled us to obtain values of residual fibre length for the two individual diameter samples in four of the diameter blend samples where the individual diameter distributions were far enough separated. This was achieved by measuring both the diameter and length of individual fibres isolated from the moulded samples and assigning the origin of the fibre by comparison with the individual fibre diameter distributions in Figure 1. Results from this study are displayed in Figure 22 for the weight average of the fibre length distribution. The results are displayed as three connected data points for each blend. The central point on each line is the average length value shown in the previous figure, the value for Lw for fibres from the two individual fibre diameter samples are also shown. What is immediately obvious from this figure is that the average residual fibre lengths of the thick diameter samples are significantly lower in the blends than when these glass samples are processed alone. In the blend containing the thinnest fibres (P18-9) it appears that the thin fibres are also longer than when those fibres are processed individually.
These results are in agreement with the previous study of S2 glass® – E-glass blends where the S2 glass® fibres were thin and the E-glass fibres were in the 10-17μm range (8). In that study we also found that the average residual fibre length of the E-glass fibres was shorter as the average diameter decreased. We also observed that the thick E-glass fibres were significantly reduced in length when the thin S2 glass® fibres were blended with them. In that study there were differences in chop length and glass composition which complicated our ability to assign these effects unambiguously to fibre diameter differences. In the current study all the samples were of the same chop length and glass formulation.
Discussion
The data for the composite tensile modulus in Figure 1 can be modeled using a number of approaches. One common approach is to use a simple “rule-of-mixtures” equation
E V + E V =
Ec η0ηl f f (1− f) m (5)
We can use the fibre length data reported in Figure 20 to calculate the ηl factor using the
composite and matrix modulus we can obtain a value for the orientation parameter (ηο) for each sample (20).
Another approach is to use the equation
E +
E =
Ec η0 1 (1−η0) 2 (6)
where E1 and E2 are obtained from the Halpin-Tsai equations (25) for the modulus of a
unidirectionally reinforced laminate.
2 2 1 1 1 2
1= =
+ ⎟ ⎠ ⎞ ⎜ ⎝ ⎛ − ⎟ ⎠ ⎞ ⎜ ⎝ ⎛ ⎥ ⎥ ⎦ ⎤ ⎢ ⎢ ⎣ ⎡ − + ξ ξ ξ η η η ξ D L E E E E = V V E = E j m f m f j j f j j f m
j (7)
In a recent report on the properties of glass reinforced polyamide (21) we reviewed how some of the existing models for analyzing the results of composite modulus exhibit some discrepancies when applied to this type of material. In particular we showed that the data can be reduced to the analysis of fibre orientation parameters, which are the major unknown for this type of analysis. The other required parameters for such modulus modeling, fibre and matrix modulus, fibre volume fraction, fibre length and diameter can all be measured with varying degree of accuracy. However, the measurement and application of fibre orientation parameters in modulus modeling for injection moulded composites remains a difficult area. It was shown that orientation parameters obtained from measured DaM composite modulus and analysis using equations based on either Cox-Krenchel theory or the Halpin-Tsai equations gave very comparable values. After hydrolysis the Cox-Krenchel approach still gave reasonable values of orientation parameter, but only when the fibre volume fraction was adjusted to account for the swelling of the sample. The Halpin-Tsai approach gave physically unacceptable values for hydrolysis conditioned samples, even after the volume fraction adjustment. In comparison with orientation parameter values obtained from experimental observation of elliptical fibre cross section in polished
sectioned composites we found reasonable agreement with the above approaches only when a <cos2(φ)> approach was used, whereas theoretically a <cos4(φ)> approach is required. We have applied similar analyses with this series of samples to obtain further verification of the above observations.
In Figure 23 we present results for the average fibre orientation parameter obtained using the above referenced methods. We present only the results for the series A containing the homologous series of single fibre diameter samples, since the theoretical approaches referenced here become difficult to apply to these samples with such wide diameter
theoretical basis from Krenchel, gives much lower values for the orientation parameter. Consequently using a ηο=<cos4(φ)> value from optical analysis would significantly
underestimate the composite modulus. The data obtained from the composite modulus after hydrolysis conditioning and the Cox-Krenchel approach are also in good agreement after we adjusted the fibre volume fraction of the DaM samples to account for matrix swelling. Once again the Halpin-Tsai analysis gave values of orientation parameter greater than unity for the conditioned samples, indicating once again that this approach should not be used with this type of material.
The optical approach to fibre orientation investigation offers one extra possibility in the case of the samples produced with two well separated individual diameter distribution samples. The method requires the measurement of the major and minor axis of the fibre cross sections observed in a polished composite section. The minor axis of each ellipse is simply a measure of the fibre diameter. In a similar exercise to that which we carried out on fibre length it was possible to produce average orientation parameters for the two diameter distributions in some of the blends. The results are presented in Figure 24, which shows the orientation parameters for the thick and thin fibres in the blends plotted against the average fibre diameter of the collection of fibres on which each orientation parameter was
measured. The thick and thin values are connected through the average values for each blend. We also show the trend line values obtained for series A from Figure 23. The results all appear to follow a similar trend showing a weak trend for thicker fibres having a
somewhat higher level of orientation. Although we stated above that there was no strong dependence of orientation parameter on fibre diameter, Figure 24 contains five data sets which all appear to show the same trend.
Despite the weak dependence on fibre diameter we have previously shown a strong inverse dependence of orientation parameter on fibre aspect ratio in similar injection moulded glass fibre polyamide samples. In Figure 25 we compare data with this investigation with the previously reported data (8). It can be seen that there is a relatively good agreement
between the two data sets further supporting the hypothesis that fibre orientation in blended samples appears to be inversely correlated with residual fibre aspect ratio.
The macro-method analysis used here to obtain values of the interfacial shear strength (IFSS) was originally proposed by Bowyer and Bader (26,27) and an improved version has been extensively reviewed by Thomason (28-31). The macro-method has a significant attraction over some other methods in that it utilizes data which are readily available from standard composite mechanical testing and requires only an extra determination of fibre length distribution, which is a common characterisation tool of those working with discontinuous fibre composites. The method is based on the Kelly-Tyson model for the prediction of the strength (σuc) of a polymer composite reinforced with discrete aligned
fibres (32). This model can be simplified to σuc = ηo (X + Y) + Z, where Z is the matrix
contribution, X is the sub-critical fibre contribution, and Y is the super critical contribution, in reference to a critical fibre length defined by Lc =σuf D / 2τ where σuf is the fibre
to obtain values for τ and ηo using this method. Thomason has recently shown how the
model can be improved by taking into account the non-linear stress-strain behaviour of thermoplastic matrices (28-31). For the matrix used in this study the stress contribution (in MPa) can be calculated for any strain level between 0-3% using
σPA = -0.56ε3 − 0.55ε2 + 28.85 ε (10)
Furthermore the analysis method was extended to obtain a value for σuf the maximum fibre
stress at composite failure. This can be obtained by inserting the composite breaking stress into the original Kelly-Tyson equation along with the determined values of τ and ηo.
Consequently, this method gives a complete characterisation of the micromechanical parameters ηo, τ, σuf of any system. The relative simplicity and cost effectiveness of this
approach makes it ideal as an industrial screening tool for product developers. When the stress at the 1% and 2% strain levels obtained from tensile testing are combined with the full fibre length distributions used to obtain the averages in Figure 20 and applied in the procedure described above we obtain values for the parameters ηo, τ, σuf. The situation
becomes more complicated in the case of the samples containing blends of different fibre diameter distributions and we are currently investigating if it is possible to apply this analysis to such samples where the fibre length is dependent on the fibre diameter. The following discussion is therefore limited to the single diameter samples in this study.
The results for ηo for the single diameter samples in the study all fell in the range of ηo =
0.81 ± 0.1, moreover the two blended samples CP9 and CP10 whose diameter distribution was virtually unchanged compared to a single diameter sample also fell in this range. Not surprisingly the macro-analysis values, which also use input data from mechanical testing, follow a similar trend to those obtained from the composite modulus shown in Figure 23. Indeed the very small trends of ηo variation within the value of 0.81 ± 0.1 were identical
with those observed in Figure 23.
The results for the IFSS as a function of fibre diameter are shown in Figure 26. The data appear to indicate a strongly significant inverse correlation between IFSS and average fibre diameter. Statistical analysis shows that the correlation is significant at the 99% confidence level. Previous results using this macro-model analysis has shown an excellent correlation between the output value of the fibre stress at composite failure σuf and the experimental
tensile elongation at failure (21, 28-31). In Figure 27 we show strain value calculated from
σuf and fibre modulus Ef = 72 GPa plotted against the experimental values. Once again we
see an excellent correlation, which indicates that fibres which are longer than Lc (and which are aligned with the loading direction) are strained to approximately the same level as the composite itself.
of change over that diameter range. An interesting question at this stage is whether the apparent IFSS and the fibre stress at composite failure are independent parameters. The fibre stress levels discussed here are in the range of 1500-2000 MPa. Thomason and Kalinka (33) have reported similar levels of fibre strength for chopped E-glass fibres, measured at gauge lengths (0.3 mm) similar to the average fibre length in these composites, in the same range. It is therefore conceivable that the composite failure is initiated by fibre failure. On the other hand Sato (9,34) have published results of electron microscopy of these type of materials during tensile testing which indicates that the failure initiates and propagates from the fibre ends as the composite strain is increased. In this scenario it is conceivable that an increased IFSS could lead to a slowing of the propagation of the failure zone and delay macroscopic failure to a higher strain level, which would then result in a higher fibre stress from the above analysis. It is clear that a better understanding of the strain driven processes in these materials is required to fully understand the failure processes.
With regard to understanding the notched impact results in Figure 12 we have recently shown that the fibre contribution to the notched impact resistance of injection moulded glass reinforced polypropylene is directly related to the residual fibre aspect ratio in the composites (22). In Figure 28 we have compared the trend for notched impact and the residual fibre aspect ratio of the series A samples. It is clear from this figure that these two quantities do follow the same trends for these polyamide based composites. A more detailed understanding requires that the fibre contribution to the energy absorbed in a notched impact test scales with Vf.L/D. We have produced a plot based on this hypothesis
in Figure 29 where we have included all the samples in this study, using weight average fibre length and a simple number average fibre diameter. Using a least squares calculation of the best fit for a straight line relationship we obtain a line which passes through the majority of the data points and passes close to the origin. Despite the fact that the data set in this study does not cover a wide range of the factor Vf.L/D, it appears that the data available
here do support the above hypothesis.
The results for the unnotched impact dependence shown in Figures 13-14 are well in line with the few results on this subject available in the literature (7-11). Despite the
technological importance of the unnotched impact resistance of this class of composite there has been surprisingly little detailed work published on this subject. One reason for this may well be due to the complexity of the phenomena involved in the energy dissipation in this process. There can be little doubt that the largest fraction of the measured energy loss in an Izod or Charpy unnotched test on this class of material is the strain energy taken up in the sample during the generation of the first critical crack. Depending on the test conditions and the sample configuration there may also be a contribution from the propagation of the crack through the sample. However, it seems likely that in the case of DaM glass reinforced polyamide that the crack propagates unstably once it reaches a critical size and therefore there will be only a very small level of further energy absorption at that point in the fracture process. It also seems likely that fibre-matrix debonding will play an important role in inhibiting the formation of the critical flaw. The Griffith relationship (35,36) for brittle solids containing a flaw of dimension (a) gives the fracture stress (Fs) as
For an elastic solid the strain energy (U) at fracture is simply
U=K2Fs2/E=K3/a
where Ki are constants and E is the modulus. Once some level of debonding has occurred
during the impact process the debonded regions of the fibre may act in some way as flaws whose dimension will be related to fibre diameter. Although this is an extremely simplistic analysis it does result in a simple expression for the fracture energy being inversely
proportional to the fibre diameter. It therefore becomes understandable that the unnotched impact performance of these composites shows such a strong inverse dependence on fibre diameter.
From the above discussion it seems reasonable to suggest that in a system containing a distribution of fibre diameters that the larger diameter fibres would have a greater negative influence on the unnotched impact performance of the composite. This effect would be magnified if the IFSS for the thicker fibres were lower than that for the thin fibres, as we have shown in Figure 26. The results for the blended fibre samples with wider fibre
diameter distributions in Figures 13 and 14 can certainly be used to support such a theory. It would therefore appear expedient to find a way of expressing the greater significance of the thicker fibres on the decrease in mechanical performance.
Many of the important structural parameters which determine the performance of glass-reinforced-thermoplastics, such as fibre diameter and fibre length, may exhibit quite broad distributions (as illustrated in Figure 1). One field where this is particularly well known is in the determination of polymer molecular weight, where the distribution may be spread over 4-5 orders of magnitude. Although reduction of a distribution to any single average results in a loss of information it has been found that different types of average may be related to specific properties of the materials. A number of the averages that are in use are shown below. Number Average
∑
∑
= i i i i i nN X N
X Weight Average
i i i i i i w X N X N X
∑
∑
= 2Z Average 2
3
i i i i i i z X N X N X
∑
∑
= Z+1 Average 3
4
1
i i i i i i z X N X N X
∑
∑
= +Where Ni is the fraction of the distribution with value Xi. In terms of diameter distribution it
is common practice to take a simple number average as the representative value. This has probably come about due to the fact that this is the simplest average and due to a lack of any detailed investigation into the influence of diameter distribution on structure-property relationships. One of the striking points about the data in Figures 13 and 14 is that the lower average fibre diameter blend P18-9 (with a broader distribution) gave significantly lower properties than the higher average fibre diameter blend P16-10 (with a narrower
above. By applying a least squares straight line fit to the whole data set for the various average diameter values obtained we could obtain the diameter average which gave the best coefficient of correlation. We obtained the best correlation between blended and unblended samples by using the Z average fibre diameter distribution. The data for normalised
Conclusions
This study of the effect of average fibre diameter and fibre diameter distribution on the performance of injection moulded glass-fibre reinforced polyamide 66 has revealed that fibre diameter is a key variable for the mechanical properties of such composites. In the average fibre diameter range from 9-18 μm dry- as-moulded (DaM) unnotched impact of GF-PA6,6 decreased strongly, tensile strength also decreased significantly but to a lesser extent. The composite notched impact performance showed a weak maximum at an average fibre diameter of 14 μm. The tensile modulus exhibited practically no dependence on fibre diameter over this range. After hydrolysis treatment the composite tensile strength
exhibited a large drop compared to the DaM results, however the influence of fibre diameter was still detectable. In contrast, the unnotched impact results became insensitive to fibre diameter after hydrolysis. The average level of unnotched impact after hydrolysis was sufficiently high to show an increase over DaM when the fibre diameter was above 14
μm.
The influence of broadening the fibre diameter distribution by blending glass fibre samples of different average diameter was found to be particularly negative on the level of
composite unnotched impact when compared at equal number average diameter. The broadest distributions investigated gave a 20% drop in unnotched impact performance at an average fibre diameter of 11 μm. Composite tensile strength and notched impact resistance was also significantly reduced by broadening the fibre diameter distribution. The average residual fibre length in these injection moulded composites was also found to be dependent on average fibre diameter with a lower average length for thinner fibres. Analysis of samples containing blends of different fibre diameters also showed that thinner fibres experience a greater level of fibre length degradation during composite processing.
Analysis of fibre orientation in the injection moulded composites showed little significant effect of average fibre diameter on fibre orientation. However, a strong correlation was found between average fibre orientation parameter and the residual fibre aspect ratio. There were some differences in the results between average fibre orientation parameters
References
1.
Various Authors, in "Polypropylene: An A-Z reference" J.Karger-Kocsis editor, Kluwer Academic Publishers, London 19992.
Various Authors, in "Handbook of polypropylene and polypropylene composites" H.G. Karian editor, Marcel Dekker, New York 19993. M.Akay, D.F. O’Regan, and R.S.Bailey, Compos.Sci.Technol. 55, 109 (1995) 4. J.L.Thomason and M.A.Vlug, Composites, 27A, 477 (1996)..
5. J.L.Thomason, M.A.Vlug, G.Schipper and H.G.L.T.Krikor, Composites, 27A, 1075 (1996).
6. J. J. Horst and J. L. Spoormaker, J. Mater. Sci. 32, 3641 (1997).
7. D. M. Laura, H. Keskkula, J. W. Barlow, D. R. Paul, Polymer 43, 4673 (2002) 8. J.L. Thomason, Compos.Sci.Technol., 59, 2315 (1999)
9. N. Sato, T. Kurauchi, S. Sato, and O. Kamigaito, J. Compos. Mater., 22, 850 (1998). 10.F. Ramsteiner and R. Theysohn, , Compos.Sci.Technol., 24, 231 (1985).
11.P.F. Chu in “Handbook of Polypropylene and Polypropylene Composites”, Edited by H.G. Karian, Marcel Dekker, New York 1999
12.C.K. Moon, J.Lee, H.H.Cho, and K.S.Kim, J..Appl.Polym.Sci., 45, 443 (1992).
13.L.E.Campbell, in “Handbook of Polypropylene and Polypropylene Composites”, ed. H.G. Karian, Marcel Dekker, New York, 1999
14.United States Patent 4,255,317
15.J.L.Thomason and L.J.Adzima, Composites Part A 32, 313 (2001). 16.S.Toll and P. O. Andersson, Polym.Composites., 14, 116(1993). 17.S. Toll and P. O. Andersson, Composites., 22, 298 (1991).
18.R.S. Bay and C.L. Tucker, Polym. Eng. Sci., 32, pp240-253 (1992) 19.H.L. Cox, Brit.J.Appl.Phys., 3, 72 (1952)
20.H. Krenchel in “Fibre Reinforcement”, Akademisk Forlag, Copenhagen, (1964) 21.J.L.Thomason, Polymer Composites in print.
22.J.L.Thomason, J.L. Composites 33A, 1641 (2002)
23.B.Franzen, C.Klason, J.Kubat and T.Kitano, Composites 20, 65 (1989). 24.R.S.Bailey and H.Kraft, Intern. Polymer Processing, 2, 94 (1987).. 25.J.C.Halpin and J.L.Kardos, Polym.Eng.Sci. 16, 344 (1976). 26.Bader, M.G. and Bowyer, W.H., Composites 4, 150 (1973) 27.W.H.Bowyer and M.G.Bader, J. Mater. Sci., 7, 1315 (1972). 28.J.L.Thomason, Composites Part A 33, 1283 (2002).
29.J.L.Thomason, Compos.Sci.Technol. 62, 1455 (2002). 30.J.L.Thomason, Composites Part A 33, 331 (2002). 31.J.L.Thomason, Compos.Sci.Technol., 61, 2007 (2001) 32.A.Kelly and W.R.Tyson, J.Mech.Phys.Solids, 13, 329 (1965) 33.J.L.Thomason and G.Kalinka, Composites Part A 33, 85 (2001).
34.N. Sato, T. Kurauchi, S. Sato, and O. Kamigaito, J. Mater. Sci., 19, 1145 (1984). 35.J.G.Williams, “Fracture Mechanics of Polymers”, John Wiley, Chichester England
1984
36.A.A.Griffith, Phil.Trans.R.Soc., A221, 163 (1920).
0 5 10 15 20 25 30 35 40
5 10 15 20 25
Diameter
Co
unt (
%
)
[image:16.612.94.520.61.349.2]P9 P10 C10 P14 P16 P18
Figure 1 Diameter Distributions Series A
0 5 10 15 20 25 30 35
5 10 15 20 25
Diameter
Co
unt (
%
)
P20W P18-9 P16-10 P20N
[image:16.612.91.519.399.699.2]0 5 10 15 20 25 30 35 40
5 10 15 20 25
Diameter
Co
unt (
%
)
[image:17.612.91.522.77.374.2]CP9 CP10 CP14 CP16 CP18
Figure 3 Diameter Distributions Series C
0 2 4 6 8 10 12 14 16
5 10 15 20 25
Diameter
Co
unt (
%
)
P20N measured P20N calculated
[image:17.612.92.520.402.703.2]0 5 10 15 20 25
5 10 15 20 25
Diameter
Co
unt (
%
)
[image:18.612.92.520.59.348.2]P20W measured P20W calculated
Figure 5 Comparison measured and calculated fibre diameter distribution for P20W
y = 1.0149x R2 = 0.9103
8 9 10 11 12 13 14
8 9 10 11 12 13 14
Blend Average Diameter Measured (μm)
Blend A
verage D
iameter C
alcu
lated (
μ
m)
[image:18.612.94.519.394.682.2]y = -0.4x + 105.3 R2 = 0.7
y = -1.7x + 117.9 R2 = 1.0
y = -6.4x + 163.2 R2 = 1.0
40 50 60 70 80 90 100 110 120
8 10 12 14 16 18 20
Number Average Diameter (μm)
No
rmal
li
s
ed
Pro
p
e
rt
y (%
)
Strength Modulus
[image:19.612.92.519.79.342.2]Unnotched Charpy
Figure 7 Normalised Mechanical Performance of Individual Diameter Samples
y = -6.5x + 166.1 R2 = 1.0
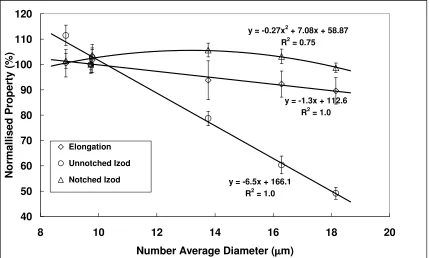
y = -1.3x + 112.6 R2 = 1.0 y = -0.27x2 + 7.08x + 58.87
R2 = 0.75
40 50 60 70 80 90 100 110 120
8 10 12 14 16 18 20
Number Average Diameter (μm)
No
rmal
li
s
ed
Pro
p
e
rt
y (%
)
Elongation Unnotched Izod Notched Izod
[image:19.612.92.521.406.664.2]7 8 9 10 11 12 13 14
8 10 12 14 16 18 20
Number Average Diameter (μm)
T
e
nsile Modulus (Gpa) Series A
[image:20.612.92.521.79.343.2]Series B Series C
Figure 9 Tensile Modulus vs Average Fibre Diameter – Diameter Blends
100 110 120 130 140 150 160 170 180 190 200
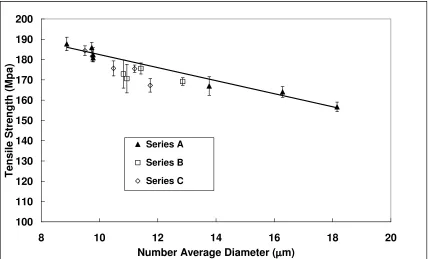
8 10 12 14 16 18 20
Number Average Diameter (μm)
Tens
ile
S
tr
e
ngth (
M
pa)
Series A Series B Series C
[image:20.612.92.520.384.643.2]1.6 1.8 2.0 2.2 2.4 2.6 2.8 3.0 3.2
8 10 12 14 16 18 20
Number Average Diameter (μm)
Te
nsile Elongat
ion (%
)
[image:21.612.92.522.81.341.2]Series A Series B Series C
Figure 11 Tensile Elongation vs Average Fibre Diameter – Diameter Blends
60 70 80 90 100 110 120
8 10 12 14 16 18 20
Number Average Diameter (μm)
Notc
hed Izod (J
/m
)
Series A Series B Series C
[image:21.612.97.520.382.646.2]0.4 0.6 0.8 1.0 1.2 1.4 1.6
8 10 12 14 16 18 20
Number Average Diameter (μm)
Unnotc
h
ed Izod kJ
/m)
[image:22.612.95.520.77.342.2]Series A Series B Series C
Figure 13 Unnotched Izod Impact vs Average Fibre Diameter – Diameter Blends
100 120 140 160 180 200 220 240 260 280
8 10 12 14 16 18 20
Number Average Diameter (μm)
U
n
not
che
d Cha
rpy
(J
/m
) Series A
Series B Series C
[image:22.612.92.519.383.647.2]4.0 4.5 5.0 5.5 6.0 6.5 7.0 7.5
8 10 12 14 16 18 20
Number Average Diameter (μm)
Tens
ile Modulus (Gp
a
)
[image:23.612.93.519.78.344.2]Series A Series B Series C
Figure 15 Tensile Modulus vs Average Fibre Diameter – Hydrolysis Conditioned
1.5 1.7 1.9 2.1 2.3 2.5 2.7 2.9 3.1 3.3 3.5
8 10 12 14 16 18 20
Number Average Diameter (μm)
Tensile Elon
gation (%)
Series A
Series B
Series C
[image:23.612.93.521.391.684.2]100 120 140 160 180 200 220
8 10 12 14 16 18 20
Number Average Diameter (μm)
Unnotched Cha
rpy (J/m)
Series A
Series B
[image:24.612.93.520.80.372.2]Series C
Figure 17 Unnotched Charpy vs Average Fibre Diameter – Hydrolysis Conditioned
60 65 70 75 80 85 90 95
8 10 12 14 16 18 20
Number Average Diameter (μm)
Tensile Stre
ng
th (MPa)
Series A
Series B
Series C
[image:24.612.93.518.415.702.2]20 30 40 50 60 70 80 90 100 110
8 10 12 14 16 18 20
Number Average Diameter (μm)
No
rmal
li
s
ed
Pro
p
e
rt
y (%
)
[image:25.612.93.519.78.343.2]TS Dam TS HY TM DaM TM HY UC Dam UC HY Linear (TS HY)
Figure 19 Summary Diameter Effects - DaM vs Conditioned Performance
0.2 0.3 0.4 0.5 0.6 0.7
8 10 12 14 16 18 20
Number Average Diameter (μm)
Av
er
a
g
e Lengt
h
(m
m
)
Single W av Single N av P l (Si l N )
[image:25.612.90.521.397.658.2]0.2 0.3 0.4 0.5 0.6 0.7
8 10 12 14 16 18 20
Number Average Diameter (μm)
Av
er
a
g
e Lengt
h
(m
m
)
[image:26.612.93.521.77.342.2]Single W av Single N av Blend W av Blend N av Poly (Single
Figure 21 Average Residual Fibre Length vs Average Fibre Diameter - Fibre Blends
0.2 0.3 0.4 0.5 0.6 0.7
8 10 12 14 16 18 20
Number Average Diameter (μm)
Average Length
(mm)
Series A
Blends
P18-9
CP16
CP18
P16-10
[image:26.612.93.520.402.686.2]Figure 23 Average Orientation Parameters vs Average Fibre Diameter
0.60 0.65 0.70 0.75 0.80 0.85
8 10 12 14 16 18 20
Number Average Diameter (μm)
Or
ie
nta
tion Factor
P18-9
CP16
CP18 P16-10
[image:27.612.95.521.384.672.2]0.55 0.60 0.65 0.70 0.75 0.80 0.85
20 40 60 80 100 120
Weight Average Fibre Aspect Ratio
Or
ie
nta
tion Factor
[image:28.612.91.523.78.370.2]Current Previous
Figure 25 Average Orientation Parameters vs Average Fibre Aspect Ratio
y = -0.57x + 32.27 R2 = 0.87
y = -0.76x + 39.86 R2 = 0.99
22 24 26 28 30 32 34
8 10 12 14 16 18 20
Number Average Diameter (μm)
Pr
ed
icted
IF
SS
(MPa)
IFSS Series A IFSS Previous
[image:28.612.91.522.420.685.2]y = 0.93x + 0.01 R2 = 0.98
2.0 2.1 2.2 2.3 2.4 2.5 2.6 2.7 2.8 2.9 3.0
2.0 2.1 2.2 2.3 2.4 2.5 2.6 2.7 2.8 2.9 3.0
Experimental Composite Strain (%)
P
redict
e
d Fibr
e
S
tr
a
in (%
[image:29.612.92.521.80.341.2]) Series A Series B Series C Linear (Series
Figure 27 Comparison Fibre Strain vs Composite Strain at Failure
90 95 100 105 110 115
8 10 12 14 16 18 20
Number Average Diameter (μm)
Notc
hed Izod (J
/m
)
30 35 40 45
Fibre
Aspe
ct
Ra
tio
[image:29.612.93.521.399.658.2]y = 11.92x + 3.78 R2 = 0.84
50 55 60 65 70 75 80 85 90 95 100
4.0 4.5 5.0 5.5 6.0 6.5 7.0 7.5 8.0
Vf.L/D
Fibr
e
C
on
tr
ibution NI (J
/m)
[image:30.612.93.522.80.340.2]Series C Series B Series A
Figure 29 Fibre Contribution to Notched Impact
40 50 60 70 80 90 100 110
8 10 12 14 16 18 20
Z Average Diameter (μm)
No
rm
ali
s
ed
P
e
rf
o
rman
c
e
(%
).
TS Blend TS Single UI Blend UI Single
[image:30.612.90.522.393.651.2]