Rochester Institute of Technology
RIT Scholar Works
Theses
Thesis/Dissertation Collections
2007
Analyzing Metallic Gloss Using a
Micro-Goniophotometer
Saara Suni
Follow this and additional works at:
http://scholarworks.rit.edu/theses
This Thesis is brought to you for free and open access by the Thesis/Dissertation Collections at RIT Scholar Works. It has been accepted for inclusion in Theses by an authorized administrator of RIT Scholar Works. For more information, please [email protected].
Recommended Citation
Analyzing
Metallic GlossUsing
aMicro-Goniophotometerby
Saara SuniAthesissubmittedinpartialfulfillmentoftherequirements forthedegreeofMasterofScience
intheSchoolofPrint Media
intheCollegeof
Imaging
ArtsandSciences oftheRochester InstituteofTechnology
May
2007School of Print Media
Rochester Institute of Technology
Rochester, NY
Certificate of Approval
Master's Thesis
This is to certify, that the Master's Thesis of
Saara E. Suni
has been approved by the Thesis Committee as
satisfactory
for the thesis requirement for the Master of Science degree
at the convocation of
May 2007
Thesis Committee:
Franziska Frey
Primary Thesis Advisor
Franz Sigg
Secondary Thesis Advisor
Illegible Signature
Technical Consultant
Illegible Signature
Graduate Thesis Coordinator
Illegible Signature
Graduate Program Coordinator
Illegible Signature
Permission to reproduce thesis
Analyzing Metallic Gloss using a Micro-Goniophotometer
I,
Saara Suni, hereby grant permission to the Wallace Memorial
Library of RI.T, to reproduce my thesis in whole or in part. Any
reproduction will not be for commercial use or profit.
Acknowledgments
Aspecialthankyoutomembers ofmythesiscommitteeforalltheassistance.Iwould also
liketothankmyfriendsand
family
forbeing
thereforme andhelping
methroughthisTableofContents
ListofFigures.
.iv ListofTables
vii
Chapter 1
Introduction \
Chapter2
TheoreticalBasis 3
Measuring
ReflectedLight 3Bi-directionalReflectionDistribution Function. 7
Polarization 8
Chapter 3
ReviewoftheLiterature 10
MetallicPigments 10
Materials 10
Technology
andManufacturing
11Particle SizeandShape 13
Pigment Classifications 14
UseofMetallic Inks 14
Visual Effects 16
Metallics in
Packaging
17ProcessControl 17
Color Management 17
Controlling
thePress 18RealLifeApplications 20
Conclusionforliteraturereview. 21
Chapter4
Research Questions 23
Experiment1:
Detecting
Difference
between Sampleswith aLarge Visual Difference. 23 Experiment2:Detecting
Difference between SampleswithaSmall Visual Difference. 23 Chapter5Methodology. 24
The Device
Setup
25TheCameraandthePolarizers 27
Measurement Procedure 30
Exposure Control ....31
Image DataAnalysis 32
Calibrating
theInstrumentUsing
aKnown Reference 33ImageAnalysis Procedure 34
Chapter 6
Results 38
DeviceCalibration
Using
aKnown Reference 38Presenting
theResults 43Detecting
Difference between Sampleswith aLarge Visual Difference 44CompositeImage 44
Red Channel. 47
Green Channel 50
Blue Channel 53
Detecting
Difference between Sampleswith aSmall Visual Difference 56Composite Image 56
GreenChannel 62
BlueChannel 65
Chapter7
Summary
andConclusions 69CapabilitiesoftheDevice 69
Detecting
Difference between Sampleswith aLarge Visual Difference. 69Detecting
Difference betweenSampleswith aSmall Visual Difference 69Issueswiththe
Methodology
70Polarizer
Setup
70Exposure Time 71
Aperture
Setting
71Device
Geometry
71Suggestions for Further
Study
72Repeated Measurements 72
Exposure Time Optimization for Each Channel 73
Blue Channel BRDF Shape 73
Analyzing
Bulk Reflectance 74Polarization
by
Reflection 74Neglected Feature Vectorelements 75
Reflectance Factors 75
ResolutionofParticles 76
ListofFigures
Figure 1.Specularreflectedlight 4
Figure 2. Bulkreflectedlight fora singleray 4
Figure 3. Bothspecular andbulkreflectiontakeplace 4
Figure 4. Reflectiongeometryandterms 5
Figure 5. Sample BRDFcurve 7
Figure 6. Basicprinciple ofpolarizing filters 8
Figure 7. Comparisonof conventional andVMPpigments 12
Figure 8. Comparisonofinkwith conventional andVMPpigments 12
Figure 9. The differenceof
leafing
andnon-leafingpigmentsinanink layer 14Figure 10. The setupofthemicro-goniophotometer 25
Figure 11. The geometryofthemicro-goniophotometer 25
Figure 12. Bronzedsample mounted onthevertical cylinder 26
Figure 13.Themicro-goniophotometersetup,as seenfromabove 27
Figure 14. Thepolarizer mountedin frontofthecameralens 28
Figure 15. Nikon D50 Camera Controls 29
Figure 16.Thepolarizerscale 30
Figure 17. ScreenshotofImageJ 31
Figure 18. Image histogram in ImageJ 32
Figure 19. Mathcadscreenshot 35
Figure20. TheangularlimitsforthisspecificBRDFcurve 37
Figure21. Referencesamplecompositeimagegloss 38
Figure23.Referencesamplegreenchannel gloss 39
Figure 24. Referencesamplebluechannel gloss 39
Figure25.Referencesample compositeimage BRDF. 40
Figure 26. ReferencesampleredchannelBRDF. 40
Figure 27. ReferencesamplegreenchannelBRDF. 41
Figure 28.ReferencesamplebluechannelBRDF. 41
Figure 29. Areabetween-30and30
degrees,
comparedtotheentire curve area. 42Figure 30. Silversamplecomposite glossimage 45
Figure 31. Bronzedsamplecompositeglossimage. 45
Figure 32. BRDFcomparison ofthesilver andbronzedsample,compositeimage 46
Figure 33. Normalized BRDFcurves,silver andbronzedsample,compositeimage 46
Figure 34. Silversample red channel gloss 48
Figure 35. Bronzedsample red channel gloss 48
Figure 36. BRDFcomparison ofthesilver andbronzedsample red channel 49
Figure 37. Normalized BRDFcurves,silver andbronzedsample redchannel. 49
Figure 38. Silversample green channel gloss 51
Figure 39. Bronzedsamplegreen channel gloss 51
Figure 40. BRDFcomparisonofthesilver andbronzedsample greenchannel 52
Figure 41. Normalized BRDFcurves,silver andbronzedsample green channel 52
Figure 42. Silversamplebluechannel gloss 54
Figure 43. Bronzedsamplebluechannel gloss 54
Figure44. BRDFcomparisonsofthesilver andbronzedsample,bluechannel 55
Figure 45. Coatedsample compositeimagegloss 57
Figure 46. Uncoatedsample compositeimagegloss 57
Figure 47. BRDFcomparisonsofthecoated and uncoatedsamples,compositeimage 58
Figure 48. Normalized BRDFcurvesforthecoated anduncoatedsamples,composite
Figure 49. Coatedsampleredchannel gloss 60
Figure 50. Uncoatedsampleredchannel gloss 60
Figure 51.BRDFcomparisonofthecoated anduncoatedsamples,redchannel 61
Figure 52.Normalized BRDFcurvesforthecoated and uncoatedsamples,redchanneL...61
Figure 53.Coatedsamplegreenchannelgloss 63
Figure 54.Uncoatedsample greenchannel gloss 63
Figure 55.BRDFcomparisonofthecoated and uncoatedsample,green channel 64
Figure 56. Normalized BRDFcurvesforthecoated and uncoatedsamples,green channel64
Figure 57. Coatedsamplebluechannel gloss 66
Figure 58. Uncoatedsamplebluechannel gloss 66
Figure 59. BRDFcomparison ofthecoated and uncoatedsamples,bluechannel 67
ListofTables
Table 1.Feature Vector Components 36
Table 2.Referenceareasmeasuredand corrected 43
Table 3. Feature Vector
Comparison,
compositeimage 47Table 4. Feature Vector
Comparison,
red channel 50Table 5. Feature Vector
Comparison,
green channel 53Table 6. Feature Vector
Comparison,
bluechannel 55Table 7. Feature Vector
Comparison,
compositeimage 59Table 8. Feature Vector
Comparison,
red channel 62Table 9. Feature Vector
Comparison,
green channel 65Abstract
Metallicinksareinwidespreaduseinthegraphic arts
industry,
buttherecurrentiyisnowayto"puta
number"
on metallic gloss. Process-controlmethods,such as
densitometry,
whichanalyzeshow light isabsorbedintotheinklayer,
are not usableformetallics,since
hardly
any lightgets absorbed.Inaddition,it isverydifficulttosee visualdifferences whentheink film thicknesscrosses a certainthreshold.
Dr. Jonathan
Arney
attheChester F. Carlson Center forImaging
ScienceatRochester Instituteof
Technology
(RTT)
has beenusinga micro-goniophotometerforanalyzingpaper gloss on a microstructure
level,
andinthis exploratoryresearch, thedevicewas usedtoanalyze metallic prints.Twosets of measurements were madetodeterminethe
device'stoleranceand range.Inthefirstexperiment, twovery differentsamplesvisually
were measuredtodetermine ifthedevicecandetectthedifference. Thesecond experiment
consisted ofmeasuringtwovisuallysimilar samplestodetermine ifthedevicecandetect
thissmall visualdifference.
Theresults showedthat thedevicecandetectthelargevisualdifference inthefirst
experiment, thedifferencewas observableinthegloss
images,
as well asinthenumericaldata. Inthesecondexperiment,asmalldifferencewas
detected; however,
without repeatedmeasurements,therewas nowaytorule outthedifference
being
causedby
experimentalfactorsand noise.
Overall,
theresultsshowedthatthemicro-gomophotometer canbeusedChapter
1Introduction
Theuse ofmetallicinks introduces a challengetoprint processcontrol,since
"traditional"
processcontrolmethods, such as
densitometry,
which analyzeshowtheinkfilmabsorbs
light
are not useful.This is becausethepigment particlesinmetallicinkarelike
tiny
mirrorsthatreflecttight;
thus,hardly
anylight isabsorbed.Visually,
it ispossibletoseedifferences inmetallic prints whenvaryingpigmentsize andink film thickness, butthereisnowayto"puta onthemetallic
properties.Even forthemost skilled pressoperator,visualjudgmentaloneisnot good
enoughforproper process control.Changes in inksettings atverylow ink film levelsare
easytodetectvisually,butonce enough metallic particles aretransferredtocoverthe
wholesurface,addingmoreink
hardly
changestheappearance oftheprint.Having
awaytodetenninethis thresholdwould
help
preventusingmoreinkthanwhatisneeded andwouldincreasecost-efficiency,and prevent problems caused
by
thickink film layers.Inadditionto
finding
a measure ofthisthreshold,another area ofinterest istofindawaytonumericallycharacterizethe
"metallicness"
of metallic prints.Metallicprints are
often coated with alacquertoprotectthemetalparticlesfromrub-off andtoaddadditional
gloss; thisadditional gloss makesitevenmoredifficulttodetectwhat glossismetallicin
natureand whatis onlyspecularsurfaceglossfromthecoating.The coatingthus takes
mixedintothelacqueritselfaswell
(Lenz,
2005).This,
in turn,makesiteven moredifficulttoanalyzethemetallic glossoftheactualink layer beneaththecoating.
Rosenberg
(2001)
hasdevelopedamethodology foranalyzingmetallic glossusingaspectro-goniometer, usingthedevicetoanalyzethecolor of gloss.Rosenberg'smethod
canbeusedtodifferentiate betweencopper and goldgloss,becausetheirglosshasa color
componenttoit Itcannotbeusedtoanalyze silverbecausesilverhasnoapparentcolor,
thus
having
differentspectral propertiesthancopper and goldRosenberg'smethod usestwodimensionstocharacterize metallicness: thespectral component andthegloss.
Amicro-goniophotometercanbeusedtoapproach metallicnessinadifferentway,
analyzingthegloss component atthemicrostructurallevel.Theresearcher was unaware of
anyother researchdoneonanalyzingmetallic glossusingamicro-goniophotometer;thus,
theresults ofthisresearch were unpredictable.Theprospectof
doing
new research was abig
motivator.Ifa micro-goniophotometer couldbeusedtocharacterize metallicness andmetallic gloss at a particle
level,
itmighthelp
inthedevelopmentofnewtools forprocesscontrol.
Theresearcherbecame interested inthis topicin
May
2006afterdiscussionswithProfessor Franz Sigg. Theresearcherdidnothavethatmuch priorknowledgeofthetopic,
buttheideaof
doing
fundamentalexperimental research wasveryappealing.Also,
workingwith metallic printsisvisuallymorepleasingand
interesting
thanworkingwithChapter
2TheoreticalBasis
Understanding
themathematicalbasisandtheoptics ofhow tightreactswithsubstratesisimportantwhenattemptingtointerpretthedata fromthe
micro-goniophotometer.
Measuring
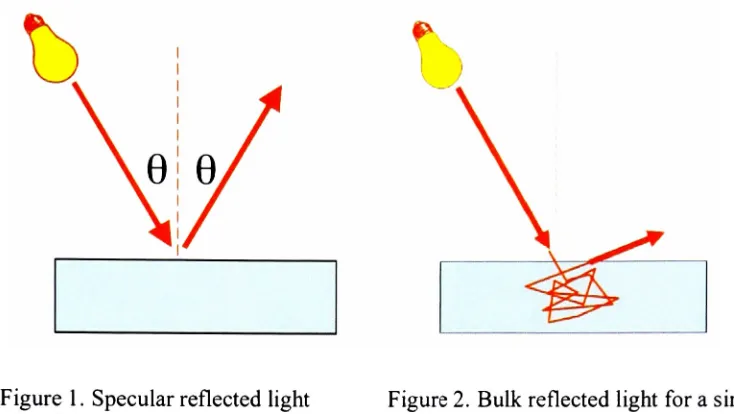
Reflected LightTherearetwokindsof reflectedlight: specular andbulk. Specular light isthelightthat
reflects at aninterface betweenmaterials ofdifferentrefractiveindexes. Bulk tight
penetratesthe substrate,undergoes multiplescatteringeventsinsidethe substrate,and
re-emerges at a randomangle. Specular light isonlydetectedatthespecularangle,whichis
equalto theangleofentry,as showninFigure 1. Bulkreflectedtightre-emergesthebulk
ofthematerialina randomdirectionafter
being
penetratedto thebulkofthematerial andhaving
gonethroughmultiplescatteringeventsinsidethematerial(Arney,
2006a). Figure 2Figure 1. Specularreflectedlight (Source:
Arney, 2006a)
Figure2. Bulkreflectedlight fora singleray
(Source:
Arney,
2006a)
Formostobjects,both kindsofreflectingtakeplace simultaneously. Iftheobject
surfaceissmooth and"shiny"it isvery easytotellthespecular andthebulkcomponent
apart,becausethespecular componentisrelativelymuchstronger,as showninFigure 3.
Figure3. Bothspecularand bulkreflectiontakeplace
(Source:
Arney,
2006a)
Specularlightcanbe describedas
"gloss,"
anditcanbeexplained
by
Fresnel'slaws,
which can calculatethefractionoflightthatgets reflectedatthesurface andthefractionoflightthatgetstransmittedintothemedium.
(Arney,
2006a).According
to [image:17.524.193.346.359.510.2]transmissionofelectromagneticwavesat aninterface.That
is,
they
givethereflection andtransmissioncoefficientsforwavesparalleland perpendiculartotheplaneof
incidence."
Figure4illustratesthereflectiongeometryand
terrninology
usedinFresnel's law.Incident light
Figure 4. Reflectiongeometryandterms
(Source: Georgia State
University, 2006)
In Figure 4 II standsforparallel and
-1-forperpendicular. Thereflection r and
transmission tcoefficients are calculated withthe
following
equations,where"pa"
stands
forparallel,
"pe"
forperpendicular and
Q
andft
standfortheangles ofincidenceandtransmission,respectively.
Here,
"parallel"
means parallel to theplane of
incidence,
and"perpendicular"
means perpendicularto theplane of
incidence,
orinotherwords,parallelto the
interface,
asillustratedin Figure 4.r =
tan
(0-0
1)r =____!!<__!__
(1)
"
tan
(ft
+0,)
" sin(0,4-0,)
2sin0.cos0f
2sin0.cos0. ...t = t = -
(2)
"
Thevalues obtainedusingtheseformulasarefractionalamplitudes,andthese
values mustbesquaredtogetfractional intensities.Duetoconservationofenergyand no
light
being
"lost"intheprocess,the
following
relationship appliestoboththeperpendicularandtheparallelcases:
, ,n9cos0,
r+t
i=l
(3)
njcos0j
Here,
n2is therefractiveindexofthemediumthat thetightpenetratesinto,
andnjistherefractiveindexofthemedium wherethetightcomesfrom.
By
squaringthevaluegotten
from,
forexample,r^theresultisthefractionoftightthatisreflectedintheparalleldirection.
Subtracting
thisresultfrom1,
theresultisthefractionoftightthatistransmittedintheparalleldirection (Georgia State
University,
2006).Theseequations showthattightiseither reflected ortransmitted,andinthisresearchthebehavioroftightwith metallic
surfacesis looked into inmoredetail.
Inordertoobtaina reflectedtightreadingacross all angles ofthesamplesurface,
threeapproaches canbetaken.The firstmethodistomovethetightsource acrossthe
sample surface while
keeping
the camera,ortheinstrumentthatcapturesthetight,
stationary.Thesecond methodistomovethecameraacrossthe surface,
keeping
thelightsource stationary.Thethirdmethodisto
keep
thetightsource andthecamerastationary,andtowrapthesample arounda roundcylinder, sothatalargerange of angles are
Bi-directional Reflection Distribution
FunctionWhenthesurface radianceismeasuredat all possibleangles, theresultistheBi
directional Reflection Distribution
Function,
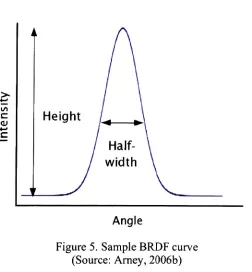
orBRDF.WhentheBRDFdiagram isexamined,thespike representsthespecular componentofthereflectedtightandthe
remainderofthearea underthecurvethebulkreflectedtight Thetotalareaunderthe
curveisthe totalreflectedlight
(Arney,
2006a).AsampleBRDFcurve withthedifferentparametersisshowninFigure5.
C
[image:20.524.142.394.264.536.2]Angle
Figure 5. SampleBRDFcurve
(Source:
Arney,
2006b)
Theshape oftheBRDFcanbe interpretedas a measure ofthe topographic
properties ofthe surface, makingthemeasurement similarto thatof a profilometer. The
differenceisthata profilometermeasurestheheightandvariationofthe surface,while a
variationintheangle ofthereflectedtight.Themetrics,such as curveheightand curvehalf
width,can alsobeanalyzedforextra significance
(Arney,
2006b).Polarization
Light isanelectromagneticwave andtheelectricforce fieldthatmakesupthewave
canvibrateupanddown (intheverticalplane),fromsideto side(inthehorizontalplane),
orinanintermediatedirectionthatis in betweenthehorizontaland vertical planes.This
kindof waveis also called atransverse wave,becausethewave vibrates perpendicularto
thedirectionof propagation.
Ordinarily
arayoftightconsists of a mixture of wavesvibrating in different directions. Ifthetight onlyvibratesinone
direction,
thistightispolarized.
(Anon,
2004;
Murphy,
Spring
&Davidson,
2007)
Apolarizingfilteronlylets tightwith a certainvibrating plane passthrough.
By
placingtwofilterscrossed,i.e.at90 degreeangles, thisstops alltight frompassing
through.
(Murphy
et.al,2007)
This is illustratedfurther in Figure.Polarizer 1 (Vertical)
Incident Beam (Unpolarized)
Polarizer2 (Horizontal)
Vertically Polarized Light Wave
Figure6. Basicprinciple ofpolarizingfilters
Inthis study polarizingfiltersare usedto tellapartbulkand specular reflectance.
Specularreflectedtight(Figure
1)
maintainsitspolarizationcharacteristicswhenbeing
reflected offthesurface,whilethepolarizationofbulkreflectedlight (Figure
2)
changesafterre-emergingfromthesubstrate.Whentwopolarizing filtersarecrossed,notightgets
through,unlessthetightgetsdepolarizedor changes polarization while
being
betweentheChapter
3ReviewoftheLiterature
Studying
metallicinkbehaviorrequiresknowledgeof metallicinkproperties andmanufacturing.
Knowing
howandwheremetallicinks are usedhelpsunderstand whatkindofbehavior isexpected oftheinks. Processcontrol and color management arediscussed
briefly
togiverelatedbackgroundinformationtodiscussing
thespecial requirements ofprocess control with metallicinks.
Metallic Pigments
Materials
Aluminum,
copper,and zinc arethemost common metals usedinmetallic pigmentmanufacturing. Aluminum hasnoinherentcolor;it isusedforsilvereffects,as well asfor
mixingwith other colorsto create,forexample,metallicblue. Copper isusedtogenerate
thecolor
bronze,
andby
mixingcopper withzinc,various shades of gold canbeachieved.When mixingcopperand zincintheproportion90:
10,
theresultisa reddish-yellowgold;themorezincisadded, themore yellowishthegoldbecomes. Theproportion70:30results
ingreenish-yellowgold
(Eckart,
2006b).Theraw materials usedforpigmentshavefluctuating
pricetrends,partlydueto therisingprice of oil.Thepricesforcopper andlooking
at alongertimespan,thepriceofcopperhasgoneup nearly 200%(Tonbridge,
2006).
Technology
andManufacturing
Conventional
Metallic Pigments.Theprocessbeginswithmeltingmetal pellets andthensprayingthemoltenmass underhighpressure sothat themolten metalformsafine
mist.Whenthesemistdropletscool
down,
they
areinpowderform. Theseparticles needtobe
flattened;
thisis doneby
a series ofmillingoperations,grindingtheparticles untiltheyareflakes. Theseare called"corn flakepigments" inthe
industry
becausetheshaperesembles cornflakeswiththeirrough edges.These "corn flakepigments" are
manufacturedfrom
irregularly
shaped atomized powder particles.Iftheatomizedparticlestakeasymmetricalspherical
form,
theresultingpigments are rounder and are called"silverdollars"
(Eckart,
2006b).Vacuum Metallized Pigments. Vacuummetallized pigment
(VMP)
manufacturingis different fromconventional pigment manufacturing.Theprocessbeginswiththe
application of a releasecoatingtoa carriersubstrate,such as polyester. Aluminumisthen
appliedto thecoatingvia physical vapordeposition. Thecarrier substrate withtherelease
coatingand aluminumlayers isthentaken toa solvent
bath,
wherethereleasecoating isdissolved,
releasingthealuminumcoatingto thesolvent.The finalstepis collectingthemetalfromthesolventandsizingitto thedesiredsize.
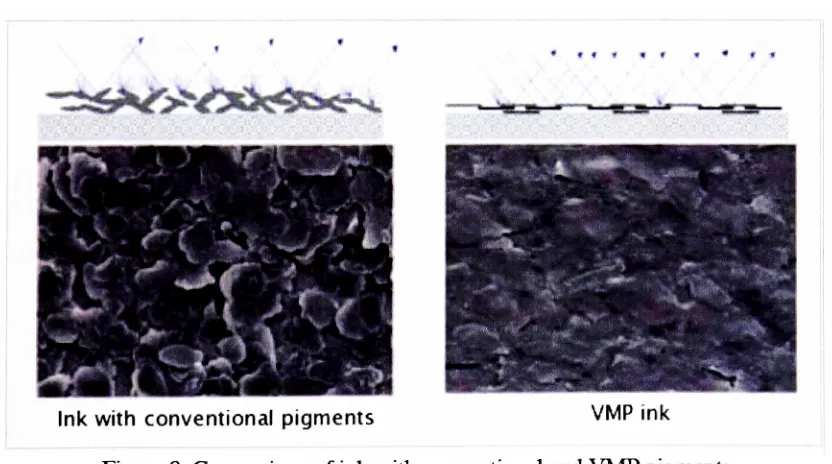
Eventhesmoothestsilverdollarconventional pigmentshavesometopographical
variationintheirpigment surface.When light hitsthesurface,itwill scattermoreor
less,
surfaceis verysmooth,makingthelightreflectwithout scattering.Electron-micrographs
comparingconventional"cornflakes"
toVMPpigments aredisplayedin Figure
7,
wherethedifferenceinsurface
topography
isevident.Conventional
aluminumflakes
VMP aluminumflakes
Figure 7. Comparisonof conventional andVMPpigments (Source:
Eckart,
2006)
VMPpigments alsoforma more uniform metal surfaceintheink
layer,
causinglesslightscattering,asillustrated intheelectron-micrographs and schematicillustrations in
Figure8.
VMP ink
V
. v
i~s"
*
-itiM
V/1 \\mt^BlKU^^BmmlKa\\a\\\\\m\\mmmmTWikWBa\m
[image:25.524.55.471.395.627.2]Inkwith conventional pigments
Embossed
VacuumMetallized
Pigments.Themanufacturingof embossed vacuummetallizedpigments,
EVMP,
is verysimilarto themanufacturingofVMPpigments.With
EVMP,
thereleasecoatinglayerisembossedusing laser technology, beforethealuminumisappliedusingphysical vapordistribution.Fromthere on, themanufacturingprocessis
thesame as withVMP.EVMPpigmentshavethe same characteristics asVMPpigments
whenitcomestoparticle characteristics.Themajordifference isthemicro-embossed
patterninthepigmentsurface,which givesthepigmentholographiccharacteristics, giving
themetallic shine a rainbow effectinthefinishedproduct
(Eckart,
2006b).Particle SizeandShape
The relationship betweenparticle size and various metallic propertiesis
straightforward.Asparticle size
increases,
sodoesthebrillianceeffect. This isbecause,
thereare more uniform surfacestoreflecttightonlargerparticles,andthereis lessof a
chanceofthetight
hitting
theparticleedge,which causes scatteringoflight. Whenparticlesize
increases,
thehalftone dot definitioncapabilitiesdecrease. This isbecause,
withlargerparticlesit is hardertoimagethe smallestimage details. Thepigment coverageabilityalso
decreases astheparticlesizeincreases. This is becausewithlargerparticlesit ismore
difficulttofill inthesmaller
"gaps."
There isno perfect pigmentparticlesize; theright
balancebetween brillianceanddot definition/coverageshouldbeconsideredforeach
application
(Eckart,
2006b).Particleshape alsohas an effect.Theconventional pigmentsare not assmoothas
the"silverdollars,"which are alsolargerin diameter. The "silver
dollars"
metallicproperties,but dueto theirsize,thehalftone dot definitionandcoverageis inferior
toconventional pigments. Thesameis truefor VMPpigments; theirexcellent metallic
propertiesarecounter-balancedwithdecreasedhalftone dot definitioncapabilities
(Eckart,
2006b).
Pigment Classifications
LeafingandNon-Leafing. Onewaytoclassifyconventional pigmentsis between
leafing
andnon-leafingpigments.Leafing
pigmentshavepoorwettingcapabilities;thus,they
"float"
to the
top
oftheink filmwhendrying,
creatingabrilliantmetallic shine.Thisis becausetheflatpigments andtheway
they
are orientedforming
a more uniform mirrorlikesurfacetoreflecttight.
Non-leafing
pigmentsdonothavethis property,andthey
aredispersed evenlywithintheink. Thiseffectis illustrated in Figure 9. Whencoatingtheink
layerwith a
lacquer,
thepigment properties also comeintoplay;lacquersadherepoorlytoinkswith
leafing
pigments,whiletheadhesionisgoodtonon-leafinginks(Eckart,
2006b).t^-'
>"WK_:--'- --Z:-7
--*?-.
\////////////T777TT7\
J?/?7t7Wfi??7ffm
Leafing Non-leafing
Figure9. The differenceof
leafing
andnon-leafingpigmentsinanink layer (Source:Eckart, 2006)
UseofMetallic Inks
Metallicpigments are presenteverywherefromcar paintstometallicinks in
stand outfromthecompetitors'
products.Consumersoften makethedecisionto
buy
or notto
buy
anitem insplitseconds,andiftheitemstandsout,it hasmoreof a chancetobepurchased. Consumersoftendonot evenrealizethat theeverydayproducts that
they
see atgrocerystoresareproductsthathavebeentailored toattracttheirattention.Forexample,
ShamrockFarms has been payingspecial attentionto thepackagingdesignoftheir
products,and
they
have been usingmetallicinksas a part oftheirstrategytomakeconsumersnotice and
buy
ShamrockFarms icecream,ratherthan theircompetitor'sbrand(Petrak,
2003;
Pianoforte,
2005).Themetallic effect canbeachievedthreewaysinprinting:foilstamping,printing
with metallic
inks,
andusingmetallic paper. Inaddition,applyingmetallic powdertoasurface can achievethedesiredeffect.Foilstampinggives excellent metallic effect and
coverage,but is onlycost-effectiveinrelativelysmall areas.Inaddition,foilstampingis
not suitableifthemetallic area needstobeprintedon,inwhichcase,usingmetallic papers
wouldbethebestoption.
Using
metallicinksgives mostfreedom becausethereisnoadditional equipmentneeded,andmetallicinkscanbeusedinprintingpressesinline
whenever needed. Themost advancedinks
today
can createfoil-likeeffects(Sharon,
2003,
2004; Pianoforte,
2005).Onewaytoproduce metallic effects withoutusingactualmetallicink istoprint a
silverimage
first,
thenprint with process colors ontop
ofit. Thistechnology
is calledMetalFX,
andithas becomemoreand more popularintheUS inthepastfewyears.Themajoradvantagetothissystemisthatvirtuallyunlimited metallic colors canbeprintedin
thesamepress run withouttheneedforallkindsofdifferentshades ofmetallicink
(Anon,
Intheprintingworld,metallic effectsarepredominatelyusedin packaging
printing,butusingmetallic effectsas
finishing
touchesis verycommoninall areas ofprinting
(Pianoforte,
2005). One specialty printingarea worthmentioningisprintingelectronic circuitsusingmetallicinks.
Currently
themost common printed electronicapplicationinuseisRFIDtags, where metallics are usedtoprint a small antenna on
variousitems.Newapplicationsfor printingwith metallics are
being
discussed constantly(Gasman, 2006; Hariharan,
2006).Visual Effects
Metallicscan createsmnningvisual effectsthatcannotbeachieved
by
normalfour-process color printing.Printersareusingmetallicsinnumerous waystoenhancetheprinted
product'sappeal,and customers are
demanding
more andmore,forcing
theprinterstofindnew creative waystouse metallic
inks, foils,
and papers.Thesenewwaystouse metallicsand
inks,
inparticular,havemadeinkmanufacturers such asEckartshifttheirfocus awayfrom
being
justa pigment providertobeing
theprovider ofhigh-performancemetallicinksforthegraphicarts
industry
(Toth,
2000).Becauseofthereflectivenature of metallic
inks, they
givebestresults when usedwith a coated paper stock.
Using
uncoated paper makestheprinted surface uneven sinceink isabsorbedintothe paper,resultinginreduced metallic properties.When printing
metallics on uncoatedstock, theink filmthicknessshouldbeatthemaximumlevelandthe
ink/watercontentminimizedtoavoid
diminishing
themetallicness.Printersalso usedry
trappinganddouble printingas waystoincreaseandtoenhancethemetallicproperties
Metallics inPackaging
Metallicinksand metallicshave beenusedinpackagingtomaketheproducts stand
outfromtheircompetitionandtocreatea certain airsurroundingtheproduct
Using
goldgives a sense oftradition,whileusingsilver makestheproduct seemhigh-techand
sophisticated.
Traditionally,
using foil stamping has beenthepreferredmethod,butwithtoday'sadvancesinmetallic
inks,
packaging designers have beguntoembracethemas aviablelowercostalternative
(Sharon,
2003,
2004).Specialty
packaging(suchasgiftwraps,creative packagesforcosmetics, and gift packagecartons)is onemajorarea where metallic
inksare used.The increaseduse of metallicsinpackaginghasalsobeensparked
by
thedevelopmentof new substratestouse
-card stock paperisnottheonlyviablealternative
anymore
(Lustig
2004; Sharon, 2003,
2004).Process Control
Controlling
theprint processincludesvariousactivities;afewofthemarediscussedinmoredetail below. Processcontrolisessentialifthefinalprinted pieceisto
matchtheoriginaldesignor proof.
Color Management
All devicesusedtocapture andoutputimageshavetheirowncharacteristics,and
expectingthemtointerpretcolorinformation
identically
is alostcause.Previously,
thisproblemwas solved
by
workinginclosed-loopcolorcontrolsystems withafixednecessaryadjustments.Butwiththenumberofdevices
increasing,
thiskindof systemisnolongerviable
(Sharma,
2004).Open-loop
color managementis basedon a centralized connectionspace,a"commonlanguage"
thatalldevicesunderstandThismakesitpossibleforalargenumber
ofdevicestocornmunicatewith andtounderstand each other.Each inputand outputdevice
isgivena profilethatdescribesthedevice'suniquecharacteristics,relativeto theprofile
connectionspace,wheretheotherdevicescaninterpret it
(Sharma,
2004).Colormanagementis importantwhenprintingbecausewhatthedesignersees on
thescreenmaynotbewhatis goingtocome out oftheprintingpressintheend.
Managing
deviceprofilesisneeded whensetting upaproofingsystem.Insoftproofing, themonitor
is adjusted sothatitsimulatestheprinted endresult,andin
hardcopy
proofing,a proofer ora
desktop
printerisconfiguredtoactlikethepressby loading
thepress profile ontothesystem
(Sharma,
2004).ControllingthePress
Whenrunninga multicolorpress,it isvitaltogetthedifferentcolorstoalign on
top
of each otherperfectly ;thisis done
by
controllingtheregistration.Virtually
all printjobshaveregistrationmarks(thincrosshairpatterns)ontheirnon-image areas neartheedges of
thesubstrate.Thereis apatternforeachsub-color,andif
they
printexactlyontop
of eachother, onlyone patternisobserved. Ifseveral crosshairs are seen, thepress canbeadjusted
by
moving theplate or platesthatneedadjusting.Registrationcontrolisthe same,noOncetheprintjob is inregister,thecolordensitiesshouldbeobserved.
Usually,
thereis a proof withknown
density
valuesthat thepress operators can use as atargetpoint.Inadditiontorelyingonregistrationmarks,printjobs usually featuretest targetsforcolor
accuracycontrol.Manualsystemshavetheoperatortakesamples fromthepress whileit is
ninning, thenmeasurethedensities fromthecolor patches.If
they
are not within a certainacceptablerange,thecorresponding ink keysare adjustedaccordingly, then the
measurements are repeated until allthe
density
values(i.e.,
all colorsthatthepressprints)are withinthe accepted range.Somemore sophisticated systemshaveclosed-loopprocess
controlfor bothregistration and
densities,
wherethecontrollingsystem samplestheprintrun at constant
intervals,
thenself-adjuststoadefinedgoal,basedonthatinformation.Whenusingmetallic
inks,
densitometry
isnotveryreliableformonitoringinking
levelsaccurately, and processcontrollingthepress runbecomesmoredifficult.
Proofingmetallics
Inkjet
technology
iscommonlyusedforgeneratingproofs oftheprintjob beforerunningitonthepress.
However,
metallicinkscannotbeused withink jettechnology
becausethepigment particles wouldclogtheink jetnozzles. Anothermethod ofproofing
issoftproofingon amonitor,wherethefinalizedprint productissimulated onthemonitor
usingcolor profilestoproducea color match. Butsoft-proofingmetallicshas itsown
problemsbecause simulatingmetallic shine and effects on amonitoris
difficult,
ifnotimpossible.
By
viewinga metallic color on a monitorittakesawaytheeffect ofthesurfaceproofs with metallicinksisthermal transfer technology.Issues withproofingmetallics are
further discussedinthe
following
section.RealLife Applications
Tofindouthowtheseissueswith processcontrollingmetallicsaredealtwithin
real
life,
theresearcherinterviewedMr. CalvinCurtice,
Senior Application EngineeratEastmanKodak (personalcommunications,
February
23,
2007). Mr. Curtice has beenworkingwiththeKodak Approval proofing device anddealswith customerswantingto
proofpackagingprintsthathavemetallics onthem.
Proofing
metallics cannotbe donewithink
jet,
becausethepigmentsclogtheinknozzles.Approvalusesthermal transfertechnology
andiscapable ofproofingmetallics. (EastmanKodak, 2007)
The Kodak Approval includessix process colors:cyan, magenta, yellow,
black,
orange, green,and
blue;
toachieve metalliceffects, a silverink isalso used.Toachievethedesiredmetallic effect andcolor, thesilverisprinted
first,
thentheprocess colors areprinted on
top
ofit. The device iscapable ofmaintainingthehalftonedot;
thus,thefinalresultlooks asif itwereprinted with a press.Ifthecustomer wants extra metallic
reflectance,itispossibletoprintthesilvertwice,andifthereflectance needstobetoned
down,
addingalittleblackoftenresultsinthedesiredeffect.(C.Curtice,
personalcommunications
February
23, 2007;
Eastman Kodak,2007)
Whenproofingmetallics,matchingtheproofstopresssheetsis donevisually.
According
toMr.Curtice,
thereare nostandardguidelines inplaceforthevisualinspection,
thusmaking matchingmetallicstricky.Sometimescustomerstry
tomatchthemetallics,thesemethodsdonot workthatwell.Visualinspectiontakesplacein viewing
booths,
andthecustomers ofteninspecttheproofinmultipleangles,dueto themetallicshine effect.
Having
somesort ofstandardfortheviewingconditions andinstructions forproofmatchingwouldsimplifytheprocess significandy.
Customerspayattentiontoboththemetallicshine andreflectance,andthemetallic
color.Thereflectanceisobserved when viewedat anangle,whilethecolorisobserved and
matched whenviewingtheproof at a90 degreeangle.Mr. Curtice saidthat often, the
customers"are asking forthe
impossible",
andthey
havetocompromise with eitherthedesiredmetalliccolor,orthemetallic reflectance and shine.
Conclusionfor literaturereview
Inthegraphic arts
industry,
metallicinksare usedpredominandyinpackagingdueto thevisual effects achieved.Metallicsmaketheproduct stand outfromthemasses.
Copperand aluminum arethemost common metals usedinpigment manufacturing.Notall
metallic pigments arealike,andthedifferent manufacturingprocesses givethedifferent
typesof pigments specific characteristics.Particlesize and shape alsohavean effect onthe
pigments '
characteristics.Theend use ofthemetallicink determineswhattypeof pigment
worksbest.
When printingwithmetallics process controlis not as simpleasit iswithusing
onlynormalprocess colors.Methodssuchas
densitometry
andcolorimetryare not asChapter
4ResearchQuestions
Totheresearcher's
knowledge,
themicro-goniophotometerhasnotbeenusedinanalyzingmetallicsbefore. Therearemany
interesting
topics toapproachinthis research;however,
gettingtoknowthedevice'slimitations, behavior,
and rangewhen usedformeasuringmetallicsisthemain area offocus. This study isanexploratorystudy,intended
togetpreliminary insightonhowthemicro-goniophotometer analyzes metallic print gloss.
Experiment 1:
Detecting
Difference between Sampleswith aLarge Visual DifferenceGiventwosamplesthatarevisually very differentandhave differentmetallic
properties,canthedevice detectthe
difference,
andif itcan,how doesthedifferenceshowupinthedata?
Experiment2:
Detecting
Difference between Sampleswith aSmall Visual DifferenceGiventhat themicro-goniophotometercandetectadrasticvisualdifference in
metallics,if it isusedtomeasuretwoverysimilarsamples,howsmall adifferencewouldit
Chapter
5Methodology
Theresearchmethodology is basedontheuse of a specialmicro-goniophotometer,
developed
by
Dr. JonArney
fromtheChester F. Carlson Center forImaging
ScienceatRTT. The devicecanbeusedtomeasure gloss of various substrates.Previousresearch
usingthisdevice has been done inmeasuringandcomparingthegloss ofdifferentcoated
substrates
(Arney
&Heo, 2004),
butneverbeforewith metallic prints.Simplegloss-metersmeasurejustat one angle ofincident tight Inordertoobtain a
glossreadingatcontinuouslychangingangles acrossthesamplesurface, threeapproaches
canbetaken.The firstmethodistomovethelightsource acrossthesample surface.The
second methodistomovethecamera acrossthesurface.Thethird method, theone usedin
this study,isto
keep
thetightsource andthecamerastationary,andtowrapthesamplewhichistobemeasuredaround a roundcylinder, sothatalargerange of angles are
capturedina singleimage
by
thecamera.Thecameraisusedtocapturetwoimages-one
withthepolarizers parallel andtheother onewiththepolarizerscrossed
(Arney,
2006a,
Camera Capture 2 images
Light
Source
[image:38.524.127.393.44.450.2]Cylinder
Figure 10. The setupofthemicro-goniophotometer
(Source:
Arney
2006a)
ample
Figure 11. Thegeometryofthemicro-goniophotometer
(Source:
Arney, 2006a)
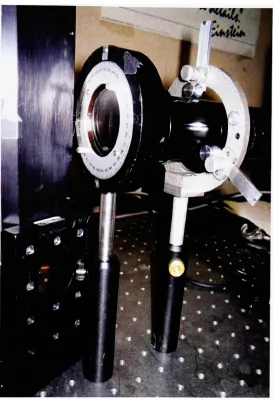
The Device
Setup
Themicro-goniophotometerusedinthesemeasurementsis butit usingadigital
camera with a
long
objectivelens,
a verticalmetal cylindertomountthe samples,and alightsourcetoiUuminatethesample surface.Thesampleismountedon a verticalcylinder
(diameter=4.6cm)
tightly
aroundthecylinder withoutdamaging
the sample,as showninFigure 12. Thecylinderdiameterislargeenoughsothat the samples,oftentimes coated, are notdamaged
[image:39.524.85.448.128.390.2]by
crackingwhenbeing
wrapped around the cylinder.Figure 12. Bronzedsample mounted onthevertical cylinder
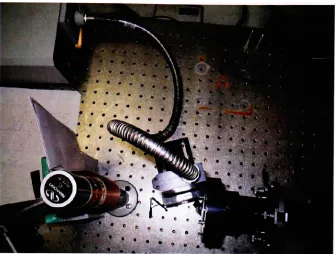
Inthis experiment, thesamplemountingcylinderisat a5.5 inch distance fromthe
polarizers,andthelightsourceis 3 inchesawayat anapproximately20 degreeangle.The
Figure 13. Themicro-goniophotometersetup,as seenfromabove
The CameraandthePolarizers
Thecamera,Nikon
D50,
hasalong
objective attachedtoit,
inordertoprovidetherequired magnification.Onepolarizeris mountedbetweenthelensandthesample andthe
other oneisattachedto thelightsource. Thepolarizerin frontofthetightsourceis fixed
andtheoneinfrontofthelenscanberotated360 degrees. Thepolarizerthatisattachedto
thetightsource polarizestheincident tightandbasedontheposition ofthesecond
polarizer, as wellashowthepolarizationchangedwhen
hitting
the sample, all or notightpassesthrough the secondfilter. Theproblem withthisarrangementisthat thereare no
predefined positionsforthecamerapolarizer; therotationisseamless andis done
by
handThereare markersthat
help
withthe alignment,buttheaccuracyofthepositioningvaries,depending
onwho operatesthedevice. Thepolarizerpositionedin frontofthecameralensFigure 14. Thepolarizer mountedin frontofthecamera
lens
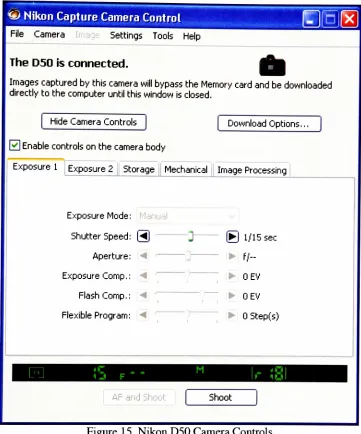
Thecamera exposuretimeiscontrolled on a computerinterface
by
changingtheshutterspeed, as shownin Figure 15. Thecontrolisa slider scale with pre-definedsteps,
ranging from 25secondsto1/4000second.Thepictureiscapturedusingthe computer
interface,
aswell; thereisno needtotouch thecameraitself.Theaperture controlislocatedselectedbeforethe measurementsaretaken,andthenthatsetting is keptconstant
throughouttheexperiments.
Nikon Capture Camera Control
File Camera Settings Tools Help
The D50 is connected.
Imagescaptured
by
thiscamera willbypasstheMemorycard andbe downloadeddirectly
to thecomputeruntilthiswindowisclosed.HideCameraControls DownloadOptions...
__]Enablecontrolsonthecamera
body
Exposure1 Exposure 2 Storage Mechanical
Image Processing
Exposure Mode: Manual
Shutter Speed: f!31 -i
<
__J1/15sec
Aperture: f/~
Exposure Cornp.: 4
'
OEV
Flash Comp.: <
\
OEVFlexible Program: < r
-OStep(s)
[image:42.524.87.448.105.539.2]AF arid..hoot Shoot
Figure 15. Nikon D50 Camera Controls
Oncecaptured,theimagesarestored onthecomputer atthelocationthatissetin
thecapturesettings.Thecapturedimages are renamedandlabeledto
identify
thepolarizersystem via"Download Thecustom curve givestheresulting imagesa gamma of
1,
makingthemradiometricallyas correctaspossibleby forcing
alinearrelationshipbetweentheinputlight
intensity
andtheoutputpixelvalues.Measurement Procedure
Themicro-goniophotometerisusedtocapturetwoimages. The first image is
captured withthepolarizersparallel,showingthespecular andbulkreflectance.Thenthe
polarizerin frontofthecameraisturned90
degrees,
sothat thepolarizers are crossed andtheimage iscapturedagain,nowshowingonlythebulkreflectance.This is sobecausethe
bulkreflectance,i.e.thelightthatpenetratesthesample andre-emerges,getsdepolarized in
theprocesswhilethespecularreflectance,i.e. thetightthatreflects offthe surface,remains
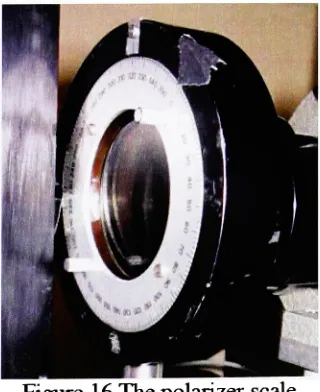
polarized.Toplacethepolarizersparallel, themarkerisalignedwiththe0mark onthe
scale,and whenthepolarizers arecrossed,it isrotated sothat themarker aligns withthe90
[image:43.524.188.348.454.650.2]degreemark onthescale.Thepolarizer scaleis shownin Figure 16.
Exposure Control
Theexposuretimeiscontrolled
during
theparallel polarizerphasesothat theresulting image hasnoover-exposedpixelsin it Thecapturedimageisopenedinanimage
editingsoftware,andthepixellevelsareexamined.
Checking
forover-exposedpixelsisdone separately forthe red, green,andbluechannels oftheimage. Even ifthecombined
image hasnoover-exposedpixels, thedifferentsub-channels mighthavethem.Inthis
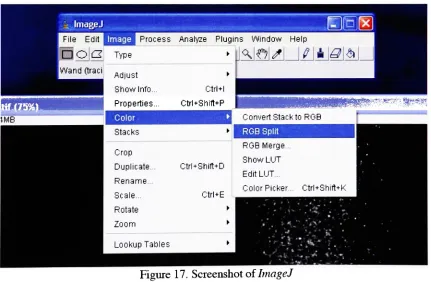
experimentImageJ,isusedforallimageeditingandinspectionpurposes.ImageJ isa
free,
open sourceimage editingsoftwareby
theNational InstituteofHealthand availableforanyplatformfrom htro://rsb.irdo.nm.gov/ii/index.html . Aviewofhowtheimagesplit
is done in ImageJ is shownin Figure 17.
Figure 17. ScreenshotofImageJ
Ifthereare morethanfivepixels withthevalue
255,
chancesarethatthey
areover [image:44.524.48.479.318.600.2]for checkingtheimagepixel values.Onemethodis toinspecttheimage
histogram,
whichshowshowtheimagepixelvalues are
distributed.
Theimagehistogram,
shownin Figure18,
has106pixelswiththevalue255,
soitisseverelyover-exposedand needstoberecapturedwithanother exposuretimesetting.
Having
over-exposedpixels present causesdata lossbecausethedetail differentiationis lost inthehighlights. Oncenone oftheimage
separations contain over-exposedpixels, theseparatedimage filesarelabeledandsaved.
Histogram ofImg0085
300x240 pixels;8-bit; 70K
r!li_0lt3
Count: 1504000
Mean: 24.568
StdDev: 33.966
Min:0
Max: 255
Mode: 4(162505)
List Copy Log
Value: 255
[image:45.524.146.385.212.482.2]Count: 106
Figure 18. Imagehistogram in ImageJ
Image Data Analysis
Whenthebestexposuresetting is
found
thecapturedimagesare enteredintoaprogramrunningin
Mathcad;
thisprogramwasdevelopedby
Dr. JonArney
tobeusedwithmicro-goniophotometric measurements.The basicoperation oftheprogramconsists
material measurementvalues; thentheprogram outputstheBRDFcurveandfeature
vector,
including key
dataanalysisfigures.Before anycalculationstakeplace,the referencevalueshavetobeobtained.The
measurementanalysisthattakesplaceintheprogram,comparesthemeasured valuesto the
valuesobtainedfrom measuringaknownreference,makingtheoutputvaluesrelative,not
absolute.
Calibrating
theInstrumentUsing
aKnown ReferenceInthis experiment, thereferenceisa piece of
black,
mattevinyl,whichhas beenused as a reference materialinother research
involving
themicro-goniophotometerdone intheChester F. Carlson Center for
Imaging
ScienceatRIT. Thematerialwas chosenbecause itasa mattesurface,it hasa wide range of gloss angles.
By
usingthisspecificmaterial as areference, theobtained results are comparabletoanyother measurementdone
withthe
device,
on samples ofanymaterial,aslong
asthesame reference material wasusedinthoseothermeasurements.
Measuring
thereference material requiresthesameprocedureastaking
measurementsofanyothermaterial.Thereferencematerialiswrapped aroundthecylinder
and
imaged;
afterthatthe checkingforover-exposed picturesis doneonImageJ forthered, green,andbluechannelsseparately.Theexposuretimeistweakeduntiltheresulting
images havenoover-exposedpixels,andthefinal imagesare saved.
Thereference materialimage file locationsareenteredintotheMathcadprogram,
specifying thereference area as 1. Separatecalculationsare madeforeachimagechannel.
isrecorded and used asthereferenceareawhenanalyzingsample
images,
thuscomparingallfurtherresultsto theresultsobtainedfrommeasuringthereference.
ImageAnalysis Procedure
Afterthereference analysisis
done,
thefile locations forthepolarizers crossedimageandthepolarizersparallelimageareinput intotheprogram.This is doneseparately
forallimagepairs
-the red,green andbluechannels,as well as thecomposite
image,
usingthereferenceinformation fromthe red, green,
blue,
and compositeimage,
respectively.
Theprogramproceeds
by
subtractingthepolarizers crossed(bulkgloss)imagefromthepolarizers parallel(allgloss)image fromeachother,resulting in just firstsurface
gloss.After this,theprogram performscalculations,resultingina plot oftheBRDFcurve,
thenoutputtingthe
key
dataelementsregardingtheBRDFcurveintoafeaturevector.A*
[Hi]
*-J <? S_<tf *,MySite (*Go
GoniophotometrlcAnalysis 17 June 2006 Mba
READBMP("brot_ed26_90_redt_")
MdbREADBMF("bro_d26_0_d.tif") Nrmtow<Mb) Nr-1000 Ncscols(Mb) Nc- 1504 (1) SpecifytheHorizontal Heldof viewInmillimeters: FOV=16.8 millimeters
II
d^33 9instB130 (2) Reference AreaandRl: Aia7 07
(3) ReferenceIDNumber REFa0
noa1 Default: Ar=no=1
(4) Specifyexposure constants: ta 15
3b800 Sca1 [Default: 1. 1 1]
(7) Picture Adjustment: ya1
ctLa-20 aRs20
ado=-27.995
Show
(A) BRDF tuvsn
Vdl..
WxRITEPRN("BRDF-silvM_green0112tit"):=DAT I 5.91 8.53 20.53 0.19 6.08 5.26 37.93 0.06 0.81 16.8
(B) FeatureVector
WxRITEPRN("Vec-SP_silver_green0112txt"
):=Vdat
0 A=Arearelativeto referencearea
1 whalf=halfpeak width indegrees 2 w10=peak width ath/10indegrees 3 h=peakheight
4 omax=stdevas%ofheightat peak 5 2ndmom.abt mean ofBRDF. 6 Glossas%ofidealized referencepeak 7 SkewnessoftheBRDF
8 Kurtosis=0fora normaldistribution 9 FOV inmm(horizontal)
[image:48.524.48.482.46.504.2]10Reference IDNumber v
Figure 19. Mathcadscreenshot
Theprogram outputs a gloss
image,
a rawdata BRDF (shownontheright)
and anormalizedBRDFcurve(inthe
bottom),
wherethepeakheightisset as 1. Thecoredatadrawn fromtheBRDFanalysisisthefeaturevector,whichcontainsnumericaldescriptors
abouttheBRDFcurve.The featurevectorisshownonthebottomright asthe tableof
referencesampleintoconsideration,butthereisno visual representation ofthiscalibrated
BRDFinthe
Mathcad
output.Thenumbers,suchaspeakheight,
fromthefeaturevectorcannotbeobservedinthecurveplots,duetodifferentscales
being
used.Themostimportant featurevectorcomponents,relatedtothisanalysis,arelistedin Table 1. In
additiontothese,thefeaturevectorcontainsadditional parametersfor
describing
theBRDFcurveshape.
Table 1. Feature Vector Components
(Source:
Arney,
2006b)
A AreaunderBRDF
W__f WidthofBRDFathalf-peak
h HeightofBRDF
Aftertheprogram outputstheinitial BRDFcurve, thecurve shapeis inspectedand
theleftandrightangularboundaries are adjusted.Theprogram calculates theareathatis
betweentheseangularboundaries.BecausetheBRDFcurveisasymptotic,
including
toomuchofthe"tails"inthecalculation would resultin misleadingresults,becauseall of
thesealmost-zero areas would add up.Theangularlimitsare chosen
by
theprogramoperatorsothatsomeofthe tailsare
included,
butnot all.This is becausethecurveisasymptotic andsummingupallthenear zerodataundertheendsofthetailswoulddistort
thearea measured.Thechoiceforangularlimitaffectsmosdythearea underthecurve and
thewidertheangularrange, thelargerthearea underthecurve willbe. Theangularlimits
tobechosen are evaluatedseparatelyforeachBRDFthatMathcadoutputs. Asan
guL= -20 <xR =
20
-40 -20
0
20
40
fXi,Xb
[image:50.524.132.393.99.345.2]Chapter 6
Results
DeviceCalibration
Using
aKnown ReferenceThe blackvinylmaterialwasimagedusingthemicro-goniophotometer andthe
imageswereinputtoMathcadtoobtainthereference areathatisusedinanalyzingthe
images fromtheother samples.Before Mathcadanalysis, thecapturedimagewas separated
intothe red, green,andbluechannels,resultingin fourpairs ofimagestobeanalyzed.
After
inputting
thedata intoMathcad,
thefollowing
resultswere obtained. Figures 21-24showtheimagesthatMathcad hascalculated
by
subtractingthebulkreflectedlight image(polarizerscrossed)fromtheall reflectedtight image (polarizersparallel).
Figure22.Referencesample red channel gloss
As seeninFigures21-24, thereis remainingglossintheleftandrightedges of
the
image,
signifyingthatthedevicecannot capturetheentire angular range ofthisspecificreference material. The devicecanonlycapture a range of+/-30
degrees,
andthereflectionfromthismaterialtakesplace at a wider range.Thismeansthatthearea under
theBRDFcurveisnotcompleteanddoesnot givethereal area.The BRDFcurves,as
output
by
Mathcad,
are shownin Figures 25-28.0.04
<Xi,Xb
Figure 25. Referencesample compositeimageBRDF
0.04
0.03-t_
=
c
0.02-0.04
[image:54.524.136.378.327.529.2]fXj,Xb
Figure 27. Referencesample green channelBRDF
0.04
0.03-V 0.02
0.01
-aj.Xb
Figure 28. ReferencesamplebluechannelBRDF
Othermicro-goniophotometer setupsbuilt inthe
laboratory
havedifferentangularranges,andthereferencematerialhas beenused with all ofthem. Theangular range
By
measuringthereference materialinadevicethathasa wide enough angularrangetocapture all ofthereflected
tight,
oneobtains abetterestimateofthearea undertheBRDFcurve.Becausethedeviceusedinthisexperimentcanonlycapturebetween-30and30
degrees,
thearea underthe"correct"BRDFcurve,betweentheseangles,iscalculatedfrommeasurementsdonewith anotherinstrument. This is done
by
measuringthe sampleonthisotherinstrumentandthen
defining
theangular ranges as -30and30,
andcomparingthatareato theone obtained withtheentire range andfromthiscomparisonacorrectionfactor
is obtained. Figure 29 illustratesthisrelationship.
Figure 29. Area between-30and30
degrees,
comparedto theentire curve areaInthis case, thecorrectionfactoris
1.9,
meaningthat theentire area underthecurveis 1.9timesbiggerthan theareajustbetween-30and30degrees.Alltheareas obtained
frommeasuringthereference material are multipliedwiththis number,before
being
usedas thereferenceareainother measurements.Thiscompensatesforthelossofdetail dueto
Table2.
Reference
areasmeasured and correctedAreameasured Areameasured x 1.9
Composite
image 2.39 4.54Red 2.13 4.04
Green 2.46 4.67
Blue 2.11 4.01
Inall oftheimageanalysisproceduresdone in
Mathcad,
thesecorrected referenceareas are used asthearea whichtocomparethecorrespondingsampleimage datato(for
examplethered reference area
being
used withthered channelimages.)
Presenting
theResultsThemeasurement results are presentedfor bothexperiments(page
22)
usingthesame structure.Theresultsforthecomposite
image,
red, green,andbluechannel aregroupedtogether,sothateachgroupcomparesthetwosamples accordingly.Withineach
group, theresults consistof glossimagesandBRDFcomparisons.Each group hastwo
gloss
images,
oneforeach sample.The BRDFcurves are presentedintwodifferentfigures. The first figureshowstheBRDFcurvesfromcompared samplesinthesamescale,
sothatthecurve sizes canbecompared visually.Thesame scaleisusedforall ofthese
BRDFcomparison curves(forthedifferentchannels andthecomposite
image)
within eachexperiment,sothat thereaderhasawaytovisuallycomparetheresultsfromdifferent
channels.ThesecondBRDFcurve showsthetwocurves normalizedtomaximumpeak
Detecting
Difference betweenSampleswithaLarge Visual DifferenceTodeterminehowthemicro-goniophotometerbehaveswithmetallics, twovisually
verydifferentsamples were measured.The firstsample was asilverycolor,possiblycoated
witha
lacquer,
whiletheotherone was a goldenbronzecolored one with no additionalcoating.The silverysamplehad very finepigments,whilethebronzeonehadverycoarse,
largerpigments.The silverysample wasprinted,whilethebronzesample was
bronzed,
asin dustedwithbronzepowder,andisnotactuallyprinted, thusmakingthe samplesdifferin
color,pigmentsize, and coating.Thesamples are referredtoas
"silver"
and
"bronzed"
throughout thedocument. Theanalysis resultedin fourpairs of glossimagestobe
compared,as well asfourpairs offeaturevectors andBRDFcurves.
Composite Image
Thespecular gloss
images,
as outputby
Mathcad,
forthecompositeimageareFigure 30. Silversample composite glossimage
Figure 31. Bronzedsamplecomposite glossimage
The glossimagesarevisually very
different,
whichis tobeexpectedbecauseofthedifferentsurface structure anddifferenceincoating.Thesilverimage hasthegloss
"focused,"
whereasthebronzed image hasthegloss spread out over alargerarea.This
same visualdifferenceis observedinthe red, green,andblueseparations,as well.The
BRDFcurvesare comparedin Figure
32,
andFigure33showsthecurves normalizedto thesame scale.The
key
featurevectorelementsfromthese twoBRDFcurves arepresentedinSilvervs.
Bronzed,
compositeimage 0.60 0.55 0.50 0.45 0.40 0.35 0.30 0.25 0.20 0.15 0.10 0.05\
Silver\
Bronzed 0.00-30 -20 -10 0 10
Angle,
degrees [image:59.524.134.395.53.319.2]30
Figure 32. BRDFcomparison ofthesilver andbronzedsample,
compositeimage
Silvervs.
Bronzed,
compositeimage, normalized1.0 A 0.9 0.8 * 0.7 cd *-6 __ 0.5 0.4 o z 0.3
\
Silver\
BronzedA
0.2//
\\
i
0.1
\JJ
Vl
0.0
-30 -20 -10 0 10 20 30
Angle,
degreesFigure33. Normalized BRDFcurves,stiverandbronzed
[image:59.524.122.394.338.615.2]Table3.Feature Vector
Comparison,
compositeimageSilver Sample Bronzed Sample
Area 11.0 4.7
W__f 4.3 9.5
h 0.56 0.14
ThestiverBRDFcurvein Figure 32shows a sharper peakthan thebronzedBRDF
in Figure
30,
supportingthevisual observation.Thesharper and narrowerthe peak, themore
"focused"
theglossis. Thesilver sample alsohas alargerarea undertheBRDF
curve,meaningthatmoretight isreflected andthatit isglossier.
Having
thebronzedcurvebewideris alsoconsistent,becauseawider curve meansthat theglossismoreevenly
distributedandthat thegloss peakisnot asdistinct. Whilethebronzedsampledoes havea
distinguishablepeak,it isnot as
"sharp"
as withthesilver sample.
Red Channel
Thespecular gloss
images,
as outputby
Mathcad,
forthered channelseparation ofFigure 34. Silversampleredchannelgloss
Figure 35. Bronzedsamplered channel gloss
Thesamedifference insurface structure canbeobservedfromthered channel
images,
as well.Becausethebronzedsampleis veryreddish, thered channelisthestrongestamongthedifferentseparations.The BRDFcurves are comparedin Figure
36,
andthecurvesnormalizedto thesamescale are presentedinFigure 37. The
key
featureSilver_red
vs. Bronzed_red0.60
0.55
0.50
\
Silver0.45
|>
0.40\
Bronzed|
0.35LI
"S
0.30jjj
0.25A
__ 0.20
/
\
0.15/
\
0.10/
\
0.05 ._yv.
-30 -20 -10 0 10 20 30
[image:62.524.121.402.55.312.2]Angle,
degreesFigure 36. BRDFcomparison ofthesilver andbronzed
sample red channel
CO T3 T3 -a CD N CO E _. o Z 1.0 0.9 0.8 0.7 0.6 0.5 0.4 0.3 0.2 0.1
Silver_redvs.
Bronzed_red,
normalized0.0 -30
\
Silver\
Bronzed-20 -10 0
Angle,
degrees [image:62.524.122.404.364.621.2]30
Figure 37. Nonnalized BRDFcurves,silver andbronzedsample
Table4.Feature Vector
Comparison,
red channelSilver Sample Bronzed Sample
Area 12.4 10.34
W__f 3.5 8.5
h 0.69 0.33
Thered channelisthedominantone withthebronzedsample, theobtainedvalues
being
significandy higherthanwiththecompositeimage. Whenthecompositeimagehasthebronzedareabe roughly 50% lessthan thesilverarea,herethedifferenceis
significandy less. Figure 36showsthatthecurve shapes arenearly
identical,
exceptforthesharppeak.Thesmalldifference inshapeis apparentin Figure
37,
which showsthebronzedsamplestill
having
thereflectedtightspread moreevenlyacross the range ofangles.
Green Channel
Thespecular gloss
images,
as outputby
Mathcad,
forthegreen channel separationFigure 38. Silversamplegreen channel gloss
Figure 39. Bronzedsample green channel gloss
The bronzedsample seemstohave less information inthegreenchannelthan the
silverimage
has,
judging
by
evaluatingthepixelbrightnessvalues visually.This is duetothecolor ofthesamples. Silveris a neutralcolor,
having
thedifferentchannelsbethesameintensity,
whilethebronzedsampleisreddishincolor,having
theredchanneldorninate.The BRDFcurvesare comparedinFigure 40andthecurves normalizedto thesamepeak
maximumheightarepresentedin Figure 41. The
key
featurevector elementsfromtheseSilver_green vs. Bronzed_green CO a o Si
&
0.60 0.55 0.50 0.45 0.40 0.35 0.30 0.25 0.20 0.15 0.10 0.05 0.00\
Silver\
Bronzed-30 -20 20 30
[image:65.524.125.409.48.295.2]Angle,degrees
Figure 40. BRDFcomparisonofthesilverandbronzedsample
green channel
Silver_greenvs.
Bronzed_green,
normalized<0 N m E 1.0 0.9 0.8 0.7 0.6 0.5 0.4 0.3 0.2 0.1
\
Silver\
Bronzed 0.0-30 -20 -10 0 10
Angle,degrees
30
Figure 41. Normalized BRDFcurves,silverandbronzedsample
[image:65.524.122.405.357.623.2]Table 5. Feature Vector
Comparison,
green channelSilver Sample Bronzed Sample
Area 10.9 3.2
W__f 4.4 10.8
h 0.54 0.09
The bronzedsampledoesnothaveaverydistinctpeak; theglossismore scattered.
Thearea ofthebronzedsampleisapproximatelyone-third ofthesilversample,andthe
peakheight is about one-sixth ofthesilversample peakheight. Theshapesarealso
significandy
different,
thebronzedsamplebeing
wide andshort, thesilver onenarrowandtall.Thesilver sample gives averysmoothBRDFcurve,butthebronzedsample curvehas
amplifiednoise closerto the tailsofthepeak.Thisnoiseisclippedoutbeforemakingarea
calculations
by
settingtheangularlimits,
thusmakingthedata in Table5 becomparabletotheotherdata fromthisexperiment.
Blue Channel
Thespeculargloss
images,
as outputby
Mathcad,
forthebluechannel separation ofFigure 42. Silversamplebluechannelgloss
Figure 43. Bronzedsamplebluechannel gloss
The bronzedsamplebluechannelimage is severelyunder-exposed; thereis
hardly
any datawiththeseexposuresettings andtheresulting analysisdata isincoherentand
mostiy justnoise. It isthusdiscarded from furtheranalysis and comparisons.Whenthis
eff