Accessing Developmental Information
of Fossil Hominin Teeth Using New
Synchrotron
Microtomography-Based Visualization Techniques
of Dental Surfaces and Interfaces
The Harvard community has made this
article openly available.
Please share
how
this access benefits you. Your story matters
Citation
Le Cabec, Adeline, Nancy Tang, and Paul Tafforeau. 2015. “Accessing
Developmental Information of Fossil Hominin Teeth Using New
Synchrotron Microtomography-Based Visualization Techniques
of Dental Surfaces and Interfaces.” PLoS ONE 10 (4): e0123019.
doi:10.1371/journal.pone.0123019. http://dx.doi.org/10.1371/
journal.pone.0123019.
Published Version
doi:10.1371/journal.pone.0123019
Citable link
http://nrs.harvard.edu/urn-3:HUL.InstRepos:16120935
Terms of Use
This article was downloaded from Harvard University’s DASH
repository, and is made available under the terms and conditions
applicable to Other Posted Material, as set forth at
http://
RESEARCH ARTICLE
Accessing Developmental Information of
Fossil Hominin Teeth Using New Synchrotron
Microtomography-Based Visualization
Techniques of Dental Surfaces and Interfaces
Adeline Le Cabec1,2,3*, Nancy Tang2,4, Paul Tafforeau1*
1ESRF—The European Synchrotron, 71, avenue des Martyrs, CS 40220, F-38043 Grenoble, Cédex 9, France,2Department of Human Evolutionary Biology, Harvard University, Cambridge, MA, 02138, United States of America,3Department of Human Evolution, Max Planck Institute for Evolutionary Anthropology, Deutscher Platz 6, D-04103, Leipzig, Germany,4Department of Preventive Medicine, Exposure Biology Laboratory, Icahn School of Medicine at Mount Sinai, New York, New York, United States of America
*[email protected](PT);[email protected](ALC)
Abstract
Quantification of dental long-period growth lines (Retzius lines in enamel and Andresen lines in dentine) and matching of stress patterns (internal accentuated lines and hypopla-sias) are used in determining crown formation time and age at death in juvenile fossil homi-nins. They yield the chronology employed for inferences of life history. Synchrotron virtual histology has been demonstrated as a non-destructive alternative to conventional invasive approaches. Nevertheless, fossil teeth are sometimes poorly preserved or physically inac-cessible, preventing observation of the external expression of incremental lines (perikymata and periradicular bands). Here we present a new approach combining synchrotron virtual histology and high quality three-dimensional rendering of dental surfaces and internal inter-faces. We illustrate this approach with seventeen permanent fossil hominin teeth. The outer enamel surface and enamel-dentine junction (EDJ) were segmented by capturing the phase contrast fringes at the structural interfaces. Three-dimensional models were ren-dered with Phong’s algorithm, and a combination of directional colored lights to enhance surface topography and the pattern of subtle variations in tissue density. The process re-veals perikymata and linear enamel hypoplasias on the entire crown surface, including unerupted teeth. Using this method, highly detailed stress patterns at the EDJ allow precise matching of teeth within an individual’s dentition when virtual histology is not sufficient. We highlight that taphonomical altered enamel can in particular cases yield artificial subdivi-sions of perikymata when imaged using X-ray microtomography with insufficient resolution. This may complicate assessments of developmental time, although this can be circum-vented by a careful analysis of external and internal structures in parallel. We further pres-ent new crown formation times for two unerupted canines from South African Australopiths, which were found to form over a rather surprisingly long time (>4.5 years). This approach provides tools for maximizing the recovery of developmental information in teeth, especially in the most difficult cases.
OPEN ACCESS
Citation:Le Cabec A, Tang N, Tafforeau P (2015) Accessing Developmental Information of Fossil Hominin Teeth Using New Synchrotron
Microtomography-Based Visualization Techniques of Dental Surfaces and Interfaces. PLoS ONE 10(4): e0123019. doi:10.1371/journal.pone.0123019
Academic Editor:Laurent Viriot, Team 'Evo-Devo of Vertebrate Dentition', FRANCE
Received:January 7, 2014
Accepted:February 26, 2015
Published:April 22, 2015
Copyright:© 2015 Le Cabec et al. This is an open access article distributed under the terms of the Creative Commons Attribution License, which permits unrestricted use, distribution, and reproduction in any medium, provided the original author and source are credited.
Funding:This research was funded by NSF Grant BCS 1126470, Harvard University, and the European Synchrotron Radiation Facility (Ec697). The funders had no role in study design, data collection and analysis, decision to publish, or preparation of the manuscript.
Introduction
Scholars have long recognized the wealth of information preserved in dental hard tissues. Tooth microstructure has been used to study developmental defects, tooth formation times, and age at death (reviewed in [1–3]). Further, a strong correlation between dental development and important life history events has been suggested in human and non-human primates (re-viewed in [4–7]). Life history can be described as series of developmental milestones in an indi-vidual’s life including birth, the duration of breast-feeding or weaning, as well as more complex aspects such as inter-birth intervals and lifespan; these events happen at different times and over different durations following species.
In order to determine growth periods and/or age at death of juveniles using a direct mea-surement independent of modern human or great ape standards, long-period incremental growth lines that course through the enamel (Retzius lines) and manifest on crown surfaces (perikymata) are the most commonly counted developmental features. Their periodicity how-ever needs to be determined for calculating the crown formation time. This is achieved by counting the daily prism cross-striations between two successive long-period lines. This pro-cess is conventionally done by analyzing slices through the main cusp axis of the tooth under a microscope, and requires physical sectioning of the tooth. Other methods rely solely on the counts of cross-striations for determining age at death [8–10], but these approaches are ex-tremely difficult to apply on fossils due to the high variability in the visibility of their enamel microstructure. In either case, these techniques are destructive, and are thus only rarely applied to valuable fossil specimens.
Determination of the timing of these defects may provide insight into stress, and may facili-tate matching synchronously-developing teeth within a dentition (e.g., [41,43–46]). However, quantifying microscopic incremental features and documenting stress timing is often a serious challenge, since the clarity of Retzius lines within teeth is variable, and precise quantification of perikymata and hypoplasias is complicated by variation in their expression and the curvature of tooth surfaces [20,42]. Growth lines in teeth are conventionally observed from naturally-fractured teeth and histological (thin) sections under transmitted light microscopy. Nonethe-less, perikymata counting from well-preserved tooth surfaces has the advantage of being non-destructive [47] and can be performed under a stereomicroscope or using scanning electron microscopy (SEM) with some preparation of the specimen (e.g., high resolution casts and sput-ter coating) [41], (reviewed in [48,49]]. Attempts for developing semi-automatic counting tech-niques of perikymata on isolated teeth with well-preserved outer enamel surfaces have so far demonstrated only limited success [50,51].
Histological assessments of incremental features often rely on physically-sectioned teeth, which limits material available for study, or on high-resolution impressions of tooth surfaces, which require accessible tooth germs or erupted teeth with well-preserved lateral surfaces. However, over the last decade, developments of propagation phase contrast X-ray synchrotron microtomography (PPC-SR-μCT) have permitted virtual histology, or non-destructive imaging of the internal aspects of dental tissues (e.g., [6,52–54]). In addition to being non-destructive, PPC-SR-μCT data may be used to produce high resolution 3D models of OES, as well as virtual section planes of various orientations and thicknesses, which improve the visibility of growth lines (e.g., [6]). Propagation phase contrast scans reveal the interface between two materials as a double fringe (adjacent black and white halves, with the white being on the side of the denser material), which yields sharper surfaces than absorption scans. Importantly, the real physical interface between two materials is at the exact junction between these white and black fringes.
In brief, materials are characterized by their index of refraction (n) which is a combination of attenuation (βorμ) and phase shifts (δ), as n = 1-δ+ iβ. Pure absorption occurs when the distance‘D’between the scanned object and the detector equals zero. In the case where trans-verse coherence of the beam is sufficient, such as in third generation synchrotron sources, when D increases but remains in the near field of the Fresnel diffraction region, phase domi-nates over absorption and the phase shifts resulting from the different densities of the matter become visible in the so-called‘edge-detection regime’[55,56]. In conventional CT, D remains small enough so that the phase is generally not detectable, except for small objects imaged at a resolution close to 1μm, with average energies typically lower than 20 keV (see Figure 2 and the corresponding text in [57], and Figure 1 in [58]). The fringes related to the phase shifts rep-resent one of the main advantages of synchrotron virtual histology for studies of dental devel-opment, as the phase contrast sensitivity to small density differences is orders of magnitude stronger than that of absorption (e.g., [52,59]). This approach facilitates the non-destructive observation of incremental growth lines in teeth, and yields exceptional microscopic clarity of surfaces and interfaces due to the strong phase fringes associated with these structures.
Here we describe and validate a new application of 3D virtual histology that enhances the identification and quantification of long-period growth lines on the OES, and stress pattern on both the OES and the enamel-dentine junction (EDJ). This is an alternative approach to con-ventional methods to determine tooth crown formation times and developmental defects, espe-cially in the case of teeth with altered surfaces. This 2D-3D approach has been used to
determine the age at death in juvenile dentitions that cannot otherwise be studied. This is the case for unerupted teeth that are not observable with other techniques, specimens inaccessible using classical histology due to conservation issues or 2D synchrotron paleohistology due to poor preservation of internal structures. The techniques presented in this paper have been
developed during a broad comparative study involving Plio-Pleistocene juvenile hominins [60,61] and of the MH1Au.sedibaholotype [62–64]. In the latter case, this combined 2D-3D approach has yielded age at death and overall dental development characterization despite poorly preserved external and internal structures. The goal of this paper is neither to challenge nor to solve potential methodological problems of previously published values of long-period line counts performed on teeth with good surface quality that are presently taken as references for comparison with our own results, but rather to propose new approaches to investigate spec-imens that would be inaccessible with other techniques.
The combination of 2D virtual histology and 3D high quality rendering of dental surfaces and interfaces facilitates detailed studies of fossil dentitions by enabling the use of any single fragmentary piece of information in a global approach. We present two case-studies of the lower canines of MLD2 (still enclosed in its crypt) and StW151, and we calculate their crown formation times. By maximizing the amount of information obtainable from rare and precious fossil specimens, this approach will allow us to better understand the evolution of human life history.
Material and Methods
Sample and phase contrast synchrotron
μ
-CT data acquisition
The sample under study comprises bothin situand isolated permanent developing and crown complete teeth of Plio-Pleistocene juvenile hominins. Details about specimens, sites, dating and tooth types are provided inS1 Table. In the following text, tables, and figures, teeth will be designated by abbreviations as follows:‘L’or‘U’for‘lower’or‘upper’;‘L’or‘R’for‘left’or
‘right’;‘I’,‘C’,‘M’for‘incisor’,‘canine’and‘molar’; and finally the tooth position in Arabic nu-merals. For instance,‘LRI2’represents‘lower right lateral incisor’.
The teeth were scanned using PPC-SR-μCT on the beamline ID 19 at the ESRF (Grenoble, France), with a voxel size of 4.96μm and a propagation distance of four meters. Additional technical details are provided inS2 Table. Volumes were reconstructed using a filtered back-projection algorithm (PyHST2 software, ESRF). Original 32-bit stacks were converted into 16-bit tiff stacks. The subscans were then concatenated, ring artifact correction was applied on tiff slices when required, and the concatenated subscans were cropped so as to define the final size (bounding box) of the dataset. Finally, for general overviews, smaller volumes were gener-ated using binning of 222, yielding datasets of about 10μm pixel size, with improved signal to noise ratio. Depending on preservation quality and tooth size, either the full resolution data and/or the binning version were used for developmental analyses in 3D, but only the full reso-lution data were used for the virtual histological slices.
3D topo-densitometric rendering of the dental surfaces
Segmentation and 3D rendering were performed with VGStudio MAX 2.2 software (Volume Graphics Gmbh, Heidelberg, Germany,www.volumegraphics.com), and final image processing for light source combinations (detailed below) was made with Adobe Photoshop CS4 (v. 11.0.2) using automated script systems. The OES of each tooth was segmented by capturing the white fringe at the interface between air and enamel with region growing tools, yielding models of physical surfaces. The EDJ was typically captured by segmenting the black phase contrast fringe at the interface level, and then by adding the dentine itself into the segmentation mask.
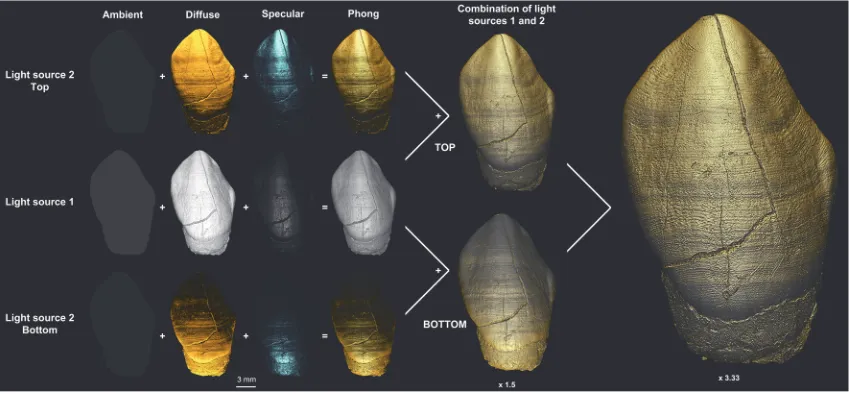
light sources (hereafter referred to as‘LS1’and‘LS2’), each of which comprised three additive components of lights: (i) ambient (uniform intrinsic brightness of the surface independent of the direction); (ii) diffuse (light spread onto the whole surface, which reflects smooth portions of the surface); and (iii) specular (reflecting light from rough surfaces).Fig 1illustrates how the orientations of the colored light sources are combined to light the 3D model and explains in de-tail the Photoshop combination protocol where the high frequencies from the set of top light pictures are superimposed to the bottom light set, and vice versa. Given the curved nature of tooth crown surfaces, this approach permits one to select a light orientation that best reveals features such as perikymata or hypoplasias (S1 Movie). Comparable light settings are also avail-able in other 3D visualization software programs such as Avizo (XMeshPack).
The same protocol was applied for visualizing the EDJ surface by segmenting the black fringe at the interface between enamel and dentine, and then by 3D Phong rendering using LS1 and LS2. As shown inFig 2, two distinct types of information can be revealed on the EDJ: sub-tle variations of density and topographical relief. The OES density pattern is generally less in-formative than topography, hence the OES pictures are generated with the“normalize gradients”option in VGStudio MAX 2.2, which reveals topography only. Since this research deals both with 2D and 3D images of dental microstructure, we would like to underline that, al-though classical histology most commonly uses the term“accentuated lines”([10], see [15,45] for a discussion about this issue), we will deliberately simplify by using“developmental defects” and“stress pattern”, which suits better for the description of both 2D and 3D data.
[image:6.612.37.462.78.275.2]High resolution of the images produced and used for this paper will be made freely available online on the ESRF open-access database website athttp://paleo.esrf.eu/.
Fig 1. 3D Phong rendering and colored light system.Principle of the 3D Phong rendering illustrated with the URC of MLD11-30. Illumination of the 3D model simultaneously by two light sources (LS1 and LS2), each composed of three components (three first columns): ambient, diffuse and specular. Each of the three rows (left half of the picture) shows the individual effect of each component. The combination of all light components is presented in the fourth column. LS1 (middle row) employs a white hue and is oriented in a perpendicular direction to the computer screen (viewer’s perspective—labial side of the crown). Light source 2 has a low white ambient (5 in VGStudio MAX 2.2), an orange diffuse light of moderate intensity (35) and a pale blue specular component with a tenfold higher intensity than the orange light (about 200). Combined with LS1, LS2 is oriented from the top (for taking a first set of images during the rotation of the tooth when mounting a multiple view plate, seeS1 Fig), and then from the bottom (second set of images, same conditions) to light the 3D model with a low angle incidence to make topographical and densitometric details more visible. Both sets of images were then combined in Adobe Photoshop to enhance and sharpen topographic details with a mask of high frequency reinforcement. This operation involved taking the top-light image and subtracting structures smaller than 20 pixels that were also present in the bottom-light image (low frequencies), resulting in the combination of unique details from each direction in the final 3D model (far right). File name: Figure_1.tif.
doi:10.1371/journal.pone.0123019.g001
To validate the accuracy and objectivity of this new approach for counting perikymata, we performed an inter-/intra-observer study as well as a comparison between stereomicroscope, SEM and our 3D renderings. All of these protocols and validation results are presented inS1 Supporting Information (SectionI).
Results
High quality OES 3D renderings for perikymata counting
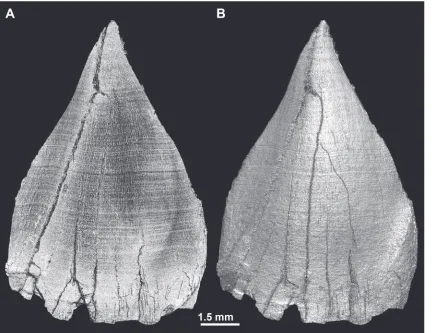
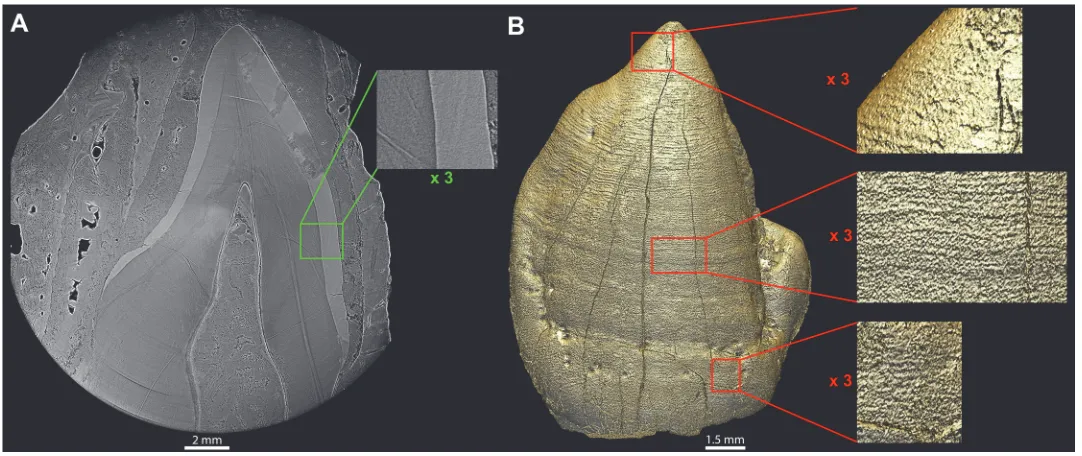
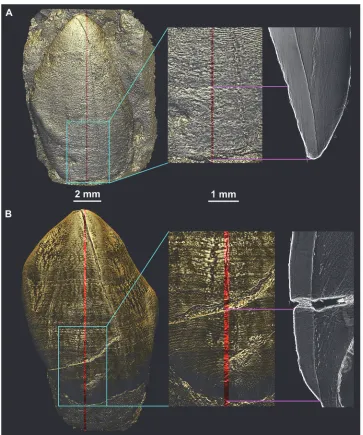
[image:7.612.37.469.77.410.2]The combination of the sets of images obtained with LS2 oriented from the top and from the bottom improved the visibility of perikymata and facilitated counting from cervical to cuspal enamel (Fig 1andS2 Fig). Perikymata near cusp tips could also be visualized for unworn teeth (S3 Fig). The bottom orientation of LS2 was the most optimized for visualizing the cervix, while the top orientation was best suited for the cusp tip and the cuspal half of the crown. A major advantage of this technique is the possibility to study well-preserved tooth germs that are still in the crypt, such as the LLC of MLD2 (Fig 3). For this tooth, perikymata can be reliably identified and counted from the cusp tip to the cervix, using different degrees of magnifications and areas of the labial aspect of the crown (see the results of the inter-/ intra-observer compari-son inS1 Supporting Information, section I). Moreover, this technique permits the matching Fig 2. Topography and fine variation in density at the EDJ.Renderings of the EDJ of the ULC of StW151, with two white lights sources (default in VGStudio MAX 2.2). (A) The tooth rendered with‘ScatterHQ’, which reveals only subtle density variation (gray values) at the EDJ. (B) The EDJ rendered with
‘Phong 3D’and the‘Normalize gradient’commands; this renders only the topographical details of the EDJ surface, and omits shades related to density variation. File name: Figure_2.tif.
of hypoplasias across the dentition, as illustrated with the URI2 and URC of MLD11-30 (S2 MovieandFig 4). In addition, and from a qualitative point of view, multiple light source orien-tations also reveal different sets of features related to attrition and wear (S3 Fig).
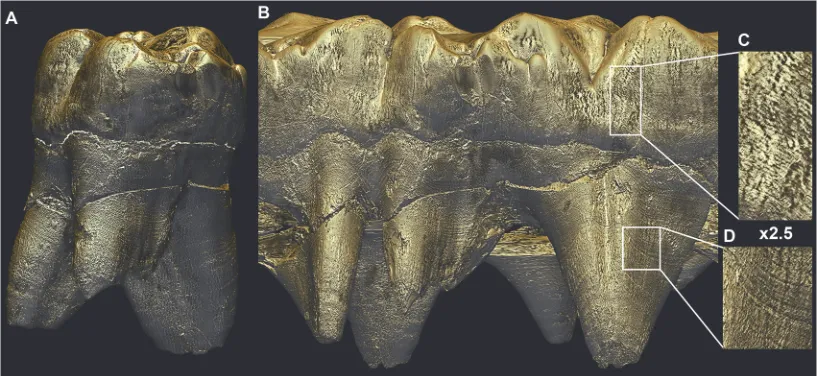
[image:8.612.35.576.76.304.2]Fig 5shows a clear correspondence between perikymata on 3D models and Retzius lines in 2D virtual slices. A similar relationship between hypoplasias on 3D models and accentuated lines in 2D slices is also illustrated inFig 6.
Fig 3. 3D rendering of the unerupted LLC of MLD2 showing perikymata.The unerupted MLD 2 LLC in its alveolar crypt, which filled with matrix during fossilization. Retzius lines could not be revealed in the virtual histological data, in spite of changing thickness and orientation of the virtual 2D slice, the two thick lines are likely parts of ring artifacts (A). Despite continuous contact between the OES and the sediment filling the crypt, and the noisy nature of the fringes at the OES, the enamel surface could be successfully segmented and rendered (B), revealing countable perikymata almost all the way from the cusp tip to the cervix. Linear enamel hypoplasias are also apparent encircling the tooth crown. File name: Figure_3.tif.
doi:10.1371/journal.pone.0123019.g003
Fig 4. Enamel hypoplasia matching in the MLD11-30 URI2 and URC.Matching of the URI2 and URC of MLD11-30 based on linear enamel hypoplasias. On the left-hand side, both teeth are shown in natural proportions: the incisor (left) is smaller than the canine (right). The transformation on the far right was created by enlarging the incisor to be the same size as the canine, so that its hypoplasia and perikymata pattern matches the canine.S2 Movieshows the procedure for matching. File name: Figure_4.tif.
doi:10.1371/journal.pone.0123019.g004
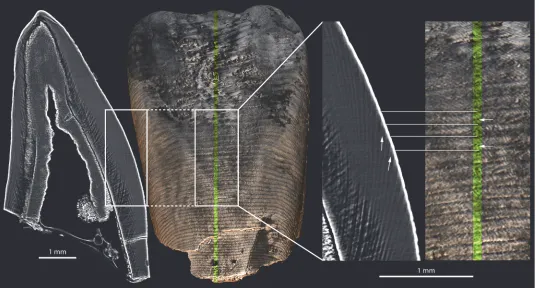
[image:8.612.50.462.496.654.2]In some regions, we note the existence of fine grooves between perikymata, which seem to correspond to internal subdivisions of Retzius lines (Fig 5) that could sometimes be misleading during long-period line counting. They occur locally in the middle of the traditionally defined structures, dividing Retzius bands, and sometimes perikymata into two roughly equivalent halves. We explore this phenomenon inS1 Supporting Information (SectionII) and conclude that this is likely related to an increased visibility of these long-period line subdivisions caused by a local demineralization. This is particularly noticeable on the KB5223 teeth (see the virtual histological slices in [61] showing a clear degradation of the inner tissues of the KB5223 teeth). The internal subdivisions we observe seem similar to those described by FitzGerald [67], al-though their external expression as perikymata subdivisions are accentuated by X-ray imaging at too low resolution. The partial volume effect combined with the 5μm pixel size of the PPC-SRμCT data induces these perikymata subdivisions that are in fact not real topographical structures on the surface when observed at higher resolution. This phenomenon has first been very confusing at the beginning of our observations and counting sessions. However, by inves-tigating and understanding its causes, it appears that it can be distinguished from true periky-mata by checking at the virtual 2D sections and at the continuity of the structure on the 3D of the outer enamel surface. Despite this, we therefore can rely on our results, but raise this impor-tant point to keep in mind when working with specimens strongly affected by taphonomical al-terations. We propose that if this degradation is too pronounced, one should consider
[image:9.612.38.577.79.367.2]excluding the specimen from the sample study to avoid introducing bias.
Fig 5. Retzius lines and perikymata doubling in the LLI1 of KB 5223.Virtual histological slices (grayscale images) showing subdivisions of Retzius lines (white arrows) in the LLI1 of KB5223 (labial view), and their corresponding expression as subdivisions of perikymata (white arrows) on the outer enamel surface. The dotted lines show the fidelity of 2D–3D matching through horizontal alignment. The position of the labiolingual 2D section is indicated on the 3D model by the green stripe. SeeS1 Supporting Information (SectionII) for a discussion about this phenomenon related to taphonomical alteration (local demineralization). File name: Figure_5.tif.
Determination of the LLC crown formation time of MLD2 and StW151
[image:10.612.199.562.74.509.2]The unerupted MLD2 canine is crown complete, and over half of its root is already developed. The segmentation of its OES yielded a reasonably usable 3D model allowing for perikymata counts (Fig 3), despite being in direct contact with the mineral matrix. The StW151 canine has not yet achieved its lateral enamel formation, although based on the general morphology of the tooth germ, it appears close to crown completion. The perikymata cannot be counted in the Fig 6. Complementarity of 2D and 3D developmental information illustrated for StW151 LLC and MLD11-30 URC.When calculating the crown formation time of StW151 LLC, we use Retzius lines on a 2D virtual slice in the cervical area, since the 3D model does not show clearly identifiable perikymata in that region (A). The cervix of the MLD11-30 LLC (B) yields the largest variation for both inter- and intra-observer counts (S2 Supporting Information, Tab“Average deciles”). This is due to the presence of unequal subdivisions of perikymata and a poor visibility of the perikymata at the very bottom of the cervix. The exact alignment between the 2D slice (its thickness explains that the alignment appears not exact with the 3D, although it is) and the 3D model of the OES is shown by pink lines at the cervix and at a hypoplasia for StW151, and at the bottom edge of a fracture for MLD11-30. File name: Figure_6.tif.
doi:10.1371/journal.pone.0123019.g006
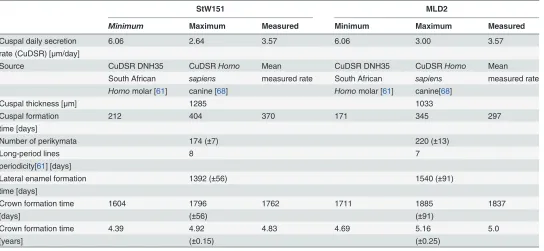
cervical area due to poor preservation of the tooth surface in this area, and Retzius lines could not be counted in the cuspal part of the tooth. Thus we combined Retzius line counts on a 2D virtual section of the cervical half of the crown, and perikymata counts on the 3D model for the cuspal half (Fig 6). Because the cervix of the tooth has yet to form and an accurate projection of its completion is practically unattainable, our estimate represents a minimal crown formation time (Table 1). The perikymata counts used for the crown formation times of MLD2 and StW151 are the average of the three observers’means (S3 TableandS2 Supporting Informa-tion). The long-period line periodicity is 8 days for StW151 and 7 days for MLD2, determined by high resolution synchrotron virtual histology [61]. The cuspal enamel thickness was mea-sured on virtual 2D sections oriented in the developmental plane (passing through the dentine horn tip and the pulp chamber roof in the middle of the labial aspect). We attempted to directly measure the cuspal daily secretion rates (further abbreviated as CuDSR) on three hominin ca-nines. Unfortunately, since high resolution data for cuspal enamel were not available, we based these measures on cuspal Retzius lines, observed on two orthogonal cut planes (S11 FigandS1 Supporting Information, section III). This yielded an average CuDSR of 3.57μm/d obtained on the maxillary canines of STW151, MLD11-30 and STS2. In addition, since this approach re-mains less precise than direct observations of cuspal cross-striations along prisms, we investi-gated the effect of using different CuDSR (following tooth type and taxon) found in the literature to provide a range of crown formation times (CFT) that maximizes the probability of containing the true value. The cuspal rates range from 3μm/d in recent modern human ca-nines to 6.06μm/d in the molar of South AfricanHomoDNH35. Those results are explained Table 1. Determination of crown formation times for the mandibular left canines of MLD2 and of StW151.
StW151 MLD2
Minimum Maximum Measured Minimum Maximum Measured
Cuspal daily secretion 6.06 2.64 3.57 6.06 3.00 3.57
rate (CuDSR) [μm/day]
Source CuDSR DNH35 CuDSRHomo Mean CuDSR DNH35 CuDSRHomo Mean
South African sapiens measured rate South African sapiens measured rate
Homomolar [61] canine [68] Homomolar [61] canine[68]
Cuspal thickness [μm] 1285 1033
Cuspal formation 212 404 370 171 345 297
time [days]
Number of perikymata 174 (±7) 220 (±13)
Long-period lines 8 7
periodicity[61] [days]
Lateral enamel formation 1392 (±56) 1540 (±91)
time [days]
Crown formation time 1604 1796 1762 1711 1885 1837
[days] (±56) (±91)
Crown formation time 4.39 4.92 4.83 4.69 5.16 5.0
[years] (±0.15) (±0.25)
The number of perikymata used for calculating the formation time of the lateral enamel is the average of the three observers' means. The true crown formation time of the StW151 LLC will exceed our results since the crown is not fully formed. The lateral enamel formation time was determined from the perikymata counts on the 3D renderings combined with 2D virtual histological slice (for StW151), multiplied by the long period lines periodicity. The cuspal enamel formation time was determined from a linear measurement from the dentine horn tip to the enamel surface at the level of thefirst perikymata, multiplied by enamel daily secretion rates (seeS1 Supporting Information [sectionIII] andS3 Supporting Information).
and reported inS1 Supporting InformationandS3 Supporting Information. We estimate that the MLD2 canine crown formed in 5.0 (±0.25) years, while the nearly complete StW151 canine crown required more than 4.8 (±0.15) years (average following our measured CuDSR, see
Table 1for total ranges). We report a wider range of CFT taking into account CuDSR ofPan and recent human canines as: 4.86–5.16 (±0.25) years for the MLD2 LLC and 4.61–4.92 (±0.15) years for the StW151 LLC. The widest range of the CuDSR values we have collected would lower the minimal CFT down to 4.69 (±0.25) years for the MLD2 LLC and to 4.39 (±0.15) years for the StW151 LLC, using the CuDSR of the South AfricanHomoDNH35 at 6.06μm/d [61]. Although it is incomplete, the StW151 canine would have likely have formed in the same time or over slightly more time than the MLD2 canine.
Visualization and matching of the stress pattern on the EDJ
The colored light system and Phong 3D rendering reveal a stress pattern on the EDJ as alternat-ing dark and light stripes of variable thickness and intensity, which may be thought of as a unique barcode. These stripes result from fine variations in density on either side of the EDJ. Given a similar thickness of incremental lines and defects in dentine and enamel, the smaller their angle of intercept with the EDJ, the broader the band will appear on the EDJ (S12 Fig). The variation in gray levels within the fringes themselves may yield this stress pattern on the 3D renderings of the EDJ (S13 Fig). The high sensitivity of this method results from the effect of superimposition of the stress pattern (and to a lesser extent the regular incremental pattern) with the phase contrast fringes at the EDJ level. This produces a very precise topography (e.g., well defined hypoplasias) with segmentation of the black fringe, and reveals subtle density vari-ations due to stress pattern (Fig 2). The combination of these two aspects using the lighting sys-tem described above gives a novel 3D topo-densitometric rendering that reveals regular incremental features and irregular stress patterns (Fig 7). When an individual is represented by several developmentally overlapping teeth, the pattern on the EDJ can be matched across the teeth (S1 TableandFig 7) following the same procedure described for perikymata and hypopla-sia visualization (Fig 6andS2Movie).
Discussion
New techniques for long-period growth line visualization
High-quality propagation phase contrast synchrotron-based 3D renderings of tooth crown sur-faces can be reoriented, rescaled, or illuminated to optimize the region of the tooth investigated (e.g., cervix versus cusp tip) and its topography (curved versus flat surface). The well-estab-lished correspondence between Retzius lines and perikymata [15,28,33,37,69,70] is illustrated inFig 5, with an exact alignment of the 2D virtual slice and the 3D model of the OES. This ap-proach aims for a more objective illustration and quantification of long-period lines and devel-opmental defects due to the standardized and semi-automated protocol for light orientation and image generation. Our intra-/inter-observer pilot study shows that there is some variability in the long-period line identification due, in part, to the experience of observers (S1 Supporting Information, section I). Despite very different backgrounds and experiences in techniques for investigating dental development among the observers, our results generally yield reasonable agreement within and between observers, although some teeth showed greater variability. Ex-planations for this greater intra-/inter-observer variation may result from: 1) taphonomy/dia-genesis of the tooth surfaces; 2) experience and ability of the observer to recognize a“real” structure, as opposed to the perikymata subdivisions observed in some cases on the
PPC-SRμCT scans. In the case of a complex surface with hypoplasias and perikymata subdivi-sions, such as that of the MLD11-30 URC, the variability of counts was highest in deciles where
subdivisions occur, as well as near the cervix. Our observations of perikymata and Retzius line subdivisions as a localized phenomenon (S7 Fig) draw the attention onto using X-ray microto-mography on taphonomically altered enamel surfaces, as the partial volume effect on the OES can affect the data accuracy, in case of strong modification of the subsurface density (S1 Sup-porting Information, section II). We have demonstrated that the perikymata and Retzius lines subdivisions observed in the KB5223 incisors, and which run parallel to the real structures, are primarily related to authentic internal developmental features, but they are appearing on the 3D rendered surfaces due to a strong local demineralization of the enamel subsurface (see visi-ble prisms on the enamel surface in the inset ofS8 Fig-A;S1 Supporting Information, section II;S8andS9 Figs). This can become a potential non-negligible pitfall for crown formation time calculation since it can lead to artificially inflated long-period line counts if not identified (also noted by [28]) and/or, in the most extreme cases, to an underestimation of the number of daily lines between long-period lines (periodicity). It however can be overcome by using a 2D-3D matching to check the relevance of the different structures. The presence of these additional lines may account for some of the differences between our counts and published values (S4 Fig) for the specimens the most affected, but the variability observed among the three raters re-mains in the range of the one in the published values. Additionally, we have shown onS6 Fig
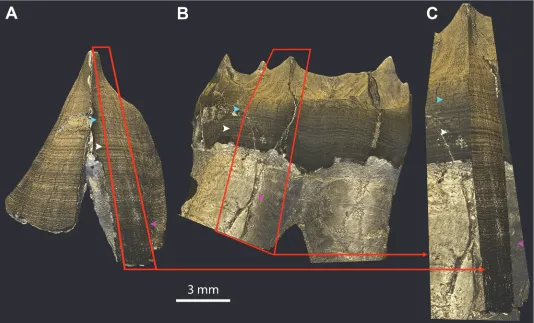
Fig 7. EDJ matching in multiple teeth of a single individual.The 3D models of the EDJs of the LRC (A) and LRM1 (B) of KNM-KP34725 are matched in (C) by superimposing a portion of each EDJ (red frames and arrows) following the stress pattern as a barcode on the EDJ and root surface (colored arrowheads). This is done with Abode Photoshop by rotation, translation, isometric scaling, perspective and skewing of the fragment of EDJ of the canine onto the fragment of molar that is taken as a reference. (The two apical thirds of the roots of the molar were out of the field of view during scanning, thus the roots appear to be cut in an abrupt manner.) File name: Figure_7.tif.
that a real structure visible as a thin layer partially covering the perikymata ridge can be imaged with binocular, SEM and PPC-SRμCT, proving that some of these perikymata subdivisions are not an imaging artifact related to X-ray techniques (S8 Fig-A, C and E). This is nevertheless still unclear whether or not these structures are a byproduct of the diagenetic modifications that affected the KB5223 specimen. This structure can yet not really be mistaken for the expres-sion of a long-period line.
Although distinguishing between“real”and ancillary lines may sound straightforward since, in most of the cases it would result in unlikely periodicity values, this could become criti-cal when the observer is faced with choosing between a periodicity of 6 or 12 days which are both possible values for hominins, or even 5 or 10 days (see reported ranges by
[10,15,19,33,71–75]). We recommend to use a statistical approach for reporting a periodicity: in the high resolution scan, counts should cover several consecutive Retzius bands in several lo-cations, so as to sample different conditions of preservation of the tissues in subsurface. In ad-dition, we suggest that long-period lines values should be reported more generally as the average of multiple counts (which is certainly the case in previously published values, but is rarely written) and take the mode only if the results are congruent (S3 TableandS2 Supporting Information: second tab). In case of high uncertainty on the periodicity, crown formation times and age at death reports should reflect the range of long-period lines counts.
[image:14.612.36.446.78.266.2]This new visualization approach is highly sensitive to subtle developmental disturbances, and is particularly useful for matching teeth when hypoplasias or accentuated lines are not visi-ble on virtual 2D slices. Moreover, the same approach may be applied to visualize root surfaces (S1 FigandFig 8), which also show regular long-period lines (periradicular bands) and a stress pattern. A related approach consists of literally unwrapping the tooth (Fig 8): perikymata, hy-poplasias, and periradicular bands can be followed around the circumference of the tooth. This information can then be used for stress matching across the dentition, or checking the consis-tency of a structure (imaging artifact vs. defect or perikymata subdivisions). This approach Fig 8. Unwrapped external surface of the StW151 ULM1.Virtual unwrapping of the outer surface of the StW151 ULM1 obtained from the concatenation of a single pixel-wide frames saved during the complete rotation of the tooth around its long axis. On the left side of the unwrapped surface, the tooth is viewed from the buccal side, and the mesio-buccal and disto-buccal roots can be seen in the front, while the lingual root is visible in the back. The lingual view, at the right of the unwrapped tooth, shows the lingual root in the front, and the two buccal roots in the back. Since not all points are at the same distance from the center of rotation of the tooth, some parts of the tooth can be distorted: the furcation area of the buccal roots is stretched in the middle of the unrolled tooth. Perikymata, periradicular bands and hypoplasias are visible and can be tracked across the tooth. Images are not to scale. File name: Figure_8.tif.
doi:10.1371/journal.pone.0123019.g008
yields a comprehensive view of all the stress pattern and developmental aspects of a tooth in a single image, which is particularly illustrative for multi-cusped teeth.
The main drawback of synchrotron imaging is that samples are irradiated with a powerful X-ray beam, leading to the delivery of a high X-ray dose. This can lead to darkening of the enamel ([53], but see [76]) and may also have detrimental effects to potentially preserved an-cient DNA (aDNA) [76]. The effects of synchrotron scanning on aDNA are currently being in-vestigated, and preliminary results show that, nowadays, the configurations used for full sample imaging do not result in significant damage to aDNA [77]. In most of the cases, there is no darkening of the enamel. For the rare cases where this occurs, the natural color can be fully recovered after a few hours under low-power low-energy UV irradiation using“dark light” (main wavelength at 370 nm, close to visible light,contra[76]).
MLD2 and StW151: surprisingly long-forming canines
rates in at least one anterior and one postcanine tooth. This would constraint the reported range and take into account taxonomic and anatomical (tooth class) variability.
Stress pattern and its 3D visualization on the EDJ interface
Stress in enamel and dentine are commonly used to match teeth across a dentition as synchro-nous events [14,80–83]. Although odontoblasts secrete dentine slightly in advance of amelo-blasts secreting enamel, this difference in time can be treated as negligible for general dental development studies [84]. For the first time, we reveal the stress pattern on the EDJ resulting from subtle variations of density and topography on both sides of this interface. This is possible because phase contrast reveals this information with high sensitivity in the black and white fringes at the interface between the two materials (S13 Fig). Although matching the EDJ (Fig 7) of several teeth does not yield temporal information, as the Andresen lines are rarely visible on the EDJ interface, it creates a relative chronology of stress events that then allows one to exploit any single usable piece of developmental information (periodicity, and number of perikymata, Retzius lines in enamel, Andresen lines in dentine) within that framework (Fig 9).
Conclusion
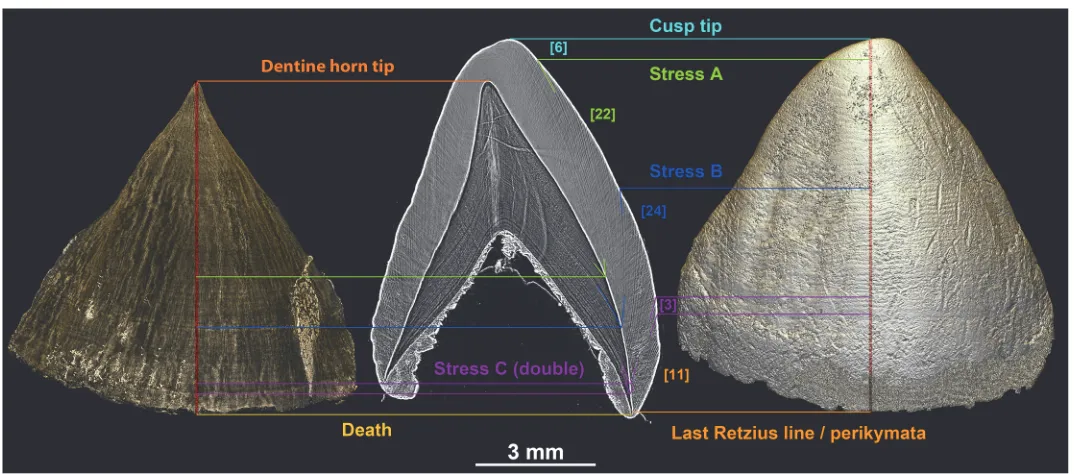
[image:16.612.35.576.74.311.2]The main advantages of the 2D-3D rendering protocol presented in this study are: (i) enhanced topographic and densitometric details of the OES and stress patterns on the EDJ; (ii) enhanced visibility of developmental structures from high-quality images allowing for reasonably consis-tent inter- and intra-observer agreement; (iii) accurate visualization of long-period growth in-crements in enamel and developmental defects using a combination of virtual histological 2D slices and 3D models; (iv) novel possibilities for visualizing surfaces of well-preserved teeth still in crypt; and (v) facilitation of the matching of stress patterns across an individual's dentition. Fig 9. Direct correspondence of 2D and 3D developmental information.Matching of the incremental pattern between the standardized developmental slice of the ULC of STS2 and the 3D models of its EDJ and OES. Retzius lines or accentuated lines in the enamel on the 2D virtual slice allows the matching of a stress on the EDJ and OES. The number of long-period lines is indicated in square brackets between the major stress events highlighted on the 2D and 3D models, providing a quantitative overview of the time elapsed between stress. The long-period line count was performed on a high resolution image of the 2D slice to ensure a high definition of the growth lines. Further developmental information for this individual may be found in [61]. File name: Figure_9.tif.
doi:10.1371/journal.pone.0123019.g009
This 2D-3D combination rendering approach for visualization of dental surfaces opens up new possibilities for detailed developmental studies on exceptional fossil hominins with well-preserved partially complete developing dentitions. We however draw the attention on the im-pact that resolution and partial volume effect can have on demineralized areas in the enamel subsurface, when subdivisions of perikymata are observed on the 3D renderings. On the one hand, special care has to be taken to ensure reaching robust results based on perikymata counts derived from X-ray images. In the vast majority of cases, there is no possible mistake about rec-ognizing real perikymata on PPC-SRμCT data. Further, it allowed for the first time to deter-mine crown formation times of two unerupted early hominin teeth that would not have been fully accessible with any other technique. These results suggest that the short formation time conventionally expected for early hominin lower canine crowns may be too restrictive; the two specimens presented here showed development times of more than 4.5 years. Dental develop-ment in general should consider using direct determination of the individual’s periodicity to avoid reporting very wide ranges. In addition, future PPC-SRμCT-based developmental studies may improve by trying to measure systematically CuDSR, which would contribute to constrain even more the reported ranges for both crown formation times and age at death. This innova-tive approach is being employed to generate a comprehensive and permanent digital record of developmental information in invaluable and fragile fossil hominin specimens. These develop-mental data will be made freely available online and will thus facilitate future
comparative studies.
Supporting Information
S1 Fig. Eight-view plate of the LLM1 of MLD2.The LLM1 of MLD2 imaged every 45° along the transverse axis following rendering by the protocol detailed here. This allows visualization of developmental defects or long-period features around the tooth to ascertain their authentici-ty (and rule out imaging or reconstruction artifacts). File name: S1_Fig.tif.
(TIF)
S2 Fig. Rendered LLM1 of MLD2 showing the advantages of the combination of colored lights.Segmented enamel surface of the MLD2 LLM1 rendered in 3D using Phong’s algorithm. First, the model is lit with the two default light sources (the first is oriented perpendicular to the screen and coming towards the user, while the second is coming from the top) with all components having a white hue (A). Then, the second light source is successively oriented from the top (B) and bottom (C) with a low white ambient component, a moderate orange dif-fuse component, and a pale blue specular light. Two masks of reinforcement are then succes-sively computed in Photoshop from the high frequencies of the top view (B) and the bottom view (C). These masks enhance the high frequencies of the views lit from the opposite direc-tion: i.e., the mask computed from (B) enhances the high frequencies of (C) resulting in (E). The same is true for the mask computed from (C) reinforcing (B) and resulting in (D). Micro-scopic increments on the outer enamel surface (perikymata) are shown in corresponding insets of each lighting condition. File name: S2_Fig.tif.
(TIF)
S3 Fig. Occlusal surfaces of the LLM1 (top row) and LLM2 (bottom row) of MLD2, lit with a combination of top and bottom colored second light sources.The LLM1 shows occlusal wear facets, macro- (A-C) and microwear (D) features. The unworn occlusal morphology of the LLM2 displays perikymata from the cusp tip downwards along the lateral enamel (E-G). File name: S3_Fig.tif.
S4 Fig. Intra-observer variability in perikymata counts and comparison with published val-ues.Whisker plot showing the variability in the perikymata counts for each observer, and the overall variability among observers, compared to perikymata counts published in the literature. File name: S4_Fig.tif.
(TIF)
S5 Fig. Cumulative perikymata counts per decile reveals inter-observer variability. Cumula-tive plot of perikymata counts of all observers, per decile of crown height, for four teeth (STS24 URI1, MLD11-30 URC, SK62 LLI1 and the unerupted MLD2 LLC).‘dec#1’designates the first decile at the cusp tip, down to‘dec#10’at the cervix. File name: S5_Fig.tif.
(TIF)
S6 Fig. Comparison of stereomicroscope, scanning electron microscope and
synchrotronμCT approaches for perikymata visualization.Comparison of imaging tech-niques for perikymata visualization on the labial surface of the LRI2 of KB5223, with (A) ste-reomicroscope, (B) SEM, and (C) 3D rendering using PPC-SRμCT data (Phong, colored lights and normalize gradient in VGStudio MAX 2.2). File name: S6_Fig.tif.
(TIF)
S7 Fig. Primary observation of perikymata subdivisions as a localized phenomenon. Three-dimensional model of the LLI2 of KB5223 (light source 2 is oriented from the top) showing subdivisions of perikymata (right inset). This phenomenon is only local, since there are no sub-divisions for a contemporaneous area of the crown surface (top left inset). It is also not consis-tent through time, because there are no subdivisions in the cervical part of the crown (bottom left inset).S8andS9Figs reveal that this phenomenon can be induced by demineralization of the enamel sub-surface. SeeS1 Supporting Information (sectionII) for a discussion. File name: S7_Fig.tif.
(TIF)
S8 Fig. Perikymata/Retzius lines subdivisions related to local demineralization of the enamel subsurface.Impact of tomographic partial volume effect on demineralized enamel sub-surface in the labial aspect of the KB5223 LLI2. The same region of interest is imaged at high resolution (0.7μm voxel size, top row, A and B), 5μm (middle row, C and D) and degrad-ed 0.7μm (bottom row, E and F) in an area showing perikymata/Retzius line subdivisions of equal size (green frame) on the 3D models (C and E) and the corresponding 2D virtual slices (location shown as a blue line on the 3D): 100μm-thick (right) and inset showing the 5 μm-thick slice (left from the yellow frame). The turquoise inset illustrates the thin sheet of enamel overlaying the perikymata ridges, and which are not an artifact as it is also visible using other imaging techniques (seeS6 Fig). Green arrows materialize the location the“true”long-period lines, while red arrows show the location of the subdivisions (not existing on A). File name: S8_Fig.tif.
(TIF)
S9 Fig. Effect of PPC-CRμCT resolution on an area lacking demineralized long-period line subdivisions on the KB5223 LLI2.Imaging of a portion of the labial aspect of the KB5223 LLI2 crown not showing demineralized long-period line subdivisions, corresponding to same time period than the area presented inS8 Fig. Same configuration and color-coding as forS8 Fig(save for the turquoise inset that is not shown). It shows that the perikymata subdivisions presented inS8 Figare induced by the partial volume effect when the resolution is not high enough to fully discriminate the external surface and the sub-surface demineralization. File
name: S9_Fig.tif. (TIF)
S10 Fig. Evidence of non-artifactual perikymata subdivisions imaged by binocular micro-scope and PPC-SRμCT on the KB5223 LLI2.Perikymata subdivisions non-related to imaging artifacts are visible on the PPC-SRμCT-based 3D model of the KB5223 LLI2 (A, LS2 oriented from the bottom) and on the area framed in turquoise (in [A]) on the labial aspect of a silicone cast of the same tooth, observed under a binocular microscope (B). This illustrates the case where the demineralization of the enamel subsurface reaches the surface and creates a visible structure on the outer enamel surface. Green arrows point to true anatomical perikymata and red arrowheads show the subdivisions. The binocular picture is a courtesy of Dr. Tanya M. Smith. File name: S10_Fig.tif.
(TIF)
S11 Fig. Methodology for direct cuspal daily secretion rate measurement on the STS2 ULC.
The red cross illustrates where the measurement has been taken on the 3D model of the STS2 ULC (A), on 200μm-thick sagittal (B) and transversal (C) slices in the cuspal enamel. Colored arrows show corresponding accentuated lines on both the transversal slice (C and E) and on magnified zone (D and F) from of the sagittal slice. Retzius lines are easier to follow as concen-tric lines on the transversal slices (C and E), and their tracing can be matched back onto the sagittal slice (B) for measuring cuspal distances to calculate the CuDSR. It has to be noted that C, D, E and F were enhanced with an unsharp filter in Adobe Photoshop CS4. File name: S11_Fig.tif.
(TIF)
S12 Fig. Angle of intercept of stress lines at the EDJ.Illustration showing the importance of the angle of intercept of the long-period growth lines and developmental defects at the EDJ. A stress reaching the EDJ with an acute angle (here 30°/2) will manifest as a thicker band (3.7 A. U.;‘A.U’stands for‘arbitrary unit’) than in the case of a larger angle (here 132°/2 correspond-ing to a thickness of 1 A.U. on the EDJ). A stress occurrcorrespond-ing early in dental development, such as the neonatal line in the permanent first molar, will be very strongly tangent to the EDJ be-cause of the high extension rate during early cuspal enamel and dentine formation. This will re-sult in a large band on the dentine horn tip. File name: S12_Fig.tif.
(TIF)
Phong 3D rendering and colored light sources. File name: S13_Fig.tif. (TIF)
S1 Movie. Application of the Phong 3D rendering and of the colored light sources.The MLD2 LLM1 is lit with the first light source that is white and oriented to the front (not shown). Colors (for the diffuse and specular components) are given to the second light source (shown on the movie), which changes its orientation progressively to reveal different details of the enamel surface following the angle of incidence. The combination of LS2 oriented from the top and from the bottom is displayed after, showing a much sharper enamel surface with clear peri-kymata and stress. File name: S1_Movie.avi.
(AVI)
S2 Movie. Enamel hypoplasia matching in the MLD11-30 URI2 and URC.MLD11-30 URI2 and URC matching based on linear enamel hypoplasia. Both teeth are first shown in their nor-mal proportions, followed by a transformation that involves increasing the size of the incisor so that its stress pattern matches the one of the canine. In this example, the precision allows merging the two surfaces and corresponding perikymata. File name: S2_Movie.avi.
(AVI)
S1 Supporting Information. Perikymata Counting: Intra- / Inter-Observer Agreement Study and Comparison between Imaging Techniques; Perikymata subdivisions; Cuspal daily secretion rates.File name: S1_Supporting_Information.docx.
(DOCX)
S2 Supporting Information. Perikymata Counting: original data, decile distributions and descriptive statistics.File name: S2_Supporting_Information.xlsx.
(XLSX)
S3 Supporting Information. Measured and published cuspal daily secretion rates for enam-el cuspal formation of StW151 and MLD2 LLC.File name: S3_Supporting_Information.xlsx. (XLSX)
S4 Supporting Information. Comparison of perikymata count per mm of crown height be-tween Moggi-Cecchiet al. (1998) [79] and this study for the StW151 LLC.File name: S4_Supporting_Information.xlsx.
(XLSX)
S1 Table. Sample of fossil hominin teeth included in this study.File name: S1_Table.docx. (DOCX)
S2 Table. Scanning parameters for the acquisition of phase contrast synchrotron micro-CT data.File name: S2_Table.docx.
(DOCX)
S3 Table. Inter-observer agreement study for all counting sessions (mean ± standard devia-tion).File name: S3_Table.docx.
(DOCX)
Acknowledgments
We are grateful to Bernard Zipfel, Stephanie Potze, Lazarus Kgasi, Colin Menter, Jacopo Moggi-Cecchi, Emma Mbua, Fredrick Manthi, and Carol Ward for assisting with access to the fossils. We are also much obliged to the curating institutions involved: the University of Wit-watersrand, the DITSONG Museums of South Africa, and the National Museums of Kenya.
We are most grateful to Chris Dean for critical comments on an earlier version of this manu-script and for fruitful discussions. We acknowledge Fred Grine, Simon Hillson, Rodrigo Lacruz, Don Reid and Fernando Ramirez-Rozzi for their advice. We thank the ID 19 staff (ESRF) especially José Baruchel, Alessandro Mirone, Alexander Rack and Anne Bonnin (who also provided helpful comments on an earlier version of this manuscript), for constructive dis-cussions. We acknowledge Dr. Tanya M. Smith for her contribution on an earlier version of this manuscript. This research project was initiated in the framework of the joint NSF grant BCS 1126470 led by Dr. Tanya M. Smith and Dr. Paul Tafforeau. Our sincere gratitude goes to James Weaver (Harvard University, Wyss Institute for Biologically Inspired Engineering) for assistance with SEM imaging, and to Steve Worthington (Institute for Quantitative Social Sci-ence, Harvard University) for his advice in using R for statistical analysis. Laurent Viriot, Mat-thew Skinner, Jay Kelley and an anonymous reviewer provided constructive comments on previous versions of this manuscript.
Author Contributions
Conceived and designed the experiments: ALC PT. Performed the experiments: ALC PT NT. Analyzed the data: ALC PT NT. Contributed reagents/materials/analysis tools: PT ALC. Wrote the paper: ALC PT NT.
References
1. Smith TM. Incremental dental development: Methods and applications in hominoid evolutionary stud-ies. J Hum Evol. 2008; 54: 205–224. PMID:18045649
2. Dean MC. Retrieving chronological age from dental remains of early fossil hominins to reconstruct human growth in the past. Philos Trans R Soc B Biol Sci. 2010; 365: 3397–3410. doi:10.1098/rstb. 2010.0052PMID:20855313
3. Schwartz GT. Growth, Development, and Life History throughout the Evolution ofHomo. Curr Anthro-pol. 2012; 53: S395–S408.
4. Smith HB, Crummett TL, Brandt KL. Ages of eruption of primate teeth: A compendium for aging individ-uals and comparing life histories. Am J Phys Anthropol. 1994; 37: 177–231. doi:10.1002/ajpa. 1330370608
5. Dean CM. Tooth microstructure tracks the pace of human life-history evolution. Proc R Soc B Biol Sci. 2006; 273: 2799–2808. doi:10.1098/rspb.2006.3583PMID:17015331
6. Smith TM, Tafforeau P, Reid DJ, Pouech J, Lazzari V, Zermeno JP, et al. Dental evidence for ontoge-netic differences between modern humans and Neanderthals. Proc Natl Acad Sci U S A. 2010; 107: 20923–20928. doi:10.1073/pnas.1010906107PMID:21078988
7. Dean MC, Elamin F. Parturition lines in modern human wisdom tooth roots: do they exist, can they be characterized and are they useful for retrospective determination of age at first reproduction and/or inter-birth intervals? Ann Hum Biol. 2014; 41: 358–367. doi:10.3109/03014460.2014.923047PMID:
24932749
8. Boyde A. Estimation of age at death of young human skeletal remains from incremental lines in the den-tal enamel. Third International Meeting in Forensic Immunology, Medicine, Pathology and Toxicology. London; 1963. pp. 36–46.
9. Antoine D. Evaluating the periodicity of incremental structures in dental enamel as a means of studying growth in children from past human populations. University College London. 2000.
10. Antoine D, Hillson S, Dean MC. The developmental clock of dental enamel: a test for the periodicity of prism cross‐striations in modern humans and an evaluation of the most likely sources of error in histo-logical studies of this kind. J Anat. 2009; 214: 45–55. doi:10.1111/j.1469-7580.2008.01010.xPMID:
19166472
11. Retzius A. Bemerkungen über den innern Bau der Zähne, mit besonderer Rücksicht auf den im Zahn-knochen vorkommenden Röhrenbau. Arch Anat Physiol Wiss Med. 1837; 486–566.
12. Pantke H. Untersuchengen uber Retzius-streifen und Perikymatien. Stoma (Lisb). 1957; 10: 32–40. 13. Dean MC. The developing dentition and tooth structure in hominoids. Folia Primatol (Basel). 1989; 53:
14. Boyde A. Developmental interpretations of dental microstructure. Primate Life Hist Evol Monogr Prima-tol. 1990; 14: 229–267.
15. Risnes S. Growth tracks in dental enamel. J Hum Evol. 1998; 35: 331–350. PMID:9774498
16. Ramirez Rozzi F. Can enamel microstructure be used to establish the presence of different species of Plio-Pleistocene hominids from Omo, Ethiopia? J Hum Evol. 1998; 35: 543–576. PMID:9774510
17. Newman HN, Poole DFG. Observations with scanning and transmission electron microscopy on the structure of human surface enamel. Arch Oral Biol. 1974; 19: 1135–1143. PMID:4531875
18. Risnes S. Structural characteristics of staircase-type Retzius lines in human dental enamel analyzed by scanning electron microscopy. Anat Rec. 1990; 226: 135–146. PMID:2301733
19. Dean MC, Scandrett AE. The relation between long-period incremental markings in dentine and daily cross-striations in enamel in human teeth. Arch Oral Biol. 1996; 41: 233–241. PMID:8735009
20. Guatelli-Steinberg D. What can developmental defects of enamel reveal about physiological stress in nonhuman primates? Evol Anthropol Issues News Rev. 2001; 10: 138–151. doi:10.1002/evan.1027
21. Hogg RT. Dental microstructure and growth in the Cebid Primates. PhD Dissertation, City University of New York. 2010.
22. Asper H. Über die“Braune Retzius’sche Parallelstreifung”im Schmelz der menschlichen Zähne. Schweiz Vierteljahrsschr Für Zahnheilkd. 1916; 26: 275–314.
23. Gysi A. Metabolism in adult enamel. Dent Dig. 1931; 37: 661–668.
24. Dean MC, Shellis RP. Observations on stria morphology in the lateral enamel ofPongo,Hylobatesand Proconsulteeth. J Hum Evol. 1998; 35: 401–410. PMID:9774502
25. Rose JC. Defective enamel histology of prehistoric teeth from Illinois. Am J Phys Anthropol. 1977; 46: 439–446. doi:10.1002/ajpa.1330460309PMID:871151
26. Rose JC, Armelagos GJ, Lallo JW. Histological enamel indicator of childhood stress in prehistoric skel-etal samples. Am J Phys Anthropol. 1978; 49: 511–516. doi:10.1002/ajpa.1330490411PMID:367176
27. Rose JC. Morphological variations of enamel prisms within abnormal striae of Retzius. Hum Biol. 1979; 139–151.
28. FitzGerald CM. Do enamel microstructures have regular time dependency? Conclusions from the litera-ture and a large-scale study. J Hum Evol. 1998; 35: 371–386. PMID:9774500
29. Risnes S. Rationale for consistency in the use of enamel surface terms: perikymata and imbrications. Eur J Oral Sci. 1984; 92: 1–5.
30. Preiswerk G. Beitrage zur Kenntnis der Schmelzstruktur bei Saugetieren mit besonderer Beriicksichti-gung der Ungulaten. PhD Dissertation, Universität Basel. 1895.
31. Pickerill HP. The structure of enamel. Dent Cosm. 1913; 55: 969–988.
32. Kölliker A. Mikroskopische Anatomie oder Gewebelehre des Menschen. Engelmann; 1854.
33. Dean MC, Beynon AD, Thackeray JF, Macho GA. Histological reconstruction of dental development and age at death of a juvenileParanthropus robustusspecimen, SK 63, from Swartkrans, South Africa. Am J Phys Anthropol. 1993; 91: 401–419. doi:10.1002/ajpa.1330910402PMID:8372933
34. Kawasaki K, Tanaka S, Ishikawa T. On the daily incremental lines in human dentine. Arch Oral Biol. 1979; 24: 939–943. doi:10.1016/0003-9969(79)90221-8PMID:232978
35. Newman HN, Poole DF. Dental enamel growth. J R Soc Med. 1993; 86: 61. PMID:20894848
36. Dean MC. The nature and periodicity of incremental lines in primate dentine and their relationship to periradicular bands in OH 16 (Homo habilis). In: Moggi-Cecchi J, editor. Aspects of Dental Biology: Palaeontology, Anthropology and Evolution. Florence; 1995. pp. 239–265.
37. Dean MC. Hominoid tooth growth; using incremental lines in dentine as markers of growth in modern human and fossil primate teeth. In: Hoppa R, FitzGerald C, editors. Human Growth in the past Studies from bones and teeth. Cambridge University Press. Cambridge; 1999. pp. 111–127.
38. Smith TM, Toussaint M, Reid DJ, Olejniczak AJ, Hublin J-J. Rapid dental development in a Middle Pa-leolithic Belgian Neanderthal. Proc Natl Acad Sci. 2007; 104: 20220–20225. doi:10.1073/pnas. 0707051104PMID:18077342
39. Smith TM, Reid DJ. Temporal nature of periradicular bands (‘Striae periradicales’) on mammalian tooth roots. Front Oral Biol. 2009; 13: 86–92. doi:10.1159/000242397PMID:19828976
40. Goodman AH, Rose JC. Assessment of systemic physiological perturbations from dental enamel hypo-plasias and associated histological structures. Am J Phys Anthropol. 1990; 33: 59–110.
41. Hillson S, Bond S. Relationship of enamel hypoplasia to the pattern of tooth crown growth: a discussion. Am J Phys Anthropol. 1997; 104: 89–103. PMID:9331455
42. Skinner MF, Pruetz JD. Reconstruction of periodicity of repetitive linear enamel hypoplasia from periky-mata counts on imbricational enamel among dry-adapted chimpanzees (Pan troglodytes verus) from Fongoli, Senegal. Am J Phys Anthropol. 2012; 149: 468–482. doi:10.1002/ajpa.22145PMID:
23041791
43. Beynon AD, Dean MC, Reid DJ. Histological study on the chronology of the developing dentition in go-rilla and orangutan. Am J Phys Anthropol. 1991; 86: 189–203. doi:10.1002/ajpa.1330860208
44. Dirks W, Reid DJ, Jolly CJ, Phillips‐Conroy JE, Brett FL. Out of the mouths of baboons: stress, life histo-ry, and dental development in the Awash National Park hybrid zone, Ethiopia. Am J Phys Anthropol. 2002; 118: 239–252. PMID:12115280
45. Schwartz GT, Reid DJ, Dean MC, Zihlman AL. A faithful record of stressful life events recorded in the dental developmental record of a juvenile gorilla. Int J Primatol. 2006; 27: 1201–1219.
46. Smith TM, Tafforeau P, Reid DJ, Grün R, Eggins S, Boutakiout M, et al. Earliest evidence of modern human life history in North African earlyHomo sapiens. Proc Natl Acad Sci. 2007; 104: 6128–6133. doi:
10.1073/pnas.0700747104PMID:17372199
47. Dean MC, Stringer CB, Bromage TG. Age at death of the Neanderthal child from Devil’s Tower, Gibral-tar and the implications for studies of general growth and development in Neanderthals. Am J Phys Anthropol. 1986; 70: 301–309. PMID:3752228
48. Dean C, Leakey MG, Reid D, Schrenk F, Schwartz GT, Stringer C, et al. Growth processes in teeth dis-tinguish modern humans fromHomo erectusand earlier hominins. Nature. 2001; 414: 628–631. doi:
10.1038/414628aPMID:11740557
49. Smith TM, Tafforeau P. New visions of dental tissue research: tooth development, chemistry, and struc-ture. Evol Anthropol Issues News Rev. 2008; 17: 213–226.
50. Elhechmi I, Braga J, Dasgupta G, Gharbi T. Accelerated measurement of perikymata by an optical in-strument. Biomed Opt Express. 2013; 4: 2124–2137. doi:10.1364/BOE.4.002124PMID:24156069
51. Bocaege E, Humphrey LT, Hillson S. Technical note: A new three-dimensional technique for high reso-lution quantitative recording of perikymata. Am J Phys Anthropol. 2010; 141: 498–503. doi:10.1002/ ajpa.21233PMID:19953528
52. Tafforeau P, Boistel R, Boller E, Bravin A, Brunet M, Chaimanee Y, et al. Applications of X-ray synchro-tron microtomography for non-destructive 3D studies of paleontological specimens. Appl Phys Mater Sci Process. 2006; 83: 195–202.
53. Tafforeau P, Smith TM. Nondestructive imaging of hominoid dental microstructure using phase contrast X-ray synchrotron microtomography. J Hum Evol. 2008; 54: 272–278. PMID:18045654
54. Tafforeau P, Zermeno JP, Smith TM. Tracking cellular-level enamel growth and structure in 4D with synchrotron imaging. J Hum Evol. 2012; 62: 424–428. doi:10.1016/j.jhevol.2012.01.001PMID:
22304852
55. Wilkins SW, Gureyev TE, Gao D, Pogany A, Stevenson AW. Phase-contrast imaging using polychro-matic hard X-rays. Nature. 1996; 384: 335–338.
56. Bronnikov AV. Theory of quantitative phase-contrast computed tomography. J Opt Soc Am A. 2002; 19: 472–480. PMID:11876309
57. Betz O, Wegst U, Weide D, Heethoff M, Helfen L, Lee W-K, et al. Imaging applications of synchrotron X-ray phase-contrast microtomography in biological morphology and biomaterials science. I. General aspects of the technique and its advantages in the analysis of millimetre-sized arthropod structure. J Microsc. 2007; 227: 51–71. PMID:17635659
58. Bronnikov AV. Phase-contrast CT: fundamental theorem and fast image reconstruction algorithms. Op-tics & Photonics. International Society for OpOp-tics and Photonics; 2006. pp. 63180Q1–7.
59. Tafforeau P, Bentaleb I, Jaeger J-J, Martin C. Nature of laminations and mineralization in rhinoceros enamel using histology and X-ray synchrotron microtomography: potential implications for palaeoenvir-onmental isotopic studies. Palaeogeogr Palaeoclimatol Palaeoecol. 2007; 246: 206–227.
60. Smith TM, Le Cabec A, Bonnin A, Houssaye A, Pouech J, Moggi-Cecchi J, et al. Resolving Pliocene and Pleistocene hominin dental ontogeny with synchrotron virtual histology. American Journal of Physi-cal Anthropology. Calgary, Alberta, Canada; 2014. p. 243.
61. Smith TM, Tafforeau P, Le Cabec A, Bonnin A, Houssaye A, Pouech J, et al. Dental Ontogeny in Plio-cene and Early PleistoPlio-cene Hominins. PloS One. 2015; 10: e0118118. doi:10.1371/journal.pone. 0118118PMID:25692765
63. Le Cabec A, Tafforeau P, Smith TM, Carlson KJ, Berger LR. Dental development of the Australopithe-cus sedibajuvenile MH1 determined from synchrotron virtual paleohistology. American Journal of Physical Anthropology. Calgary, Alberta, Canada; 2014. p. 166.
64. Le Cabec A, Tafforeau P, Smith TM, Carlson KJ, Berger LR. Dental Development of the Australopithe-cus sedibaJuvenile MH1 Determined from Synchrotron Virtual Paleohistology. Proceedings of the Eu-ropean Society for the study of Human Evolution 3. Florence, Italy; 2014. p. 103. Available:http://www. eshe.eu/static/eshe/files/PESHE_3_2014_Florence.pdf
65. Phong BT. Illumination for computer generated pictures. Commun ACM. 1975; 18: 311–317. 66. Abel RL, Laurini CR, Richter M. A palaeobiologist’s guide to“virtual”micro-CT preparation. Palaeontol
Electron. 2012; 15: 1–17.
67. FitzGerald CM. Tooth crown formation and the variation of enamel microstructural growth markers in modern humans. PhD Dissertation, University of Cambridge. 1995.
68. Schwartz GT, Dean C. Ontogeny of canine dimorphism in extant hominoids. Am J Phys Anthropol. 2001; 115: 269–283. doi:10.1002/ajpa.1081PMID:11424078
69. Bromage TG, Dean MC. Re-evaluation of the age at death of immature fossil hominids. Nature. 1985; 317: 525–527. doi:10.1038/317525a0PMID:19093314
70. Schwartz G, Reid D, Dean C. Developmental Aspects of Sexual Dimorphism in Hominoid Canines. Int J Primatol. 2001; 22: 837–860. doi:10.1023/A:1012073601808
71. Smith TM. Incremental development of primate dental enamel. PhD Dissertation, Stony Brook Universi-ty. 2004.
72. Dean MC, Beynon AD, Reid DJ, Whittaker DK. A longitudinal study of tooth growth in a single individual based on long- and short-period incremental markings in dentine and enamel. Int J Osteoarchaeol. 1993; 3: 249–264. doi:10.1002/oa.1390030404
73. Huda TF, Bowman JE. Variation in cross-striation number between striae in an archaeological popula-tion. Int J Osteoarchaeol. 1994; 4: 49–52.
74. Mahoney P. Incremental enamel development in modern human deciduous anterior teeth. Am J Phys Anthropol. 2012; 147: 637–651. doi:10.1002/ajpa.22029PMID:22331636
75. FitzGerald CM, Rose JC. Reading between the lines: dental development and subadult age assess-ment using the microstructural growth markers of teeth. Biol Anthropol Hum Skelet Second Ed. 2000; 237–263.
76. Richards GD, Jabbour RS, Horton CF, Ibarra CL, MacDowell AA. Color changes in modern and fossil teeth induced by synchrotron microtomography. Am J Phys Anthropol. 2012; 149: 172–180. doi:10. 1002/ajpa.22103PMID:22729785
77. Tafforeau P, Le Cabec A, Bonazzi M, Schünemann V, Viola B, Harvati K, et al. Insights about the effect of X-ray imaging on recent fossils: facts, deductions, speculations and phantasms. Proceedings of the European Society for the study of Human Evolution 2. Vienna, Austria; 2013. p. 224. Available:http:// www.eshe.eu/static/eshe/files/ESHE_Vienna_2013_Abstracts.pdf
78. Suwa G, Kono RT, Simpson SW, Asfaw B, Lovejoy CO, White TD. Paleobiological Implications of the Ardipithecus ramidus Dentition. Science. 2009; 326: 69–99. doi:10.1126/science.1175824
79. Moggi-Cecchi J, Tobias PV, Beynon AD. The mixed dentition and associated skull fragments of a juve-nile fossil hominid from Sterkfontein, South Africa. Am J Phys Anthropol. 1998; 106: 425–465. doi:10. 1002/(SICI)1096-8644(199808)106:4<425::AID-AJPA2>3.0.CO;2-IPMID:9712475
80. Hassett BR. Missing defects? A comparison of microscopic and macroscopic approaches to identifying linear enamel hypoplasia. Am J Phys Anthropol. 2013; n/a–n/a. doi:10.1002/ajpa.22445
81. Reid DJ, Beynon AD, Ramirez Rozzi FV. Histological reconstruction of dental development in four indi-viduals from a medieval site in Picardie, France. J Hum Evol. 1998; 35: 463–477. PMID:9774506
82. Reid DJ, Dean MC. Brief communication: the timing of linear hypoplasias on human anterior teeth. Am J Phys Anthropol. 2000; 113: 135–139. PMID:10954627
83. Skinner M, Anderson GS. Individualization and enamel histology: a case report in forensic anthropolo-gy. J Forensic Sci. 1991; 36: 939–948. PMID:1856657
84. Yamashita Y, Ichijo T. Comparative studies on the structure of the ameloblasts. Mechanisms of tooth enamel formation Part I—Cytology and Cytochemistry of Forming Cells. Tokyo: Quintessence; 1983. pp. 91–107.