11-1960
Equilibrium distribution studies of dysprosium
nitrate-erbium nitrate-nitric acid-tributyl phosphate
systems
Michael Robert Dinnin Jr.
Iowa State UniversityMorton Smutz
Iowa State UniversityFollow this and additional works at:
http://lib.dr.iastate.edu/ameslab_isreports
Part of the
Chemistry Commons
This Report is brought to you for free and open access by the Ames Laboratory at Iowa State University Digital Repository. It has been accepted for inclusion in Ames Laboratory Technical Reports by an authorized administrator of Iowa State University Digital Repository. For more information, please [email protected].
Recommended Citation
Dinnin, Michael Robert Jr. and Smutz, Morton, "Equilibrium distribution studies of dysprosium nitrate-erbium nitrate-nitric acid-tributyl phosphate systems" (1960).Ames Laboratory Technical Reports. 38.
nitric acid-tributyl phosphate systems
Abstract
'!be equilibrium distribution of dysprosium nitrate, erbium nitrate, and nitric acid between water and tributyl phosphate was studied in this research. Separate equilibrium data were obtained for the distribution of dysprosium nitrate-nitric acid, erbium nitrate-nitric acid, and dysprosium nitrate-erbium nitrate-nitric acid mixtures. The equilibrium data were obtained by making single stage extractions from aqueous feed solutions using commercial grade tributyl phosphate. Equilibrium distribution of solutes was determined by analysis of each phase from the single stage extractions.
Disciplines Chemistry
1
I S-332
EQUILIBRIUM DISTRIBUTION STUDIES OF
DYSPROSIUM ERBIUM
NITRATE-NITRIC ACI D-TRI BUTYL PHOSPHATE SYSTEMS
By
Michael Robert Dinnin, Jr. Morton Smutz
November 1960
F. H. Spedding, Director, Ames Laboratory.
Work performed under Contract No. W-7405-eng-82.
LEGAL
NOTICE
This report was prepared as an account of Government sponsored work. Neither the United States, nor the Commission, nor any person acting on behalf of the Commission:
A. Makes any warranty or representation, expressed or Implied, with respect to the accu-racy, completeness, or usefulness of the Information contained in this report, or that the use of any Information, apparatus, method, or process disclosed In this report may not Infringe privately owned rights; or
B. A11sumes any liabilities with respect to the use of, or for damages resulting from the use of any information, apparatus, method, or process disclosed In this report.
As used In the above, "person acting on behalf of the Commission" Includes any em-ployee or contractor of the Commission, or emem-ployee of such contractor, to the extent that such employee or contractor of the Commission, or employee of such contractor prepares, disseminates, or provides access to, any Information pursuant to his employment or contract with the Commission, or his employment with such contractor.
This report has been reproduced directly from the best available copy.
CHEMISTRY
EQUILIBRIUM DISTRIBUTION STUDIES OF DYSPROSIUM ~HTRATE-ERBIUM NITRATE-NITRIC ACID-TRIBUTYL
PHOSPHATE SYSTEMS
By
Michael Robert Dinnin, Jr.
Morton
~utz~Jovember,
19CO
Ames Laboratory
TABLE OF CONTENTS
Page
NOMEN CLA'IURE vii
ABSTRACT ix
INTROOUCTION 1
LIT.IRA'l'URB REVIIW
4
EXPBRIMINTAL PROCKOORB
1&
BXPERIMBNTAL RmULTS
8
DISCUSSIOO c:l RBSULTS
28
Equilibrium Data
28
Correlation
ot
Equilibrium Data29
Prediction
ot
~libria31
( Sample Calculation
34
'
CONCWSIOOS
37
BIBLIOGRAPHY
39
1. Equilibrium distribution data tor the d;ysprosium
nitrate-nitric acid-tributyl phosphate-water ayatea 10
2. Equilibrium distribution data tor the erbium nitrate-nitric
acid-tributyl phosphate-water ayatem
13
3.
Equilibrium distribution data tor the d;yaprosiumnitrate-erbium nitrate-nitric acid-tributyl phosphate-water ayatem
15
4.
Predicted equilibrium datator
the eyaprosiua nitrate-erbium nitrate-nitric acid-tributyl ph011phate-water syatemLIST t:. I'IOURIS
~e
1. Total distribution coefficient tor dyaproeium nitrate-nitric acid mixtures as a function
at
the compositionand concentration
at
the aqueoua phase 17 2. Total distribution coe:rticienttor
erbiumnitrate-nittic acid mixtures as a function
at
the compositionand concentration
ot
tbe aquaoua pr..ae 18'·
Nitric acid distribution coefficienttor
dysprosium nitrate-nitric acid and erbium nitrate-nitric acid mixtures. as a functionot
the ccmpoeitiooat
the aqueou.sphase at Dlwr
(aq. )
equal. to3.
0 194.
Nitric acid distribution coefficient tor dysprosiumnitrate-nitric acid and erbium nitrate-nitric acid
mixtures as a function
ot
the ccq>OSitiooot
tbe aqueousphase at·
Dlwr
(aq.) equal to4.
0 205.
Nitric acid distribution coefficienttor
dysprosium nitrate-nitric acid and erbium nitrate-nitric acidmixtures as a :function
at
the compositionot
the aqueou.sphase at
m.r
(~.)
equal to5.
0 216.
Nitric acid distribution coefficient tor dysprosium nitrate-nitric acid and erbium nitrate-nitric acidmixtures as a tunction
ot
the caapoeitionot
the aqueousphase at
Dlwr
(aq. ) equal to 7. 0 221·
Nitric acid distribution coefficient for dysprosium nitrate-nitric acid and erbium nitrate-nitric acid mixtures as a tunctionot
the compositionot
the aqueousphase at
m.r
(aq. ) equal to 10.023
8.
Nitric acid distribution coefficient tor dysprosium nitrate-nitric acid and erbium nitrate-nitric acid mixtures as a functionot
the compositionot
the aqueousphase at
m.r
(aq.) equal to 13.0 249.
Nitric acid distribution coefficient for dysprosium nitrate-nitric acid and erbium nitrate-nitric acid mixtures as a fUnction of the compositionot
the aqueousll. Separatioo factor between erbium nitrate and dysprosium
nitrate for tbe dysprosium nitrate-erbium nitrate-nitric acid-TBP-water system as a f'unctioo of the total concentratioo
ot
- total molality ot either phase; equivalents of total nitrate
per 1000 grama ot solvent
- molality ot nitric acid in either phase
- molality ot dysprosium nitrate in either phase given in
terms of nitrate ion
- aolality of erbium nitrate in either phase given in terms
ot nitrate ion
K - distribution coefficient of any solute; concentration
ot
solute in organic phase divided by concentration of same
solute in aqueous phase
- distribution coefficient of nitric acid; ~0, {org. )/~0, {aq.)
- distribution coefficient
ot
dysprosium nitrate;~(org.)/~{aq.)
- distribution coefficient ot erbium nitrate;
~(org.)/~{aq.)
distribution coefficient based an the total molality
of each phase; ~(org.)/~(aq.)
~A-B - separation factor between A and B; KA/~
~~-~ - separation factor between erbium nitrate and
dysprosium nitrate; ~~
- rare-earth nitrate composition; equivalents of rare-earth
- eysprosium nitrate Callp08itioo; equivalents
at
~sprosium nitrate per total equivalentsat
nitrate (aqueous phase) - erbium nitrate c~itioo; equivalentsat
erbium nitrateper total equivalents
at
nitrate(aqueous
pbase)- equivalents
at
~aprosium nitrate per total equivalentsat
rare-earth nitrate (aqueoua phase)- equivalents
at
erbium nitrate per total equivalentsat
rare-earth nitrate (aqueoua phase)NITRIC ACID-TRIBUYTL PHOSPHATE SYSTEMS*
by
Michael
Robert Dinnin,Jr., and Morton Smutz
ABSTRACT
'!be equilibrium distributioo of dysprosium nitrate, erbium nitrate,
and nitric acid between water and tributyl phosphate was studied in
this research. Separate equilibrium data were obtained for the
dis-tribution of dysprosium nitrate-nitric acid, erbium nitrate-nitric acid,
and dysprosium nitrate-erbium nitrate-nitric acid mixtures. '!be
equilibrium data were obtained by making single stage extractioos fran
aqueous feed solutions using cCJDJDercial grade tributyl phoepbate.
Equilibrium distribution of solutes was determined by analysis of each
phase fran the single stage extractioos.
Equilibrium data for the czysprosium nitrate-nitric acid and erbium
nitrate-nitric acid mixtures were correlated in such a manner that the
total distributioo of eolutes and the distribution
ot
nitric acid couldbe found for dysprosium nitrate-erbi\.ml nitrate-nitric acid mixtures.
The separation factor between dysprosium nitrate and erbium nitrate for
dysprosium nitrate-erbium nitrate-nitric acid mixtures was shown as a
function of the total molality
ot
the aqueous phase. Equilibriumdis-tribution curves were presented for pure dysprosium nitrate and pure
erbium nitrate.
A method was presented for predicting the concentrations of
dysprosium nitrate, erbium nitrate, and nitric acid in an organic phase of tributyl phosphate when the concentratioos of these same
three solutes in the aqueous phase were known, and the two phases were
in eq~.lilibrium. 'lhis method was demoo.strated by means of a sample
calculation. Al..so, a cc::aparilon between predicted concentrations and
actual concentrations obtained f'rcn ten extractions with eysprosium
'!be titteen elementa
at
atCIDic number57
through71
are ca.:mJ.1referred to aa the rare-earth 11111tal.a. Indlutrial uaea
tor
taeM 11111tal.aare relativeJ.1 amall at the present tilllll, although coo.aidm'Mle renarch
with the rare eartha ia nov in progreaa and it 1a poesible that there
uay be an increased ~d
tor
them in the near future. b term rareis saDewbat
or
a misnaDer becauae the raw •teriala traa which theseelements can be produced are quite pl.ent~. Hawver, the rare eartha
al~s occur aa mixture• in nature, and aeparating them trc. ooe another
is difficult due to their chemical similarity.
CaiiDercial producticm
at
the rare earths ia nov carried CAJ.t by theseparaticm process
or
icm exchange. 1be icm exchange 11111thod 1a&d-vantagew.s in that it gives very good separaticms, but there are
draw-backa such as lov flov rates and sem1-ccmtinuOU8 operaticm W.ich cou.ld
be improved by using the separaticm technique
ot
aolvent extracticm.For saDe tilllll it baa been known that the rare earths could &lao be
separated by solvent extracticm, and considerable research baa been
directed towarda the development of a solvent extraction process for
producing the rare earths.
'nle solvent most CCimlally used
tar
extracting the rare earths istributyl phosphate (TBP). 'nle rare earths are first digested f'ran the
ores using sulfuric acid. Next they are separated f'rca impurities and
converted to the nitrate form. The rare-earth nitrates and nitric acid
phosphate. In order to design a Dalltistage solvent extractioo process for separating the rare earths, which utilizes this principl.e, it is
necessary to be able to predict the equilibrium cooditioos throughout
the process. This predictioo
ot
equilibri\a Dl18t take into accwnt theequilibrium distributioo
ot
nitric acid and tbe rare-earth nitrateswhich are present. Schoenherr (8) 'WU the tirst to develop a method
ot
predictioo where nitric acid 'WU coosidered u ooeot
the solutes.He used a samarium nitrate-neodymi'll!l nitrate-nitric acid-TBP-water
system. However, bet ore Schoenherr's method
ot
equilibrium predictioncould be applied to the entire rare-earth series, f'lll'ther investigatioo
ot
other rare-earth nitrate-nitric acid-TBP-water ~stems was needed todetermine i t their behavior would be the same.
'!he equilibrium distributioo
ot
the eysprosium nitrate-erbiumnitrate-nitric acid-T.BP-water system was studied in this research in
order to develop a method
ot
predicting equilibrium distributioo fortwo ot the heavier elements in the rare-earth series. '!he method tor predicting equilibrium distributioo cou1d then be used for tinding
stagewise conditions tor this system when designing a solvent extraction
process. Concurrent with this research,the equilibrium distribution
ot
the lanthanum nitrate-praeseodymium nitrate-nitric acid-TBP-water system
1
was being studied by Sharp. It is expected that the prediction
technique will lead to a method for predicting equilibria for any rare
-earth nitrate-nitric acid-TBP-water system.
~-
M. Sharp, Ames, Iowa. Equilibrium distribution of the lanthanum nitrate-praeseodymium nitrate-nitric acid-TBP-water system. PrivateDysprosium and erbium were chosen tor the study because they were
tvo of the heavier rare earths sufficiently plentiful tram a cost
standpoint, and also, the concentr&.tioo of dysprosium and erbium could
be found by infra-red spectrophotometric analysis for the extractions
In
1937,
Fischer, et al.(4)
made the !irst stuey concerned withseparating the rare-earth elements by solvent extraction. ~ey f'ound
a separation f'actor a! 1.5 between adjacent rare-earth chlorides when
extracting with various alcohols and ethers. ~eir experimental data
have not been verified by other investigators.
Peppard, et al. (7) investigated the equilibrium distribution of'
dif'!erent rare earth nitrates between tributyl phosphate and -water in
the presence a! nitric acid. All their data were obtained at low rare
earth concentrations.
Weaver, et &1. (10) produced one kilogram a!
95
per cent gadoliniumoxide by means
ot
solvent extraction. ~ey started with a teedcon-siderably enriched in gadolinium oxide and kept the nitric acid
concen-tration above 10 nonal at all times. 'lXibutyl phosphate 'WaS used as
the solvent.
Bochinski,
!1
&1.(3)
reported that the rare-earth nitrates couldbe separated by extracting with tributyl phoapbate without using excess
nitric acid or salting-out agents. They !ound that the separation
f'actors between rare-earth nitrates increased with increasing rare-earth
coo.centration and were independent of the caapoeition
ot
the rare-earthnitrate mixture. It was determined that the distribution o! rare earths
between the aqu.eoua and organic phase was practically independent of'
rare earth CCIIIposition and aeemed to depend only on the total
for determining optiDIJm operating ccmdi tiona in a solvent extraction
process for separating the rare earths. ~~ calculation method w.s
substantiated by experimental results obtained fraa a Dlltistage
countercurrent extraction run.
Knapp ( 6) obtained equilibrium data for the extractioo
ot
themooazite rare earths vith tributyl pho.phate. He studied the effects
of nitric acid concentration and salting-out agents on separation
factors and distribution coe~icients. The extractability of the pure
rare earths was foond to increase vith atanic number up to dysprosium
and then decrease vith further increase in ataaic number. Distribution
curves of the pure rare earths were used to predict the effect
ot
rare-earth concentratioo. on sepe.:ratioo. factors in systems which contained
no acids or salting-out agents.
Atwood (1) studied the e~ect of chelating agents on the separation factors between adjacent rare earths. Salts of
etbylened1am1netetra-acetic acid were used as the chelating agents. He found that the
addi-tion of these salts increased the separaaddi-tion factor for rare-earth
mixti.lres in which the rare earth which formed the more stable chelate
was the less extractable rare earth.
Schoenherr (8) obtained equilibrium data for mixtures of neodymium
nitric acid, samarium nitric acid, and neodymium
nitrate-samarium nitrate-nitric acid distributed between water and tributyl
phosphate. He presented a method for predicting the equilibrium
dis-tribution of mixtures of neodymium nitrate, samarium nitrate, and nitric
data obtained. A sample calculation was given to illustrate this method
ot
predicting equilibria. He stated that equilibriator
otherrare-earth nitrate-nitric acid mixtures might also be predicted in a similar
'lbe purpose ot this experimental work was to obtain equilibrium
distribution data
tor
the following systems: 1) dysprosiumnitrate-nitric tributyl phosphate-water, 2) erbium nitrate-nitrate-nitric
acid-tributyl phosphate-water, and 3) dysprosium erbium
nitrate-nitric acid-tributyl phosphate-water. The equilibrium data obtained
tor
the first two systems were to be used in predicting the equilibriumdistribution
ot
solutes in the third system.These distribution data were obtained by contacting an aqueous
teed solution containing the desired solutes with an organic solvent,
and performing a single stage extraction. The organic solvent, which
was coomercial grade tributyl phosphate (TBP), was equilibrated with
water bet ore being used in the extractions.
Stock solutions
ot
dysprosium nitrate and erbium nitrate wereprepared by dissolving the
axide ot
the rare earth in nitric acid. Thesolutioo was then brooght to a boil in order to drive
ott
the excessnitric acid, leaving the rare-earth nitrate in aqueous solution. These
stock solutions were analyzed to determine the rare-earth nitrate
content. Feed solutions to be used in the single stage extractions
were then prepared by taking aliquots tram the rare-earth nitrate stock
solutions and adjusting the acid content to the desired level by adding
a known amount of reagent grade nitric acid. These teed solutions
ot
known composition and concentration were shaken together with the water
equilibrated tributyl phosphate in sixty milliliter separatory tunnels.
equi-was approximately
76°
F. By varying the amounts of the different solutesin the feed solutions, it
was
possible to get equilibrium data whichcovered a range of compositions and concentrations for the three systems.
<nee equilibrium was attained, the phases were separated and
samples were taken from each phase in order to determine the equilibrium
distribution of solutes. Two methods were used to analyze for the rare
earths. The first method was a gravimetric determination in which the
rare-earth nitrate was precipitated from solution using saturated oxalic
acid. 'llie rare-earth oxalate was then filtered and burned to the oxide
at 900° C. The second method used to determine the rare-earth
concentra-tion was a chelometric titraconcentra-tion using arsenazo as the indicator. Nitric
acid content was determined by complexing the rare-earth nitrate with
potassium ferrocyanide and then titrating for the remaining acid with
sodium hydroxide. Before analyzing the organic phase samples, it was
Equilibrium data obtained for the dysprosium nitrate-nitric
acid-TBP-water system and the erbium nitrate-nitric acid-acid-TBP-water system
are presented in Table 1 and Table 2. '1be rare-earth nitrate molalities
and nitric acid molalities rei' erred to throughout this report are given
in terms of the cc:mnon nitrate ioo. coo.centratioo.. In other words, a
solution of one molal rare-earth nitrate coo.centration would be three
molal in nitrate ion coo.centration. In this n:anne:z; the coo.centratioo.
of all solutes could be expressed oo. the same basis. The nCJDenclature
section should be consulted for an explanation of the symbols 'Which are
used.
Using the equilibrium data fran Table 1 and Table 2, two types of
plots were constructed. In both types,total molality of the aqueous
phase was used as a parameter. 'lhe first type was a plot of the total
distribution coefficient versus the rare-earth nitrate composition.
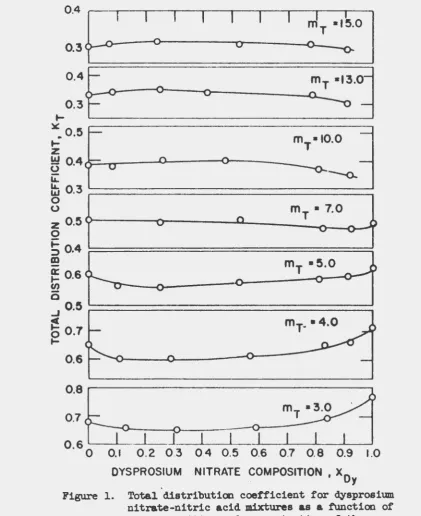
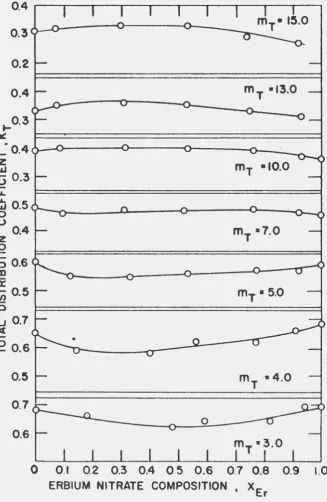
These plots are presented in Figure 1 for the dysprosium nitrate-nitric
acid-TBP-water system, and in Figure 2 tor the erbium nitrate-nitric
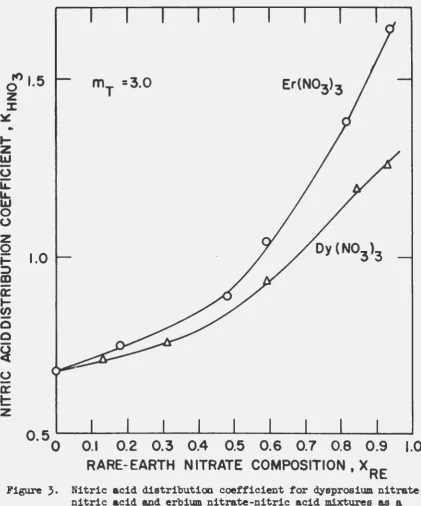
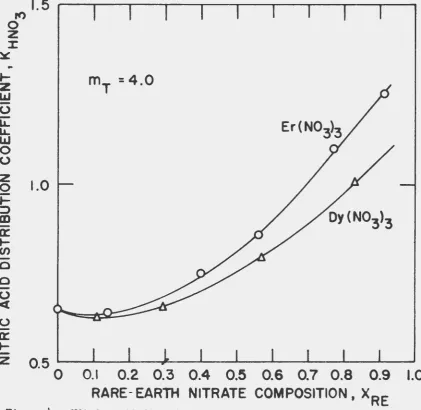
acid-TBP-water system. The second t~ was a plot
ot
the nitric aciddistribution coefficient versus the rare-earth nitrate composition.
These plots are presented in Figure ~ through Figure
9
for both sets o1'equilibrium data given in Table 1 and Table 2.
Equilibrium data obtained by Schoenherr (9) for the distribution
of pure nitric acid between water-equilibrated T.BP and water were
~apro.ila nitrate distribution and pure e:rbiwa nitrate distribution.
'lhe equilibrium data obtained f'raa the extractions with the
cyapro.itilll nitrate-erbila nitrate-nitric acid-TBP-w.ter syatea are ginn
in 'lable
3.
J'rc:. theae data,a plotat
the separation factor betweenerbium and cyspro.ila nrsua the total .olal1ty
at
the aqueou.a phuew.a constructed aa shown in Figure 11. 1be position
at
the straightline throogh these points w.a determined by a leut aquarea ~aia
at
the data.'DM! method
at
predicting equilibria for a ~apro.iwanitrate-erbium nitrate-nitric acid-TBP-w.ter ayatea uaed in thia report enables
the ccapoaitioo
ot
an organic phase to be predicted which wou.ld be inequilibrium with an aqueous phase
ot
known ccapoaition. Uaing thiamethod for predicting equilibria, tbe CCJDp<>sition
at
the organic phasewaa calc:u.lated
tor
eachot
the ten extractiona Dade w1 th the ~aproaiumnitrate-erbium nitrate-nitric acid-TBP-water system. 'lbe reaulta
ot
these predictiooa, alal8 w1 th the per cent errors traa the actual value a
AqUeoua pbue coocentratiODa
Organic
pbasecoocentraticm..
Distributioo
Run in
mol&l.ities
inmolalities
coefficient•
number
'
~0,
m.r
"
-ua,
m.r
K;
11m
a,
1
1.829
1.961
3.790
o.a-,o
1.530
2.4-oo
0.633
0.78o
2
3·535
1.718
5·253
1.756
1.238
2.994
0.570
0.721
3
0.342
2.297
2.639
0.109
1.696
1.8o5
0.684
0.1.}8
4
0.814
1.8}6
2.650
0.293
1.476
1.769
0.668
o.aoa.
5
1.527
1.o87
2.614
0.684
1.101
1.785
0.68,}
1.0~6
2.184
0.523
2.7Cf7
1.213
0.633
1.846
0.682
1.210
b
1
2.590
0.198
2.788
1.633
0.269
1.902
0.682
1.359
8
0.424
3.o68
3.492
0.184
2.023
2.2Cf7
0.632
0.659
9
1.025
2.41.6
3.441
0.457
1.725
2.182
0.6}4
0.714
10
2.029
1.370
3.399
0.992
1.203
2.195
0.646
0.878
11
2.792
0.444
3.2,}6
1.730
0.521
2.251
0.696
1.173
12
3.2.}6
0.228
3.464
2.219
0.249
2.468
0.712
1.092
13
0.545
6.222
6.767
0.305
2.849
3.154
0.466
0.458
14
1 .
.}483.971
5.319
0.673
2.193
2.866
0.539
0.552
15
2.774
2.544
5.3l.8
1.301
1.656
2.957
0.556
0.651
Table
1
(continued)Aqueous phase concentrationa Organic phase concentrations Distribution
Run in molalities in molalities coefi'icients
number
1Dny
~a,
m.r
1Dny
~a,
m.r
K..r
~a,
16
0.685
7.200
7.885
0.395
2.942
3.337
0.423
0.409
17
1.936
5.835
7.711
0.889
2.660
3.549
0.457
0.456
18
4.187
3.733
7.920
1.576
1.994
3.570
0.451
0.534
19
6.531
1.~57.916
2.369
0.930
3·299
0.417
0.671
20
7·685
0.539
8.224
2.924
0.390
3.314
o.4o3
0.724
21
0.958
10.016
10.974
0.612
3.378
3.990
0.364
0.337
~
22
2.88o
8.121
11.001
1.140
2.906
4.o46
0.368
0.358
23
5.491
7.431
12.922
1.676
2.716
4.452
0.345
0.374
24
4.218
l.o63
5.281
2.073
0.863
2.936
0.556
0.812
25
4.829
0.457
5.286
2.650
0.355
3·005
0.568
o.m
26
8.818
2.211
11.029
2.460
1.401
3.861
0.350
0.634
27
10.581
0.887
11.468
3.032
0.686
3-718
0.324
0.713
28
1.127
14.340
15.467
0.935
3-791
4.726
0.3o6
0.264
[image:25.559.80.669.89.493.2]Aqueous phase concentrations Organic phase concentrations Distribution
Run in molalities in molalities coefficients
number
ID.ny
~~
m..r
~
~~
m..r
K.r
~~
30
8.355
7.357
15.712
2.029
2.775
4.8o4
0.3o6
0.377
31
11.411
3.269
14.68o
2.5o4
2.019
4.523
0.3o8
0.618
32
12.649
1.3o8
13.957
3.014
1.074
4.o88
0.293
0.821
33
0.867
11.298
12.165
0.896
3.766
4.662
0.383
0.333
34
3.412
11.024
14.4}6
1.470
3.341
4.811
0.333
0.303
35
1.2o4
16.627
17.831
1.178
3.730
4.908
0.275
0.224
h)
}6
4.139
13.686
17.825
1.750
3.638
5.388
0.302
0.266
37
2.699
21.039
23.738
1.899
4.510
6.409
0.270
0.214
q
[image:26.560.77.663.148.414.2]Table
2. Equilibrium distribution
datator
theerbium nitrate-nitric acid-tributy1
phosphate-water system
Aqueous
pb&ae concentrations
Organic phase concentrations
Distribution
Run in
mol&l.ities
inmol&lities
coefficients
number
'
~a,
~~
DU~
m.r
K.r
~a,
1
0.391
1.418
1.809
o.o669
1.249
1.316
0.727
0.881
2
1.035
1.691
2.726
0.303
1.527
1.830
0.671
0.903
3
1.661
1.100
2.761
0.558
1.199
1.757
0.636
1.090
4
2.133
0.352
2.485
1.044
0.541
1.585
o.6,S
1.537
5
2.489
0.1o8
2.597
1.599
0.195
1.794
0.691
1.8o6
6
0.488
1.993
2.481
O.ll9
1.588
1-707
0.688
0.797
t:
7
1.393
1.4<>3
2.796
0.456
1.295
1-751
0.626
0.923
8
2.1o6
1.613
3-719
0.902
1.456
2.358
0.6}4
0.903
9
2.865
0.864
3-729
1.389
0.984
2.373
0.636
1.139
10
3-363
0.319
3.682
2.107
0.426
2.533
0.688
1-335
l l
0.554
4. 719
5-273
0.261
2.538
2.799
0.531
0.5,S
12
1.668
3-476
5.144
0.703
2.127
2.830
0.550
0.612
13
2.886
2.869
5-755
1.171
1.844
3.015
0.524
0.643
14
4.094
1.255
5-349
1.837
1.124
2.961
0.554
0.896
[image:27.562.80.658.83.509.2]Aqueous p.baae concentrations Organic phase concentrations Di•tributioo
Run in molalities in molalities coetf'icient•
number
'
~a,
m.r
'
~a,
m.r
~
~a,
16
0.689
6.991
7.68o
0.441
}.Oil}.452
0.449
0.4}1
17
2.}}9
5-335
7.674
1.015
2.465
}.48o
0.453
0.462
18
4.o84
}.655
1·139
1.493
1.977
}.470
0.448
0.541
19
5.900
1.984
7.884
2
.
053
1.388
}.441
0.436
0.700
20
7.460
0.658
8.11B
2.854
0.514
}.}680.415
0.781
21
l.o46
14.}18
15.}64
1.030
}.786
4.816
0.}13
0.264
~
22
4.563
10.623
15.186
1.981
2.956
4.937
0.}25
0.278
23
.
8.255
7.254
15.509
2.0ll.
2.914
4.925
0.}18
0.402
24
ll.. 789
4.}10
16.099
2.417
1.989
4.4o6
0.274
0.461
25
13.923
1.288
15.2ll
}.000l.ll9
4.ll.9
0.271
0.869
26
0
.
980
10.439
ll..419
o.6o8
3.568
4.176
0.}66
0.342
27
}.}16
7.517
10.833
1.261
2.8o8
4.o69
0.}76
0.}74
28
5.892
5.143
ll..0}5
1.726
2.317
4.o4}
0.}66
0.451
29
8.395
2.68o
ll-075
2.24
9
1.734
3-983
0
.
}6o
0.647
30
10.6}4
0.842
ll..476
2
.
997
0.756
}
.
753
0.327
0.898
[image:28.559.72.669.71.499.2]Table 3· Equilibrium distribution
datator
the dysprosium nitrate-erbium nitrate-nitric
acid-tributyl phosphate-water system
Aqueous phase concentrations
Organic phase concentrations
Distribution
Sepe.ratioo
Runin molalities
inmolalities
coefficients
tactor
number
~
~Dlzma,
m.r
~
~Dlzmo,
m.r
K.r
11m
a,
~Er-Dy
1
1.939
1.478
1.869
5.286
0.918
0.592
1.411
2.921
0.553
0.755
0.848
2
1.372
1.974
3.027
6.373
o.6oo
0.775
1.9o6
3.281
0.515
0.630
0.899
3
2.703
2.122
3.382
8.207
0.915
0.779
1.945
3.639
0.443
0.575
l.o83
4
2.908
4.456
3.212 10.576
0.8<)1
1.253
1.828
3.882
0.367
0.569
1.023
5
4.953
4.605
3.162 12.720
1.101
1.202
1.892
4.195
0.330
0.598
1.176
6
1.414
1.992
1.819
5.225
0.683
0.836
1.314
2.833
0.542
0.722
0.870
~7
2.oo8
1.378
2.953
6.339
0.890
0.531
1.741
3.162
0.499
0.590
0.869
8
2.216
2.609
3·355
8.18o
0.749
0.876
1.820
3.445
0.421
0.542
0.994
9
4.481
2.009
3.172 10.542
1.217
0.833
1.755
3.8o5
0.361
0.553
1.059
[image:29.554.87.668.120.451.2]Run
number
1
2
3
4
5
6
1
8
9
10
~
0.555
0.5o6
0.450
0.382
0.335
0.558
0.510
0.449
0.383
0.334
'/o
error
+0.36
-1.74
+1.58
+4.09
+1.52
+ 2.95
~.20-+6. 65
-+6.09
+3-09
31'!'
{org. )
2.94
3.22
3.69
4.DI.
4.26
2.92
3.23
3.67
4.DI.
4.25
'f.
error
+0.68
-1.83
+1.37
+4.12
+1.43
+ 3.18
~.22-+6.38
-+6.DI.
+3-15
KHN~
0.170
0.620
0.58o
0.582
0.581
0.199
0.621
0.517
0.575
0.579
~'f.
e or
+1.99
-1.59
+0.87
~.28-2.84
+10.66
+?.25
-+6.46
+3.98
+0.35
DlHN~{org.)
1.91
1.88
1.96
1.87
1.84
1.45
1.83
1.94
1.82
1.83
'f,
e or
~.14-1.57
+0.51
~.19-2.65
+10.69
+?.17
-+6.59
+3.41
+0.55
~
(org.)
0.901
0.58o
0.954
0.838
1.07
0.662
0.864
0.812
1.33
1.52
'f,
rror
-1.85
-3-30
+4.26
+4.62
-2.73
- 3·07
-2.92
+8.41
-f9.<X2
+4.83
~
(org.)
0.599
0.76o
0.726
1.33
1.10
o.aoa
0.536
0.918
o.8<)o0.900
'fo
rror
+1.18
-1.94
-6.8o
-+6.40
-8.33
- 3.35
+0.94
+4.79
-+6.84
-+6.25
0.4r
~
0 . 3 r
~ ~
..
o.~-~
z
~ 0.4c.,,_
-u
ii:
l!i
0.3
~================================:::!
3
t
mT~
~
0.5
---oor---'=nL._ _ _
___:~::::J~0.46:
....
mT~85.()
.... o.6
____
_
~ ~~---0
0
..J
0
.
~ :==============================~
~
0
0.7
....
0.6
0
:
.
::6
~
S
_
-
_
~
-,-~
-
~
.
1~--
--
,-~
-
~--~--~~--~~
__
ml0/1
0 0.1 0.2 0.3 0.4 0.5 0.6 0.7 0.8 0.9 1.0
DYSPROSIUM NITRATE COMPOSITION ,
x
0. y
[image:31.563.71.493.114.631.2]0.2
0.4
0.5
mT •13.0
0
0
.
1 0.2 0.3 0
.
4 0
.
5 0.6 0
.
7 0.8 0
.
9
1.0
ERBIUM NITRATE COMPOSITION , XEr
Figure 2. Total distribution coefficient for erbium nitrate-nitric acid mixtures as a function
~ the ccmpoaition and coocentration
ot
[image:32.550.109.437.103.606.2]cf
1.5
z
J: ~..
....
z
LLJ -0-
"-"-
LLJ0
0z
0
....
1.0
::::>
m
-a::
....
C/) -0 0~
0-a::
t::
z
0.50
0.1
0.2 0.3 0.4 0.5 0.6 0.7 0.8 0.9 1.0
RARE-EARTH NITRATE COMPOSITION, XRE
[image:33.560.76.498.127.634.2]rt)
0
z
J: ~t-z
w
-(.)iL
~ L&J0
(.)I.
5
,---,---,.---r----y---,--.--~-r---.----,mT
=
4.0
z
0
1.0
~
:>
m
a:
t-C/) 0 0 -(.)ex
(.)a:
t-z
0·5
0
0.1
0.2 0.3 0.4 0.5 0.6 0.7 0.8 0.9 1.0
[image:34.554.60.482.179.589.2]RARE- EARTH NITRATE COMPOSITION, XRE
Figure
4.
Nitric acid distribution coefficient· for dysprosium nitrate-nitric acid and erbium nitrate-nitrate-nitric acid mixtures as a function of the composition of the aqueous phase atm.r
(aq. ) equal to 4.0,
0
z
1.0
J: ~..
....
z
L&J0
L&:
LL LaJ0
(.)z
0
t=
;:) o~75m
-a::
....
(/) -0 0 -(.) eX (.)a:
...
z
0.50
0.1
0.2 0.3 0.4 0.5 0.6 0.7
1.0
[image:35.563.87.503.131.610.2]RARE- EARTH NITRATE COMPOSITION , XRE
Figure
5.
Nitric acid distribution coe:tf'icient f'or ~sprosium nitrate-nitric acid and erbium nitrate-nitrate-nitric acid mixtures as af'unctioo.
atthe
ca~~positioo.at
the aqueous phase at
lD.r
{aq.)
rt)
0.9
0
z
% ~..
~z
LLI
-~ LL LLLLI
0
0z
0
i=
::::>
m
-a:
t-~ 0 0-~
0
-~
z
0.8
0.7
0.6
0.5
0 ·4 0 0.1 0.2 0.3 0.4 0.5 0.6 0.7 0.8 0.9 1.0
[image:36.553.58.481.178.594.2]RARE- EARTH NITRATE COMPOSITION , XRE
Figure
6.
Nitric acid distribution coefficient for dysprosiumnitrate-nitric acid and erbium nitrate-nitrate-nitric acid mixtures as a
:t'unction of the caupoeitioo. of the aquews phase at
Ulrr
(aq.)Figure
7.
Nitric acid distribution coefficient for dysprosium nitrate-nitric acid and erbium nitrate-nitrate-nitric acid mixtures as a function of the composition of the aqueous phase at mT ( aq.} equal to 10.0~
0
z
~r.
0.8
..
~
z
LtJ
u
m
=
10.0
i:L
0.7
T
~
LtJ 0
0
z
0.6
Q
~:::>
al-a:
~0.5
U) -0 0 -0 ct ~a::
~-z
Er(N~
3
0·3
o
0.1
0.2 0.3 0.4 0.5
0.6 0.7 0.8 0.9
1.0
0.9
0
.
8
~
~
mT =13
.
0
:J: ~
.. 0
.
7
.,_
z
LLJ -~ LL. LL. LLJ0
.
6
0 (.)
z
0
-.,_
=>
0.5
m
-a:
.,_
tn
-0
0
0
.
4
0
~
0.1
0.
2
0.3 0.4 0.5 0.6 0.7 0.8 0.9
RARE- EARTH NITRATE COMPOSITION, XRE
[image:38.559.54.533.71.668.2]1.0
Figure
8.
Nitric acid distribution ooefficient for dysprosium nitrate-nitric acid and erbium ni trate-ni tri c acid mixtures as a function of the composition of the aqueous phase mT (aq.) equal to 13.0'-'
•
,
0
z
:r
~-
1-z
L&J_-
(.)ii:
u.
LaJ0
(.)z
0
-
1-:::>
m
-a:
1-en
B
0 -(.) <( (.)-a:
t-z
0.8
mT
=
15.0
Er (N03 )3
0.7
0.6
0.5
0.4
0.3
[image:39.563.83.507.56.615.2]0 ·2 0 0.1 0.2 0.3 0.4 0.5 0.6 0.7 Q8 0.9 1.0
RARE- EARTH NITRATE COMPOSITION, XRE
Figure
9.
Nitric acid distribution coefficient for dysprosium
nitrate-nitric acid
anderbium nitrate-nitric acid mixtures as a
t'unction of the ca:apoaition
ofthe aqueous pbase at
111,_r(aq. )
4
r---r---~----,ci
0:
3
0
-
....
E
L&J en <t :I: Q. (.)z 2
<t C) 0: 0 lL 0
~
..J <t ..J 0 ~ ...J~
0....
0
~---~---~--~0
5.0
10
.
0
TOTAL MOLALITY OF AQUEOUS PHASE, mT(aq.)
Figure 10. Equilibrium distribution curves for pure nitric acid, pure dyaproail.D nitrate, and pure erbium nitrate
[image:40.557.98.423.60.607.2]1.3
,---.---..---r---.---r---...---,a
>.
0
1.2
I
~ LIJ CQ.
~
1.1
0
r-0
~
u:
1.0
z
0
fi
0::
0.9
~
LIJ
en
0.8
4.0
5.0
6.0
7.0
8.0
9.0
10.0
11.0
12.0
13.0
TOTAL MOLALITY OF AQUEOUS PHASE , mT( aq.)
Figure ll. Separatioo factor between erbium nitrate and ~aproa~ium. nitrate for the ~aproeium.
nitrate-erbium. nitrate-nitric acid-TBP-vater system as a tunctioo at the total
coocentration at the aquea.uJ phase
I'V
[image:41.557.125.679.103.437.2]DISCUBSICif ~ RB8ULTS
Equilibrium Data
'lbe equilibrium data presented in Tables 1, 2, and
3
were obtainedfran a total
at
seventy-eight aingl.e stage extractions Dade with theczysproeium nitric acid-TBP-water system, the erbium
nitric acid-TBP-water system, and the czyaprosium erbium
nitrate-nitric acid-TBP-water system. For each
ot
these extractiooa thedis-tribution data -were achieved by making a triplicate analysis to
de-termine the concentration
ot
each solute in both phases.In
thismanner the precision for all analyses was checked, and since the total
feed
ot
solutes to each single stage extraction was known, it waspos-sible to check the accuracy of the distribution data tor each extraction
by making material balances over both phases for each solute present.
Material balances tor the rare-earth nitrates present usually gave less
than two per cent error. 1he material balances :fb r the ni trtc acid present usually gave less than four per cent error. 'lbe greater error
in the nitric acid material balances was due to the analysis for nitric
acid which was not quite as precise nor accurate as the rare-earth
determinatioo. By checking the distribution data fran all extraction•.~
it was possible to discard the data fran any extractions vhich gave
A distributioo coe:t:ticient ia defined aa the concentratioo at a
solute in the organic phase divided by the coocentratioo at the same
solute in the aqueous phase. It follows that the total distributioo
coef:ticient would be the total concentratioo o:t the organic phase
divided by the total concentratioo
at
the aqueous phase.Tbe relationships
o:t
total distributioo coe:tficient versusrare-earth nitrate caupositioo shown in Figure 1 and Figure 2 were obtained
by linearly interpolating between equilibrium data o:t approximately
the same ccmpoeition, ~' and concentratioo,
m.r
(aq. ). A hypotheticalexample o:t this linear interpolatioo between equilibrium data :tor two
extractioos is given below.
Elctractioo 1 Interpolated values Elctractioo 2
2.8o
0.09
0.65
0.35
3.00
0.10
0.66
0.40
3.20
0.11
0.67
0.45
Using this method of interpolation. it was possible to obtain curves
having as a parameter the total molality
ot
the aqueous phase.Cor-relatioos
o:t
this type enabled the total distributioo coefficient tobe predicted for mixtures of rare-earth nitrates and nitric acid, if
the concentratioos o:t solutes in the aqueous phase were known.
As
the rare-earth nitrate compositions approach zero in Figure 1ot
pure nitric acid at the same total molalityat
the aqueous phase.This nitric acid distribution coefficient was calculated from the pure
nitric acid distribution curve shown in Figure 10. In a similar
DBnner, as the rare-earth nitrate ccmpoeitiooa approach one, the total
distribution coefficient becomes that
ot
the pure rare-earth nitrate.The
distribution coefficientstor
pure dysprosium nitrate and erbiumnitrate at any total molality of the aqueous phase were also calculated
by use
ot
Figure 10.The relationships of nitric acid distribution coefficient versus
rare-earth nitrate composition as shown in Figure
3
through Figure9
were obtained in an identical manner to that deacribed above
tor
Figure 1 and Figure 2. 'lllese correlations were used to predict the
nitric acid distribution coefficient in mixtures
ot
rare-earth nitratesand nitric acid, when the coocentrations
ot
all solutes in the aqueousphase were
known.
'llle separation factor between two solutes is the distribution
co-efficient of one solute divided by the distribution coefficient
ot
theother solute. It was found by Schoenherr ( 8) that the separation factor
for neocymium with respect to sanarium, call.ed the metal separation
factor, for the neodymium nitrate-samarium nitrate-nitric acid-TBP-water
system was prillarily independent
ot
ccmposition and seemed to dependooly on the total molality. 'Ibis wwl.d indicate that a straight line
relation woul.d be obtained by plotting the metal sepe.ratioo factor
versus total molality of the aqueous phase. A plot
ot
this type isacid-TBP-water system. Alth<Ngh there
wu
a good dealot
scatter present,justification for
drawina
a straight line through these points seemedreasonable due to the tact that metal separation factors taken frcm
Figure 11 gave satisfactory result& when used
tor
predicting equilibria.It should also be noted that the scatter has been somewhat magnitied due
to the •enlargement
ot
the ordinate scale.Prediction
ot
EquilibriaAlthough the equilibrium data obtained for the dysprosium nitrate,
nitric acid distribution and the erbium nitrate, nitric acid distribution
could have been correlated in such a manner as to be able to predict the
equilibria that would be attained when a certain aqueous feed solution
containing dysprosium nitrate, erbium nitrate, and nitric acid was
brought in contact with a solute tree amount of 'l'.BP, it was thougbt that
a more useful form of predicting equilibria would be one which enabled
the ccmposition of an organic phase to be predicted which would be in
equilibrium with an aqueous phase of known caa.position. 'lbe prediction
method, which is described here, seemed more appropriate in this form
since it would facilitate the making of stagewise calculations in solvent
extraction theory.
Suppose that an aqueous phase was given containing the solutes
dysprosium nitrate, erbium nitrate and nitric acid, and it was known
that this aqueous phase was in equilibrium with an organic phase
of each solute in the aqueous phase was known, but solute concentrations
in the organic phase were unknown.
The first step in predicting equilibria would be to determine the
total distribution coefficient,
K._r·
Assuming that all rare-earthnitrates present in the aqueous phase were dysprosium nitrate, a total
distribution coefficient would be calculated from Figure 1 by a linear
interpolation between curves
ot
constant aqueous phase molality. Thenassuming that all rare-earth nitrates present in the aqueous were
erbium nitrate1a second total distribution coefficient would be
calcu-lated from Figure 2 in a similar nanner. '!be actual total distributioo
coefficient for the mixture would then be calculated by a linear
interpolation between the above two coefficients according to the
fraction
(Xn,y
and ~) of each rare-earth nitrate present. Knowingthe total distribution coefficient, it would be possible to calculate
the total molality of the organic phase from the following equation:
m.r<
org. )=
K._r
x m.r(aq. ) •(1)
The nitric acid distribut~on coefficient would be found in the
following manner. Assuming that all rare-earth nitrates present vere
dysprosium nitrate, a nitric acid distribution coefficient would be
calculated using the correlations shown in Figure
3
through Figure9
bylinearly interpolating between appropriate curves at constant aqueous
phase molalities. Next assuming that all rare-earth nitrates present
vere erbium nitrate, the same procedure would be used to get a second
distribu-tion coefficient f'or the mixture would then be calculated by a linear
interpolation between these two coefficient• according to the fraction
(~ and ~) of' each rare-earth nitrate present. U•ing the nitric
acid distribution coef'f'icient,the molality at nitric acid in the organic
phase would be found f'rcm the following equation:
~o... (org.) •
11mo
x ~o (aq.) •'
3
3
(2)
'lbe separation factor between erbium and dysproaium was obtained
f'r001. Figure 11 at the known total molality of' the aqueOWI phase. Using
the equation which defines a separation factor, a relation was d.eri ved
for the renaining two unknowns, lllz>y(org.) and ~(org. ).
_
~
=
~(org.)
.:.~(org.)
'!hat is:
~Er-Dy
=
l1>:r
~
(aq. ) •~
(aq. ) jand by rearranging
~(org.) ~(aq.) u;,y(org.) •
~E:r-Dy
x~(aq.J
(3)
(4)
A second expression relating the two ren:aining unlmowns was the
equation tor total molality of' the organic phase. That is:
ID,_r(org.)
=
n;mO,
(org.) + lllz>y(org.) + ~(org. ). (5)Since all values in Equation
4
and Equation5
would be known exceptthe molalities of' erbium nitrate and dysprosium nitrate in the organic
phase, it would be possible to solve these two equations simultaneously,
thereby completing the prediction for the concentration of' all solutes
A Bl&q)le calculation ia now shown to il.l.uatrate the equilibrium
prediction method deacribed abon. Nu.rical val.u.ea
tor
thia Hq>lecalculatioo.
were
takentrca
the equilibri'la datatar
extractioo. number 1in '!able
3.
Suppoae an aqueoua phase wu known 'Which had the following coo-centratioo.a
ot
aollltea :DDo,
-
1.
87
JaOl.&l ;'
~
-
-
1.94
1.48
•
•
;Frca this data ~' ~' and ~ wre then calculated. 'lbat 1a:
~
- 1 -~
- 1 -0.567 -
0.433 ;
~(aq.
> +
-..cafl.
>
~
• m.;r{aq. ) •Next the total diatributioo. coetticient waa tew1d uaing the method
described earlier in thia aectioo.. ~ result obtained
was
K.r
: I0.555 .
'Ibis vaJ.ue for
K.r
caapared very favorably with the valueot
0.553
ob-tained trca actual analyaia.
'Ibe total molality
ot
the organic pbasewas
calculated by~(org.) •
0.55
x
5.29;
~(org. ) • 2. ~
1:be actual value
tor
total molalityat
the aqueoua phase wu equal to2.92.
'!he nitric acid diatribution coefficient w.a tound uaing the method
described earlier in this section. 1:be reault obtained
waa
~a,
-
0.770 .
Tbe actual value
tor
the nitric acid distribution coefficientwas
eqwalto
0.755.
Tbe molalityot
nitric acid in the organic pbaaewaa
thencalculated by Equation 2 as
uwa,
{org.)u;mO,
{org.)• 0.770
X1.87
i- 1.44
Tbe actual value
tor
molalityot
nitric acid in the organic pbuewaa
equal to 1. 41.
Tbe separation tactor between erbium nitrate and dy•pro•ium nitrate
at a total molality
ot
the aquecua phase equal to5.29
was determinedfran Figure 11 as
~Er-Dy
=
0.872 •'nlis value was then substituted into Equation
4
to obtain~(org.) 1
48
~(org.)
• 0.872 xf.9i;
~{org.)
Al.ao, by substituting into Equation 5
tor
total molalityot
the organicphase:
~(org.) + ~(org.) • 2.
94
-
1.44 ;'(org.) + ~(org.) "" 1.50 (5a)
Equation
4a
and Equation 5a were then solved siDill.taneCA.Uily to obtain~(org.) • 0.901
and
~(org.}
=
0.599.'lbese values were very cl~e to the actual values
ot
~ (org. ) equal to 0.918 and ~(org.) equal to 0.592 obtained fran analysis.'lberetore, the concentration
ot
each solute in the organic phasewas predicted fran a knOW'ledge
ot
the canpositiooat
the aqueCA.UI phasethat was in equilibrium with this organic phase. '!be method
ot
pre-dieting equilibria used in this sample calculation ia a modification
ot
the method developed by Schoenherr (8) tor predicting the equilibria
ot
the neodymium nitrate-samarium nitrate-nitric acid-T.BP-water system.
\
COOCWSIONS
1. A modif'ication of' the method
ot
predicting equilibria developed bySchoenherr (8) for the samarium nitrate-neoeymium nitrate-nitric
acid-TBP-water system can be used f'or the dysprosium nitrate-erbium
nitrate-nitric acid-T.BP-water system. Because these rare earths
appear to be similar to all of' the other rare earths, except cerium
which can exist in aqueous solution in the tetravalent state, the
general method should be successful in predicting equilibria f'or
any ceri~ free rare-earth nitrate-nitric acid-T.BP-water system.
2. The separation f'actor between erbium nitrate and dysprosium nitrate
for the dysprosium nitrate-erbium nitrate-nitric acid-TBP-water
system was fou.ad to be independent of canposition and depends on
total nitrate concentration only.
3.
At low nitric acid concentrations, erbium nitrate is more extractablethan dysprosium nitrate, and at high nitric acid concentrations
dysp:::-osium nitrate is more extractable th&.l~ erbium nitrate. To
separa.te the two by solvent extraction it would be necessary to
keep the total molality of the aqueous phase well removed from a
value of 9.40, because at this point the separation factor is equal
to one.
4.
The total distributi~l coef'f'icients and the nitric acid distributioncoefficients for dysprosium nitrate-erbium nitrate-nitric acid
mixtures can be calculated using the equilibrium data obtained for
dysprosium nitrate-nitric acid and erbium nitrate-nitric acid
5.
The distribution of pure dysprosium nitrate andat
pure erbiumnitrate closely approximate that of pure nitric acid.
6.
The chelametric titration used to determine rare-earth nitrateconcentration is considerably faster than the gravimetric
rare-earth nitrate analysis, and also, both these methods of analysis
give about the same precision and accuracy.
BIBLIOORAPHY
1. Atwood, G. A. Cbelatioo
est
lanthanides in solvent extraction studies. lhpublished M. 8. '!he sis. .Ames, Iowa, Library, Iowa state lkl.iversity of Science and Technology. l959.2. Banka, C. V. and l01ngnt.n, D. W. SpectrophotaDetric d.etermi.natioo
of rare earth mixtures. Anal. <211m. Acta 15:356-363. 1956.
3.
Bochinski, J., Sau.tz, M., and Spedding, F. H. Separatiooest
individual rare earths by liquid-liquid extractioo trCJil !ll.ll.ti-ca.ponent monazite rare earth nitrates. United States Atomic Energy Callnission Report ISC 348 (Iowa State College.)
May,
1953.4. Fischer, W., Dietz, W., and Juberuan, 0. Ein neues Verfahren zur T:rennung der selten Erden. Die Naturwissenscbatten 25 :}48.
l9YT-5.
Fritz, J. S., Oliver, R. T., and Pietrzyk, D. J. OlelaDetric titratioos using an azoarsooic acid indicator. Anal. Chem.30
:l.l.ll-lll4. June, 1958.6. Knapp, L. L. Solvent extractioo equilibria for rare earth nitrate-tributyl phosphate systems. Unpublished M. S. '!he sis. Ames, Iowa, Library, Iowa State University
est
Science and Technology. 1956.7. ~pp&rd, D. F., Faris, J.P., Gray, P.R., andMI.son, G. W. studies of the solvent extractioo behavior of the transition elements. I. :rractioo.ation
est
the trivalent rare earths. J. Rlys. Chem. 57:294-301. 1953·8. Schoenherr, R. U. Predictioo of equilibria
tor
rare earth nitrate-nitric acid-tributyl phosphate systems. lkl.published Rl. D. 'lb.esis. Ames, Iowa, Library, Iowa state University of Science and Technology. 1959.9. Equilibrium stuey
est
the S&mi!Lrium nitrate-neoeymium nitrate-nitric acid-tributyl pha.phate-water system. Research Notebook No. 331 R00-2. (Manuscript) Ames, Iowa, Institute for Atomic Research Document Library. 1958.10. Weaver, B., Kappel.uann, F. A., and Topp, A. C. Quantity separation of rare earths by liquid-liquid extractioo. I. '!be first