promoting access to White Rose research papers
White Rose Research Online [email protected]
Universities of Leeds, Sheffield and York
http://eprints.whiterose.ac.uk/
This is an author produced version of a paper published in Journal of Computer-Aided Molecular Design.
White Rose Research Online URL for this paper: http://eprints.whiterose.ac.uk/78613
Published paper
Cottrell, S.J., Gillet, V.J., Taylor, R. and Wilton, D.J. (2004) Generation of multiple pharmacophore hypotheses using multiobjective optimisation
Generation of Multiple Pharmacophore Hypotheses Using
Multiobjective Optimisation Techniques
Simon J. Cottrell1, Valerie J. Gillet1∗, Robin Taylor2, David J. Wilton1 1
Department of Information Studies, University of Sheffield, Regent Court, 211 Portobello
Street, Sheffield S1 4DP, UK.
2
Cambridge Crystallographic Data Centre, 12 Union Road, Cambridge, CB2 1EZ, UK
Keywords: pharmacophore identification, molecular overlay, alignment, evolutionary
algorithms, MOGA, multiobjective optimisation, multiobjective genetic algorithm,
conformational analysis
Summary
Pharmacophore methods provide a way of establishing a structure-activity relationship for a
series of known active ligands. Often, there are several plausible hypotheses that could
explain the same set of ligands and, in such cases, it is important that the chemist is presented
with alternatives that can be tested with different synthetic compounds. Existing
pharmacophore methods involve either generating an ensemble of conformers and
considering each conformer of each ligand in turn or exploring conformational space
on-the-fly. The ensemble methods tend to produce a large number of hypotheses and require
considerable effort to analyse the results, whereas methods that vary conformation on-the-fly
typically generate a single solution that represents one possible hypothesis, even though
several might exist. We describe a new method for generating multiple pharmacophore
hypotheses with full conformational flexibility being explored on-the-fly. The method is
based on multiobjective evolutionary algorithm techniques and is designed to search for an
ensemble of diverse yet plausible overlays which can then be presented to the chemist for
further investigation.
Introduction
A pharmacophore is the three-dimensional arrangement of functional groups required for
activity. Pharmacophore methods are generally used in an attempt to establish a
structure-activity relationship for a series of known active ligands in the absence of the
three-dimensional structure of the target protein binding site. Thus, a pharmacophore hypothesis
can be used to infer the characteristics of the binding site. Given a set of active molecules,
pharmacophore methods involve analysing the molecules to identify pharmacophoric features
(atoms or functional groups that can potentially interact with atoms in the binding site) and
then aligning the active conformations of the molecules such that their corresponding
pharmacophoric features are overlaid. A recent review on alignment methods is provided by
Lemmen and Lengauer [1] and reviews on pharmacophore methods can be found in
references [2-4].
There are two major issues to consider when generating pharmacophore hypotheses. First,
most molecules can adopt more than one low-energy conformation and in many cases the
number of accessible structures is very large. Thus, it can be very difficult to identify the
active conformations of the molecules. Second, there can be several different pharmacophoric
features within each molecule so that there can be many different ways of combining groups
from different molecules. In general, the aim is to identify the pharmacophore(s) with the
maximum number of pharmacophoric features, which must be presented by each molecule in
a low-energy conformation.
Often, there are several plausible hypotheses that could explain the same set of molecules. In
distinguish between them. For example, it is frequently impossible to optimise the fit of the
pharmacophoric features in each molecule to the pharmacophore points while at the same
time minimising the conformational energy of each molecule. Thus, there can be different
alternative compromise hypotheses. Even when considering fixed conformations, there may
be different ways of aligning the molecules that are equally plausible. In such cases, it is
important that the chemist is presented with alternative overlays that can be subsequently
tested using different synthetic compounds.
When overlaying flexible molecules, it is necessary to perform conformational analysis,
given that the active conformations are unknown a priori. There are two main approaches to
this. One is to generate an ensemble of conformers and to consider each conformer of each
ligand in turn for the alignment. This is the approach used in the commercially available
programs Catalyst/HipHop [5, 6] and DISCO [7]. Ensemble methods tend to produce a large
number of hypotheses and require considerable effort to analyse the results [8]. Furthermore,
the results are dependent on the extent to which conformational space is sampled and on the
structure generation method used.
An alternative approach is to explore conformational space on-the-fly, that is, at the same
time as the alignment. This is the approach taken in GASP [9] which is based on a genetic
algorithm that aims to optimise conformation simultaneously with the goodness of the
alignment. Methods that vary conformation on-the-fly typically generate a single solution that
represents one possible hypothesis, even though several might exist. For example, GASP
attempts to find an optimum alignment that is based on a fitness function comprising three
different objectives. These are: a similarity score, known as the feature score, which is based
on the number of features in the pharmacophore and the goodness of the overlay, i.e. the
individual conformers; and the volume integral of the overlay. The objectives are combined
into a single function using a weighted-sum fitness function and the aim is to find the solution
that maximises the function.
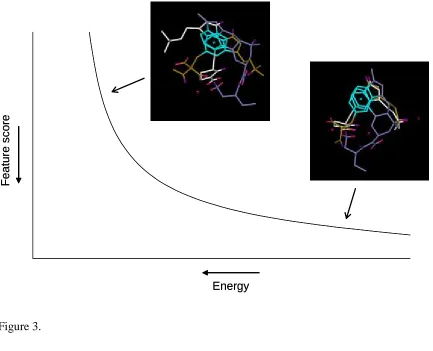
A difficulty with this approach is that the objectives are typically in competition. For
example, Figure 1 illustrates two different (not particularly good) overlays of the three
5-HT1D agonists shown in Figure 2. The solution on the left has a relatively high feature score
but this is achieved by distorting the geometries of the molecules away from their minimum
energy conformations. The solution on the right is more favourable in terms of energy but has
a poorer feature score. In the absence of further information both solutions are equally
plausible: they simply represent different compromises in the objectives. Thus a trade-off
surface exists as illustrated schematically in Figure 3. The trade-off in two objectives only is
shown, namely the feature score and energy, and the axes are arranged such that the best
value for each objective is towards the origin. The two examples described occupy different
relative positions on the trade-off surface with the surface itself representing all possible
trade-off solutions. The trade-off surface is also known as the Pareto surface [10]. Combining
the different objectives into a single weighted-sum fitness function effectively defines their
relative importance and hence determines which particular compromise solution is found.
The default weights assigned in GASP have been chosen empirically based on a small
number of datasets and it is highly unlikely that they are optimal for all datasets. The
appropriate set of weights for overlaying any given set of molecules is therefore unknown a
priori.
In order to explore a range of possible hypotheses, GASP can be run a number of times and
the best result from each run evaluated. However, the experiments reported later show that
are typically suboptimal in terms of the fitness function (i.e., the GA has not converged).
More importantly, the solutions are usually not distinct from one another in terms of the
pharmacophores they represent.
Here, we describe a new method for generating multiple pharmacophore hypotheses with full
conformational flexibility being explored on-the-fly. The method is based on multiobjective
evolutionary algorithm (MOEA) techniques and Pareto ranking [10] and aims to generate a
manageable number of different, yet plausible, hypotheses. Multiple solutions are explored in
a single run, thus allowing cooperation between the solutions that are generated. The
algorithm is designed to ensure that a diverse family of solutions is found.
To our knowledge, the first use of Pareto ranking in chemoinformatics is the work of
Handschuh et al. [11] who used Pareto optimisation in their GA for the flexible superposition
of 3D structures. Their method finds a set of common substructures between two molecules,
based on two criteria: the number of atoms in the substructure and the fit of the matching
atoms. These are conflicting criteria since a substructure which is a superstructure of a
smaller substructure will tend to have a larger deviation in the coordinates of the
superimposed atoms. Rather than attempting to combine the different criteria into a single
weighted-sum fitness function, a set of Pareto-optimal solutions is obtained whereby an
optimal geometric fit is found for each possible size of common substructure. While this
approach is clearly related to the work described here, there are significant differences in the
way in which the Pareto-optimal sets are identified. In the work of Handschuh et al., a finite
set of solutions exists, with one solution for each size of common substructure. In our work,
the continuous nature of the objectives being optimised (conformational energy, the volume
score and the feature score) means that an infinite number of solutions exists and, as will be
Since the work of Handschuh et al., Pareto ranking has been successfully applied to
combinatorial library design [12, 13] where there is a requirement for libraries to be optimal
over a number of conflicting properties; for example, they should be simultaneously diverse,
cheap to synthesis and comprise of compounds with drug-like properties. It has also been
applied to the derivation of quantitative structure-activity relationships [14] where model
accuracy often conflicts with model complexity. More recently, Pareto ranking has been used
for the evolution of median molecules [15].
Method
In a multiobjective evolutionary algorithm, the objectives to be optimised are treated
independently. The concept of Pareto dominance is used to evolve a family of trade-off
solutions in a single execution of the algorithm. In Pareto dominance, one solution dominates
another if it is equal or better in all objectives, and strictly, it is better in at least one objective.
A solution is classified as non-dominated or Pareto optimal, if no solution exists in the
current population that dominates it. Thus, there are no solutions that are superior to a
dominated solution, although there may be other equally good solutions. The set of all
non-dominated solutions is known as the Pareto optimal set and the corresponding objective
vectors are described as the Pareto front or the off surface. The globally optimal
trade-off surface of a multiobjective problem can contain a potentially infinite number of Pareto
optimal solutions, and the task is usually to provide an accurate and useful representation of
the trade-off surface. Thus, the solutions should have objectives values that are close to the
true Pareto front; there should be good diversity in the solutions; and the solutions should be
limited to pertinent regions of the search space (for example, pharmacophore solutions that
In this paper, we are concerned with exploring the benefits to be gained from the use of a true
multiobjective optimisation method for pharmacophore identification over the more
traditional GA. The main difference between a MOEA and a traditional evolutionary
algorithm, such as a GA, is the way in which the fitness of an individual within the
population is calculated. Thus, while many of the features of our algorithm are based on
methods developed for GASP, there are significant differences in the way in which the
objectives are handled. This is necessary to ensure that a family of equivalent solutions is
found and considerable effort has been directed towards ensuring that the solutions found
consist of diverse and relevant pharmacophore hypotheses.
The input, as with GASP, is the set of molecules to be overlaid, usually presented as
energy-minimised conformers. The pharmacophoric features within each molecule are identified and
virtual points created from them. Specifically, a virtual point is created at the centre of each
aromatic ring and at 2.9Å from the heavy atom attached to each hydrogen-bond donor proton
and each acceptor lone pair (to represent acceptor and donor atoms in the binding site,
respectively). The molecule that contains the fewest features is then chosen as the base
molecule onto which the other molecules are overlaid. As in GASP, the chromosome
structure encodes the conformation of each molecule together with a mapping onto the base
molecule of each molecule other than the base molecule itself. A molecular overlay
consisting of N molecules therefore comprises 2N-1 strings: N strings to encode the
conformational information and N-1 strings to encode the mappings.
The first step of the fitness evaluation is to generate the alignment encoded in a chromosome.
A conformation for each of the molecules is generated by applying the rotations encoded in
the chromosome. Each molecule is then aligned to the base molecule according to the
least-squares distance between all the virtual points in the base molecule and the corresponding
virtual points in the other molecules, as encoded in the mapping.
Once an alignment has been generated, the energy, volume integral and feature scores are
calculated as in GASP [9]. The energy score is the mean internal van der Waals energy of the
molecules. The volume integral score is the sum of the volume overlap integrals between the
base molecule and each of the remaining molecules. The feature score is summed over all
pharmacophore points. Two centroids are calculated for each mapping specified in the
chromosomes; one for the virtual points and one for the corresponding heavy atoms. Distance
thresholds are applied to determine if the mapping represents a valid pharmacophore point. If
the mapping is valid, a contribution to the feature score is calculated based on the RMSD
between the virtual points and their corresponding centroid and between the heavy atoms and
their corresponding threshold.
Now, instead of summing the objective values into a single fitness value, as in GASP, the
population is ranked using Pareto ranking as described by Fonseca and Fleming [10] in their
Multiobjective Genetic Algorithm (MOGA). In MOGA, the rank of an individual is the
number of individuals in the current population by which it is dominated. Thus,
non-dominated individuals are assigned the rank 0, an individual that is non-dominated by one other
individual is given rank 1, and so on. The rank value of an individual is then mapped to its
fitness value. The subsequent roulette-wheel parent selection method then biases selection
towards individuals with lower fitness values. By ensuring that all individuals at the same
fitness have equal chance of being selected, the MOGA evolves the population towards the
globally optimal Pareto surface. At the end of the run, the set of non-dominated solutions
represents the Pareto surface and, ideally, all would be global optimal solutions with each one
Generating a Diverse Subset of Solutions
MOEAs have a tendency to converge to a restricted region of the Pareto surface so that not
all of the search space is explored (“genetic drift”). This effect can be countered by
implementing niching techniques that attempt to preserve the diversity of non-dominated
solutions. Diversity can be a function of the objective values (objective-space niching) or the
decision variables (decision-space niching). Objective-space niching is used to prevent the
co-occurrence of solutions that differ only slightly in their objective values and can be used to
ensure that solutions are evenly spread across the Pareto surface. Thus, objective-space
niching could be used to ensure that the two 5-HT1D agonist hypotheses identified earlier,
which occupy distant points on the surface, are found (Figure 3). Initial attempts at preserving
diversity were based on objective-space niching and were implemented using a sharing
method [16] where the fitness values of individuals that lie within a given distance of one
another (niche radius) are reduced in order to encourage the population to diverge from the
niche. The sharing method involves modifying the fitness of each solution by an amount that
is proportional to the number and distance of other solutions that lie within the niche radius.
Distance was measured using Euclidean distance in objective space and the niche radius was
defined independently for each objective, as shown in Table 1.
Initial results showed that while this method of niching was successful in spreading the
solutions across the Pareto surface, it did not consistently result in the generation of
chemically distinct overlays. Further investigation indicated that the lack of effectiveness was
due to the weak correspondence between distance in objective space and distance in decision
space. The two hypotheses illustrated in Figure 3 are distant in both objective and decision
space, i.e. have different objective values and are chemically very different overlays.
However, it is quite possible that solutions representing different overlays happen to have
small change in energy but may lead to a different atom in one molecule being matched to a
given pharmacophoric feature in the base molecule. This would result in little change in the
objective values, yet the solution represents a chemically different overlay. Conversely, it is
also possible for solutions that represent similar overlays to be widely separated in objective
space. For example, a small change in conformation may lead to a large change in energy
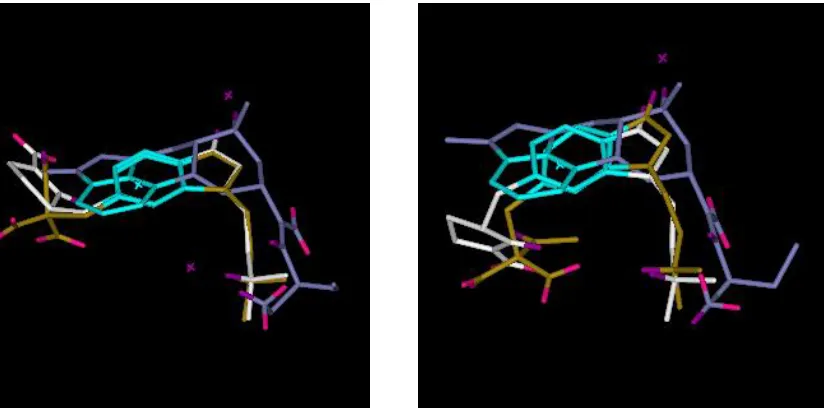
without any significant change to the overlay. Figures 4 and 5 illustrate examples of both
scenarios for the 5-HT1D agonists.
The niching strategy was therefore modified to take account of decision-, or
pharmacophore-space, in order to identify a subset of solutions that represent distinct, yet reasonable,
hypotheses. In this method, the population is clustered into groups of similar pharmacophores
prior to performing objective-space niching. A leader clustering method is used in which the
first pharmacophore encountered defines a cluster. If the next pharmacophore represents a
mapping that is distinct from the first it is assigned to a new cluster, otherwise it is assigned
to the same cluster as the first. Two pharmacophores represent distinct mappings when either
of the following occurs:
• Different sets of base molecule features are mapped.
• The same set of base molecule features are mapped, but at least one feature maps to a
different feature in at least one molecule.
The definition of a cluster is extended to include pharmacophores that are subsets of other
pharmacophores, i.e., that consist of a subset of the points contained in the other. In this case,
the smaller pharmacophore is assigned to the same cluster as its parent. An individual may be
a subset of more than one parent pharmacophore, in which case, its membership is shared
The fitness values of individuals are then modified from their initial values (which
correspond to their Pareto ranks) to differentiate solutions of the same Pareto rank according
to cluster density. Thus, the probability of selecting an individual is adjusted by an amount
that is inversely proportional to the density of the cluster to which it belongs. For example,
the fitness of a non-dominated solution that belongs to a cluster containing four solutions is
adjusted so that there is half the probability of it being selected compared to a non-dominated
solution that belongs to a cluster containing two solutions. The probability of selecting a
solution with a low rank is still greater than the probability of selecting one at higher rank,
but within a given rank the probability of selecting a solution from a sparsely populated
cluster is greater than the probability of selecting one from a more dense cluster.
Finally, objective-space niching is applied to solutions within the same cluster, with the
fitness of an individual being further modified according to the number of individuals which
lie within its niche-radius and which belong to the same cluster. The overall probability of
selecting a solution from each cluster is unaffected. Restricting objective-space niching to
within a cluster means that solutions that are close on the Pareto surface are only penalised if
they represent the same mapping. Thus, the primary aim of the niching is to preserve
diversity in terms of the number of different pharmacophore mappings, or clusters, that exist
in the population, with the secondary aim being to ensure diverse coverage of the Pareto
surface within a cluster, as defined by the objectives.
A threshold value is placed on the energy objective to ensure that solutions are limited to
pertinent regions of the search space. In pharmacophore generation, highly strained
conformers are generally not of interest and the threshold (21000 kJ mol-1) is used to exclude
individuals that have energies that exceed this value. The energy threshold is set to a high
Thus, molecules do not have the ability to relieve short non-covalent contacts by minor
valence-angle distortions. No limits are placed on the feature or volume scores since it is
necessary to allow individuals with low values of these scores to exist in the population,
especially early in the search, and because these objectives have finite lower bounds.
Results and Discussion
Datasets
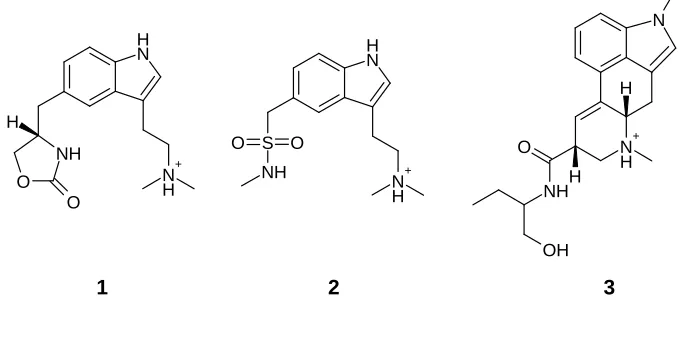
Results are presented for three datasets: the three 5-HT1D agonists, shown in Figure 2; a set of
four scytalone dehydratase inhibitors, Figure 9; and a set of three dopamine D2 antagonists
shown in Figure 13. For each dataset, the solutions found in a single run of the MOGA are
compared with those found by running GASP ten times. This approach allows a direct
comparison to be made between the multiobjective optimisation approach used in the MOGA
and the traditional weighted-sum approach used in GASP.
As discussed in the methodology, the MOGA solutions are clustered such that all solutions
within a cluster consist of the same pharmacophoric features, with the same mapping from
each molecule to the features. While solutions within a cluster will have different values of
the objectives (for example, the conformations of the molecules may be different and the
feature scores may vary, so that the solutions are separated on the Pareto surface) the basic
pharmacophore is the same. A representative solution from each cluster is shown in the
results and solutions with fewer than three pharmacophoric features have been omitted.
Where possible, a non-dominated solution is chosen as cluster representative, however,
dominated solutions are chosen to represent clusters which do not contain any non-dominated
solutions. The non-dominated solutions represent globally optimal solutions and are clearly
solutions of interest. However, the dominated solutions may also represent plausible
objectives. This is due to the fundamental limitation of pharmacophore methods whereby the
contribution of the receptor cannot be modelled and the objectives being optimised are based
on the ligands only.
MOGA and GASP Parameters
The search space explored by a MOGA is considerably larger than that explored by a
traditional GA, since it attempts to find multiple diverse solutions spanning the entire Pareto
surface. In contrast, a GA attempts to find a single solution only. Thus, a MOGA requires a
bigger population size to ensure adequate coverage of the search space. Unless otherwise
stated, the runs reported here used the parameters as specified in Table 1. The run times for
200000 iterations are approximately 2 hours on a Linux PC running at 2.8GHz. GASP was
run using the default weights and with parameters as shown in Table 1.
5-HT1D agonists.
The exact structure of the 5-HT1D receptor is not known; however, Glen et al. have produced
a 3D pharmacophore hypothesis using the active analogue approach [17]. Molecules 1–3 in
Figure 2 form part of the much larger dataset used in that study. As methysergide (3) is
relatively inflexible, it was used by Glen et al. as a scaffold to which more flexible molecules
could be fitted. A pharmacophore hypothesis was generated involving five features; in
methysergide, these are:
• the aromatic ring
• the protonated amine (as a donor)
• the amide oxygen (as an acceptor)
• the hydroxyl oxygen (as an acceptor)
The last two features are not essential: active molecules have been found that do not contain
them, such as 1 and 2, though their absence generally lowers affinity for the 5-HT1D receptor.
According to Glen et al.’s hypothesis, the aromatic rings and the protonated amine hydrogens
in 1, 2 and 3 are mapped to each other, and the amide oxygen of 3 is mapped to the carbonyl
oxygen of 1 and one of the sulphonamide oxygens of 2.
Five different, reasonably plausible ways of aligning the molecules are shown in Figure 6.
The alignments vary in the pharmacophoric features identified and the features in the
individual molecules that map to the pharmacophore. The variations arise from small changes
either in the relative position of one or more of the molecules or in the conformations of the
molecules. The hypothesis identified by Glen et al. corresponds to alignment 3 in Figure 6,
although in the figure it is the hydroxyl oxygen rather than the amide oxygen of 3 that is
mapped.
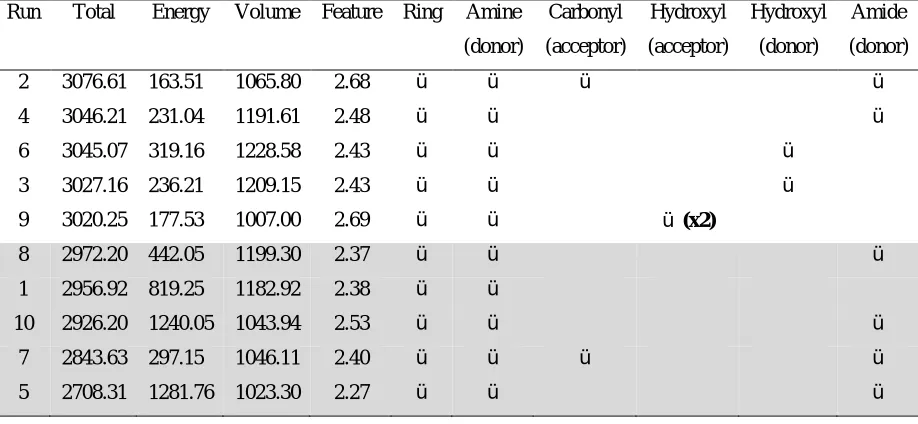
The results for the ten GASP runs are shown in Table 2, which indicates the features of
methysergide, 3, that are mapped to pharmacophoric points (the features of molecules 1 and 2
that map to the pharmacophore are not indicated). Energy is reported relative to the energy of
the input molecules. All solutions correspond to the general alignment 3 shown in Figure 6.
The fittest solution contains the three features identified as important by Glen et al., but it
also includes another feature generated from the overlay of the amide/sulphonamide
hydrogens. Furthermore, the conformation of 3 is considerably different to that reported by
Glen et al., with the distorted conformation allowing the additional pharmacophoric feature to
be identified. Therefore, the “best” GASP solution does not represent the pharmacophore
derived by Glen et al. In fact, there are no solutions from the ten runs that correspond exactly
Figure 7a shows the objective values of the ten GASP solutions as a parallel coordinates
graph. The objectives are plotted along the x-axis and the values of the objectives are plotted
along the y-axis, linearly scaled so that the best value achieved for each objective is at 0 and
the worst is at 1. Each solution is represented as a continuous line. The plot gives an
indication of the variation found when performing multiple runs of GASP. Crossing lines in
the plot indicate solutions that represent different compromises in the objectives whereas
lines that do not cross indicate the presence of dominated solutions. Thus, solutions 2 and 9
are both relatively good in terms of energy and features but they have relatively poor volume
overlays. Conversely, solutions 3, 4, 6 and 8 are good in terms of volume and energy but are
relatively poor in terms of their feature scores. Solution 5 is poor in all objectives. In a Pareto
sense, it is dominated by all the others except solution 9 (only solution 9 crosses it in the
graph), which may indicate that this run of GASP did not reach convergence. If all dominated
solutions are removed, only 5 of the 10 solutions remain, as shown in Figure 7b.
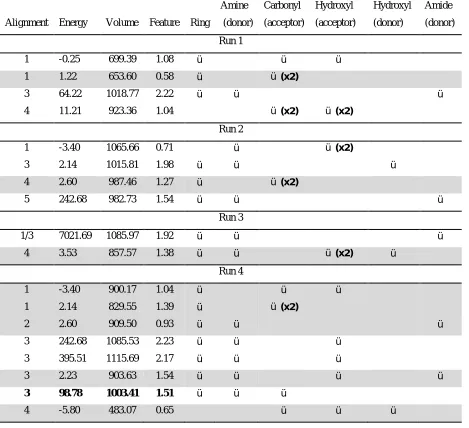
Table 3 shows the results for four runs of the MOGA. As for the GASP results, the
pharmacophoric features are indicated with reference to methysergide. In addition, the
solutions are labelled according to the alignment to which they are closest. Where a solution
cannot be clearly assigned to one of the five alignments in Figure 6, the alignments that it
shares characteristics with are indicated. Thus, it can be seen that each of the MOGA runs
generates solutions that correspond to several of the alignments of Figure 6 and, considering
all of the MOGA runs together, all five distinct alignments are found.
The solution shown in bold corresponds exactly to the pharmacophore suggested by Glen et
al. in terms of the pharmacophoric features identified and the inter-feature distances, which
fall within the range specified by those workers (Figure 8). However, the conformation of
values of this solution with those found by GASP shows that the GASP runs have a tendency
to promote the feature score over the other objectives, as seen by the relatively small range of
values for this score found over the multiple runs. The MOGA solution has a lower features
score than any of the GASP solutions and therefore it is unlikely that it would be found using
the default GASP weights.
The ability of the MOGA to map out the Pareto surface is shown by the greater range of
feature scores seen in the solutions found in a single run. The greater range of hypotheses
generated clearly demonstrates the advantages of using the MOGA over GASP. However,
there is a lack of consistency between MOGA runs. Increasing the population size to 2000
results in greater consistency in the ranges of the values of the objectives that are seen in each
run. However, considerable extra computational resource is required; these runs take around
11 hours to complete, compared to two to three hours per run with a population of 1000.
Scytalone dehydratase inhibitors.
The scytalone dehydratase inhibitors were extracted from enzyme-inhibitor complexes in the
Protein Data Bank (PDB) [18]. Therefore, the bound conformations of the inhibitors are
known. Since 4–6 have a large common substructure (consisting of the amide and the
aromatic ring to which the chlorine or bromine is attached), it seems likely that these
common features will form the same interactions with the enzyme. However, the interactions
of 7 are less obvious. The four aromatic rings of 7 have been labelled for reference purposes.
From inspection, overlays with each of the four rings mapped to the aromatic ring of 4 (the
base molecule) seem plausible; example overlays are shown in Figure 10. Comparison of the
crystal structures indicates that it is actually ring 3 of 7 that maps to the aromatic ring of 4.
the protein is such that it is not possible to align the complexes exactly and hence the
alignment generated is somewhat arbitrary.
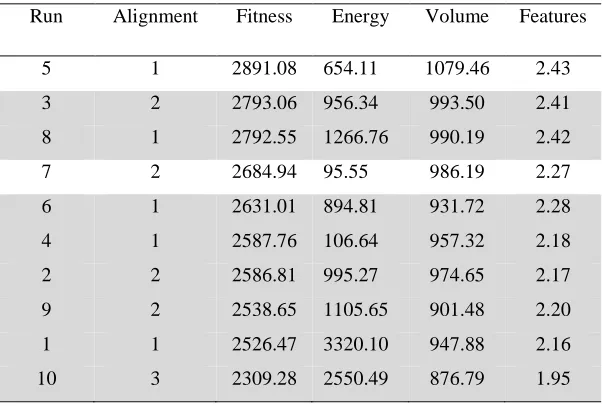
The GASP results are shown in Table 4 with the different alignments labelled according to
the ring of 7 that is mapped to the aromatic ring of 4. Three out of the four alignments are
generated. However, only one of the runs produces the correct alignment and this solution is
the one with lowest overall fitness score, i.e., at rank ten when the solutions are ranked on
fitness. This solution has a relatively low score and is dominated by all of the other solutions
except for solution nine, which is worse in energy. Thus, although this solution represents the
correct overlay, it occupies a local maximum in the search space and has been found as a
result of GASP’s failure to move towards the global maximum in this particular execution of
the program.
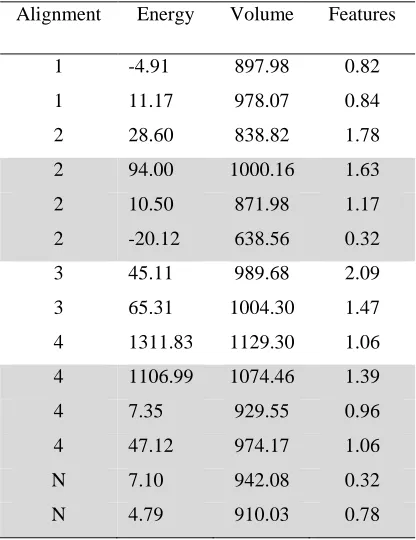
A run of the MOGA finds examples of all the overlays shown in Figure 10 (Table 5; the ring
of 7 that is mapped to the aromatic rings of the other molecules is indicated). As for the
5-HT1D dataset, considerable variation is seen over all of the objectives, indicating that the
Pareto surface has been explored to a reasonable degree. The negative energy scores are due
to the generation of conformations that are lower in energy than the starting conformations.
The MOGA finds two solutions with the correct alignment. One of these is better than the
GASP alignment in all objectives, i.e. this solution would dominate the “correct” GASP
solution. An additional feature is seen in this solution relative to the manually derived
solution, both lone-pairs of the carbonyl groups in 4-6 giving rise to acceptor points. The
other solution has poorer feature and energy scores but the overlay has an improved volume
integral. In both cases, the geometry of the pharmacophore fits the manually generated
cases the benzene ring of 7 is in a different position to that observed in the crystal structure.
These two solutions are shown in Figure 12.
A second run of the MOGA also produced examples of all four alignments, although some
variation was seen in the individual objective values. Increasing the population size to 2000
resulted in all of the alignments seen previously, together with an increased number of less
plausible solutions. Therefore, a population size of 1000 would appear to be adequate in this
case.
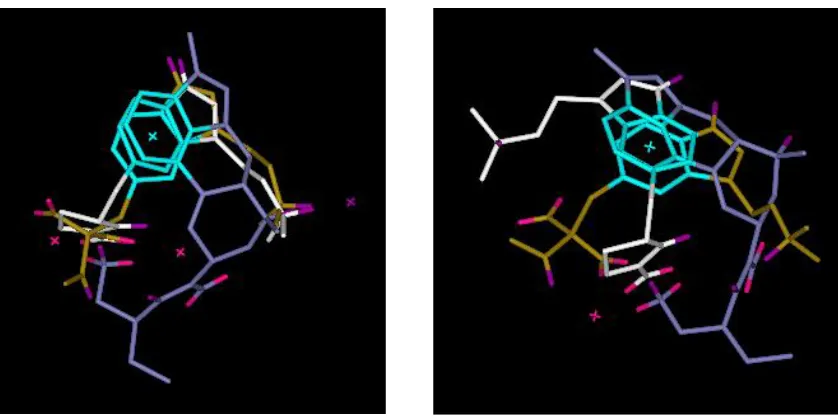
Dopamine D2 antagonists.
All three molecules in the dopamine dataset are very flexible and feature rich [19]. This
makes the dataset difficult for any pharmacophore generation method since there are many
different ways in which the molecules could reasonably be overlaid.
Although the dopamine D2 receptor has been studied in detail, we are unaware of a published
pharmacophore hypothesis for exactly the three molecules in our dataset. However, a
receptor-interaction model has been published by Liljefors and Bøgesø [20], and close
analogues of 8 and 10 were fitted to this model by Pettersson and Liljefors [21]. The essential
features of this model are the aromatic ring and the protonated amine.
The dopamine D4 receptor is very similar to the D2 receptor, and a pharmacophore model for
the D4 receptor has also been published [22]. The only difference from the D2 pharmacophore
is that the D4 model includes two receptor-essential volumes that are not part of the D2
model. Compound 9 has been fitted to the D4 model in a way that implies a mapping between
the fluorobenzene ring of 9 and the benzene rings of 8 and 10, and between the protonated
to its activity, but as there are no equivalent features in 8 and 10, this feature will not be
found by either method.
In the absence of knowledge of these studies, compound 9 could reasonably be aligned either
in the orientation described above, or it could be flipped completely such the fluorobenzene
ring is aligned towards the pyrrolidinium rings in 8 and 10. Even within each of these general
alignments, considerable variation is possible both in conformations and the relative positions
of the molecules. This leads to many different potential pharmacophores.
The results for the ten GASP runs are shown in Table 6. Six of the ten solutions represent
alignments where the fluorobenzene ring of 9 aligns to the benzene rings of 8 and 10,
indicated by a tick in the column headed RF. The other four solutions have 8 oriented in the
opposite direction (indicated by a tick in the column headed RCL). However, none of the
solutions corresponds exactly to the pharmacophore model described above. Comparing the
objective scores across the runs shows that four of the solutions represent non-dominated
solutions (solutions 1, 2 , 4 and 8 are non-dominated).
The solutions found in a single run of the MOGA are shown in Table 7 and also include
several examples of both alignments of 9. However, a greater range of values is seen in all
the objectives, with a significant number of solutions with lower energies than is found in the
GASP runs. Solutions with higher volume overlays are also seen. As for the previous
datasets, the MOGA shows a bias towards solutions with favourable energies and volume
scores relative to the feature scores. Figure 14 shown a diverse set of alignments as found by
the MOGA.
In this case, the large search space is such that it is unlikely that GASP will generate the same
cooperation between distinct runs, so the identification of diverse solutions is left to chance.
Furthermore, the generation of a wide range of diverse solutions with GASP is likely to
require repeated runs where the relative weights of the objectives are varied. With the
MOGA, multiple solutions are sought within the same exploration of the search space and the
search is explicitly directed towards a diverse set of solutions.
Conclusions
It is rarely possible to overlay unambiguously a set of molecules known to bind at the same
protein binding site. Usually, pharmacophoric features in the different molecules may be
matched in several ways, and, unless some of the molecules are rigid, the molecules may be
superimposed in various conformations. Thus, it is important that a range of different,
plausible overlays (i.e. structure-activity hypotheses) is identified and presented to the
chemist for browsing and visual inspection. It is then possible for the chemist to design
synthetic targets or pharmacophore searches that will test, and therefore confirm or eliminate,
the more likely-looking hypotheses. Pharmacophore generation programs like GASP aim to
produce a single hypothesis which optimises a reasonable, but essentially arbitrary, linear
combination of objective functions. Repeated runs of GASP may, in fact, produce different
overlays. When this occurs, however, it merely indicates that the search algorithm is
unreliable at finding the global optimum; it is not a satisfactory way of searching for a diverse
range of feasible overlays.
In contrast, the MOGA described above looks for a representative ensemble of overlays in a
concerted fashion. Our results show that a single run of the MOGA tends to find a wider
range of overlay hypotheses than repeated runs of GASP. In particular, the weighting scheme
in GASP clearly emphasises the feature-score term (goodness-of-fit to pharmacophore points)
this makes it difficult if not impossible for GASP to find the pharmacophore hypothesis
proposed in the literature. Even with the MOGA, however, we find that repeated runs will
sometimes find different solutions, especially when relatively small population sizes are used.
This is a reflection of the complexity of the search space and the small datasets we have used.
In particular, we must expect any search algorithm to be unstable when applied to the three
highly flexible and feature-rich dopamine antagonists 8-10. Even in this situation, however, it
is better for the chemist to be presented with a large and unbiased range of credible solutions
than a small arbitrary subset that is ultimately dependent on the particular weighting scheme
used in GASP.
The programs Catalyst and DISCO, described earlier, are both designed to generate multiple
pharmacophore hypotheses. However, a fundamental difference between these programs and
the MOGA (and also GASP) is that both Catalyst and DISCO require a precomputed set of
conformers for each of the ligands. They then use rigid body alignment techniques which are
applied to each conformer of each ligand in turn. As a consequence, the pharmacophores that
are generated by these methods are highly dependent on the structure generation method that
is used [23]. The MOGA allows a more complete exploration of conformational space and is
not limited to finding conformational minima. A further major strength of the MOGA is that
the steric overlay of the ligand is taken into account so that most of the alignments that are
generated seem sensible. Catalyst, on the other hand, does not taken account of steric overlap
and as a result a large number of the alignments can be generated that appear unlikely.
A difficulty in assessing the performance of any pharmacophore generation method is that the
correct answer is usually unknown. In previous work, we compared the performance of
GASP with Catalyst and DISCO in generating pharmacophores for sets of ligands whose
known [8]. This work highlighted a significant limitation of GASP that has not been
addressed here, which is that GASP requires every molecule to match every feature in the
pharmacophore. The same limitation applies to the MOGA. Current work is focussing on
relaxing this constraint so that we can apply the method to larger datasets. Efforts are also
underway to improve the stability of the MOGA so that less variation is seen from one run to
another.
Acknowledgements
We acknowledge funding from EPSRC and Cambridge Crystallographic Data Centre, and
References
1. Lemmen, C. and Lengauer T. J. Comput.-Aided Mol. Des., 14 (2000) 215.
2. Güner, O.F., (Ed.) Pharmacophore Perception, Development, and Use in Drug
Design. International University Line, La Jolla, CA, 2000.
3. Dror, O., Shulman-Peleg, A., Nussinov, R. and Wolfson, H. J. Current Medicinal
Chemistry, 11 (2004) 71.
4. van Drie, J.H. Current Pharmaceutical Design, 9 (2003) 1649.
5. Barnum, D., Greene, J., Smellie, A. and Sprague, P. J. Chem. Inf. Comput. Sci. 36
(1996) 563.
6. Smellie, A., Teig, S.L. and Towbin, P. J. Comp. Chem., 16 (1995) 171.
7. Martin, Y.C., Bures, M.G., Danaher, E.A., DeLazzer, J., Lico, I. And Pavlik, P.A. J.
Comput. Aided Mol. Design, 7, (1993) 83.
8. Patel, Y., Gillet, V.J., Bravi, G. and Leach, A.R. J. Comput.-Aided Mol. Des., 16
(2002) 653.
9. Jones, G., Willett, P. and Glen, R.C. J. Comput.-Aided Mol. Des., 9 (1995) 532
10. Fonseca, C.M. and Fleming, P.J. IEEE Transactions on Systems Man and Cybernetics
Part a-Systems and Humans, 28 (1998) 26.
11. Handschuh, S., Wagener, M. and Gasteiger, J. J. Chem. Inf. Comput. Sci. 38(1998)
12. Wright, T., Gillet,V. J.,.Green, D.V.S, and Pickett, S.D. J. Chem. Inf. Comput. Sci..
43(2003) 381.
13. Gillet, V.J., Khatib, W., Willett, P. Fleming, P.J., and Green, D.V.S. J. Chem. Inf.
Comput. Sci.. 42 (2002) 375.
14. Nicolotti, O., Gillet, V.J., Fleming, P.J., and Green, D.V.S. J. Med. Chem. 45 (2002)
5069.
15. Brown, N., McKay B., Gilardoni, F. and Gasteiger, J. J. Chem. Inf. Comput. Sci.. 44
(2004) 1079.
16. Goldberg, D.E. and Richardson J. In Grefenstette, J.J. (Ed.) Genetic Algorithms with
Sharing for Multimodal Function Optimisation, in Proceedings of the Second
International Conference on Genetic Algorithms, Lawrence Erlbaum Associates,
Hillsdale. 1987, pp. 41-49.
17. Glen, R.C., Hill, A.P., Martin, G.R. and Robertson, A.D. J. Med. Chem. 38(1995)
3566.
18. Wawrzak, Z., Tatyana, S., Steffens, J.J., Basarab, G.S., Lundqvist, T., Lindqvist, Y.
and Jordon, D.B. Proteins: Structure, Function and Genetics, 1999, 35 (1999), 425.
19. Höberg, T. and Norinder, U. In Krogsgaard-Larsen, P., Liljefors, T. and Madsen, U.
(Eds.) A Textbook of Drug Design and Development, 2nd Edition, Harwood
Academic Publishers, Amsterdam. 1996, pp. 94-130.
20. Liljefors, T. and Bøgesø, K.P. J. Med. Chem. 31 (1988) 306.
22. Boström, J., Gundertofte, K. and Liljefors, T. J. Comput.-Aided Mol. Des., 14 (2000)
769.
Figure Captions
Figure 1. The overlay on the left has the following objective values: feature score = 2.72
(representing 4 pharmacophore points) and energy = 247 kJ mol-1. The overlay on the right
has objective values: feature score = 1.22 (representing 2 pharmacophore points) and energy
= 6 kJ mol-1. Thus, the higher feature score is achieved at the expense of conformational
energy. Donors are shown in purple; acceptors in pink; and hydrophobes in cyan. Molecule 1
is in white; molecule 2 in brown; and molecule 3 in blue (see Figure 2).
Figure 2. 5-HT1D agonists.
Figure 3. Schematic of the position of the two overlays illustrated in Figure 1 on the Pareto
surface. Two objectives only are shown for simplicity. Colour scheme as for Figure 1.
Figure 4. Similar overlays of the 5-HT1D ligands that occupy distant points on the Pareto
surface due to differences in their objective values. Overlay (a) has the following objective
values: feature score = 1.61; volume overlay = 1184 Å3 and conformational energy = 579
kJmol-1. Overlay (b) has the following objective values: feature score = 0.72; volume overlay
= 868 Å3 and conformational energy = 5 kJmol-1. Colour scheme as for Figure 1.
Figure 5. Different overlays of the 5-HT1D ligands that have similar objective values and
hence are close on the Pareto surface. Overlay (a) has the following objective values: feature
score = 1.51; volume overlay = 1003 Å3 and conformational energy = 99 kJmol-1. Overlay (b)
has the following objective values: feature score = 1.54; volume overlay = 983 Å3 and
conformational energy = 30 kJmol-1. Colour scheme as for Figure 1.
Figure 6. Alignments of 5-HT1D agonists. Colour scheme as for Figure 1.
Figure 7. (a) Parallel coordinates graph representation of the GASP solutions. (b) Five of the
Figure 8. The “correct” alignment generated by the MOGA. The figure on the left indicates
the distances between the site points whereas the figure on the right indicates the distances
corresponding to the positions of the heavy atoms. Colour scheme as for Figure 1.
Figure 9. Scytalone dehydratase inhibitors.
Figure 10. Different alignments for the scytalone dehydratase inhibitors with the different
rings of 7 aligned to the benzene ring of 4. Donors are shown in purple; acceptors in pink;
and hydrophobes in cyan. Molecule 4 is in white; molecule 5 in orange; molecule 6 in blue;
and molecule 7 in brown.
Figure 11. The manual pharmacophore for the scytalone dehydratase inhibitors generated by
overlaying the crystal structures. Colour scheme as for Figure 10.
Figure 12. Two solutions generated by the MOGA that correspond to alignment 3. Colour
scheme as for Figure 10.
Figure 13. Dopamine antagonists.
Figure 14. Alignments of dopamine D2 antagonists. Donors are shown in purple; acceptors in
pink; and hydrophobes in cyan. Molecule 8 is in brown; molecule 9 in white; and molecule
Tables
MOGA Parameters
Population size 1000
Selection pressure 1.05
No of operations 200000
Crossover rate 50%
Mutation rate 50%
Features niche radius 2
Volume overlap niche radius 100 Å3
Energy niche radius 42 kJ mol-1
GASP Parameters
Population size 100
No. of subpopulations (islands) 5
Selection pressure 1.1
Crossover rate 47.5%
Mutation rate 47.5%
Migration rate 5%
Niche size 2
Energy weight* 0.05
Features weight 750
Volume weight 1 (by definition)
Convergence criteria No increase in fitness > 0.01 over 6500 runs
*Note that the energies in GASP are in kcal.mol-1
Run Total Energy Volume Feature Ring Amine
(donor)
Carbonyl
(acceptor)
Hydroxyl
(acceptor)
Hydroxyl
(donor)
Amide
(donor)
2 3076.61 163.51 1065.80 2.68 ü ü ü ü
4 3046.21 231.04 1191.61 2.48 ü ü ü
6 3045.07 319.16 1228.58 2.43 ü ü ü
3 3027.16 236.21 1209.15 2.43 ü ü ü
9 3020.25 177.53 1007.00 2.69 ü ü ü(x2)
8 2972.20 442.05 1199.30 2.37 ü ü ü
1 2956.92 819.25 1182.92 2.38 ü ü
10 2926.20 1240.05 1043.94 2.53 ü ü ü
7 2843.63 297.15 1046.11 2.40 ü ü ü ü
[image:30.595.69.528.105.317.2]5 2708.31 1281.76 1023.30 2.27 ü ü ü
Table 2. GASP results for 5-HT1D dataset. The runs are ordered on fitness value. The
dominated solutions are shown as shaded. Energies in this and in all subsequent tables are
Alignment Energy Volume Feature Ring Amine (donor) Carbonyl (acceptor) Hydroxyl (acceptor) Hydroxyl (donor) Amide (donor) Run 1
1 -0.25 699.39 1.08 ü ü ü
1 1.22 653.60 0.58 ü ü (x2)
3 64.22 1018.77 2.22 ü ü ü
4 11.21 923.36 1.04 ü (x2) ü (x2)
Run 2
1 -3.40 1065.66 0.71 ü ü (x2)
3 2.14 1015.81 1.98 ü ü ü
4 2.60 987.46 1.27 ü ü (x2)
5 242.68 982.73 1.54 ü ü ü
Run 3
1/3 7021.69 1085.97 1.92 ü ü ü
4 3.53 857.57 1.38 ü ü ü (x2) ü
Run 4
1 -3.40 900.17 1.04 ü ü ü
1 2.14 829.55 1.39 ü ü (x2)
2 2.60 909.50 0.93 ü ü ü
3 242.68 1085.53 2.23 ü ü ü
3 395.51 1115.69 2.17 ü ü ü
3 2.23 903.63 1.54 ü ü ü ü
3 98.78 1003.41 1.51 ü ü ü
[image:31.595.67.536.113.541.2]4 -5.80 483.07 0.65 ü ü ü
Table 3. MOGA solutions found over four runs. The column headed Alignment indicates the
alignment in Figure 6 that the solution corresponds to. The shaded rows indicate solutions
that are dominated. The solution given in bold matches the solution found by Glen et al.
Run Alignment Fitness Energy Volume Features
5 1 2891.08 654.11 1079.46 2.43
3 2 2793.06 956.34 993.50 2.41
8 1 2792.55 1266.76 990.19 2.42
7 2 2684.94 95.55 986.19 2.27
6 1 2631.01 894.81 931.72 2.28
4 1 2587.76 106.64 957.32 2.18
2 2 2586.81 995.27 974.65 2.17
9 2 2538.65 1105.65 901.48 2.20
1 1 2526.47 3320.10 947.88 2.16
[image:32.595.72.373.110.313.2]10 3 2309.28 2550.49 876.79 1.95
Table 4. GASP results for the scytalone dehydratase dataset. The column headed Alignment
indicates the ring of 7 that is superimposed to the aromatic ring of 4. The dominated solutions
Alignment Energy Volume Features
1 -4.91 897.98 0.82
1 11.17 978.07 0.84
2 28.60 838.82 1.78
2 94.00 1000.16 1.63
2 10.50 871.98 1.17
2 -20.12 638.56 0.32
3 45.11 989.68 2.09
3 65.31 1004.30 1.47
4 1311.83 1129.30 1.06
4 1106.99 1074.46 1.39
4 7.35 929.55 0.96
4 47.12 974.17 1.06
N 7.10 942.08 0.32
[image:33.595.79.287.111.381.2]N 4.79 910.03 0.78
Table 5. MOGA results for the scytalone dehydratase dataset. The shaded rows represent
dominated solutions. The column headed Alignment indicates the ring of 7 that is mapped to
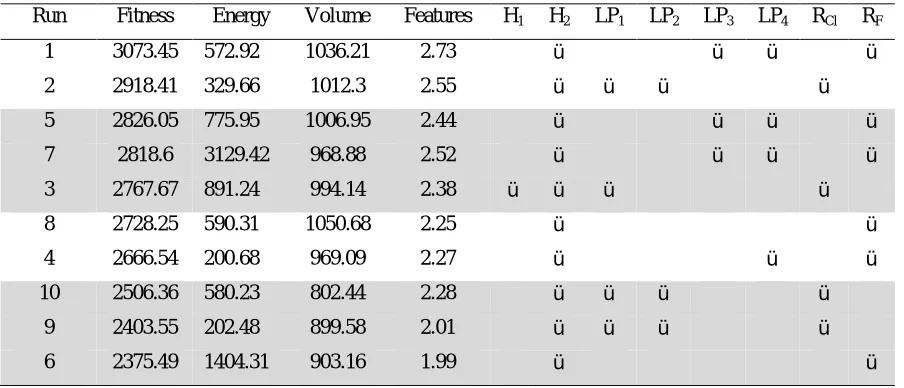
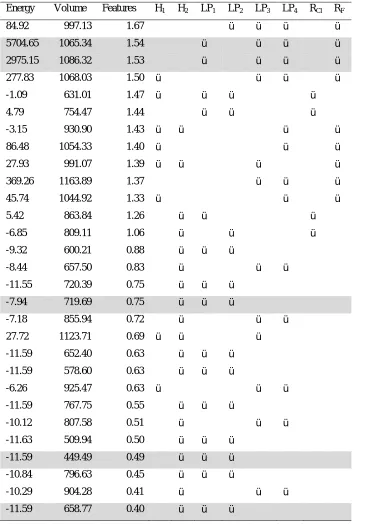
Run Fitness Energy Volume Features H1 H2 LP1 LP2 LP3 LP4 RCl RF
1 3073.45 572.92 1036.21 2.73 ü ü ü ü
2 2918.41 329.66 1012.3 2.55 ü ü ü ü
5 2826.05 775.95 1006.95 2.44 ü ü ü ü
7 2818.6 3129.42 968.88 2.52 ü ü ü ü
3 2767.67 891.24 994.14 2.38 ü ü ü ü
8 2728.25 590.31 1050.68 2.25 ü ü
4 2666.54 200.68 969.09 2.27 ü ü ü
10 2506.36 580.23 802.44 2.28 ü ü ü ü
9 2403.55 202.48 899.58 2.01 ü ü ü ü
[image:34.595.71.523.110.304.2]6 2375.49 1404.31 903.16 1.99 ü ü
Table 6. GASP results for the dopamine dataset sorted on fitness. The dominated solutions
are shaded. A tick in the column headed RF indicates that the fluorobenzene ring of
compound 9 is aligned with the benzene rings in 8 and 10, whereas a tick in the column
headed RCL indicates that compound 9 isflipped completely so that the chlorobenzene ring
Energy Volume Features H1 H2 LP1 LP2 LP3 LP4 RCl RF
84.92 997.13 1.67 ü ü ü ü
5704.65 1065.34 1.54 ü ü ü ü
2975.15 1086.32 1.53 ü ü ü ü
277.83 1068.03 1.50 ü ü ü ü
-1.09 631.01 1.47 ü ü ü ü
4.79 754.47 1.44 ü ü ü
-3.15 930.90 1.43 ü ü ü ü
86.48 1054.33 1.40 ü ü ü
27.93 991.07 1.39 ü ü ü ü
369.26 1163.89 1.37 ü ü ü
45.74 1044.92 1.33 ü ü ü
5.42 863.84 1.26 ü ü ü
-6.85 809.11 1.06 ü ü ü
-9.32 600.21 0.88 ü ü ü
-8.44 657.50 0.83 ü ü ü
-11.55 720.39 0.75 ü ü ü
-7.94 719.69 0.75 ü ü ü
-7.18 855.94 0.72 ü ü ü
27.72 1123.71 0.69 ü ü ü
-11.59 652.40 0.63 ü ü ü
-11.59 578.60 0.63 ü ü ü
-6.26 925.47 0.63 ü ü ü
-11.59 767.75 0.55 ü ü ü
-10.12 807.58 0.51 ü ü ü
-11.63 509.94 0.50 ü ü ü
-11.59 449.49 0.49 ü ü ü
-10.84 796.63 0.45 ü ü ü
-10.29 904.28 0.41 ü ü ü
[image:35.595.71.445.84.608.2]-11.59 658.77 0.40 ü ü ü
Table 7. MOGA solutions for the dopamine dataset. The solutions are ordered on decreasing
feature score. The shaded rows represent dominated solutions. The final two columns indicate
O NH
N H
O H
N H
+
S
N H
N H
+
NH O
O N
H
+
O
NH
OH H
H
N
[image:37.595.70.412.121.298.2]1 2 3
F
eat
u
re
sc
o
re
Energy
F
eat
u
re
sc
o
re
[image:38.595.74.507.110.461.2]Energy
1 2
3 4
[image:41.595.60.530.79.746.2]5
0 0.2 0.4 0.6 0.8 1 1.2
Volume Feature Energy
Sol 2 Sol 4 Sol 6 Sol 3 Sol 9 Sol 8 Sol 1 Sol 10 Sol 7 Sol 5 Figure 7a. 0 0.2 0.4 0.6 0.8 1 1.2
Volume Feature Energy
[image:42.595.83.422.125.345.2]
(a) Ring 1 (b) Ring 2
[image:45.595.70.508.109.553.2](c) Ring 3 (d) Ring 4
N H + NH2 MeO S Et O O O N H Et N H + Cl OH O F N H + Et Cl Cl O H OMe O N H
8 9 10
N H + NH2 MeO S Et O O O N H Et N H + Cl OH O F N H + Et Cl Cl O H OMe O N H
8 9 10