Comparative study of solar cycles 22 to 24 in relation
to solar output variability
Sham Singh, Divya Shrivastava, Shri Ram Lahauriya, Adya Prasad Mishra
Department of Physics, Awadhesh Pratap Singh University, Rewa, India; [email protected], [email protected]
Received 25 January 2012; revised 27 February 2012; accepted 10 March 2012
ABSTRACT
The rate of increase in solar activity at the initia- tion of solar cycle 22 had led the activity during the solar maximum years 1990-1991, be the most severe of any period during the space age. Solar cycle 23 started in May 1996 and ended in December 2008. Total time period of this solar cycle is 12.6 years. The maximum smoothed sunspot number observed during the solar cycle was 120.8 and minimum was 1.7. It is apparent that solar cycle 23 is a long one. Solar cycle 24 (initiated in December 2008) seems to be weak, which will have a slow ramp up, much slower than the late 19th century cycles used for com- parison. In the present work, we have consid- ered Sunspot number (Rz) as an index of solar activity, which shows a predominant 11 year cycle. The strength of the solar cycle makes a huge difference to satellite operators. Each solar peak heats and expands the outer atmosphere. The strength of the solar-cycle length, annual average and temperature correlation enables solar cycle length to be used as a climate pre- dictor tool.
Keywords:Solar Activity; Cosmic Ray Intensity; Geomagnetic Activity
1. INTRODUCTION
Analyses of solar and geomagnetic activity are impor- tant to various technologies, including the operation of low-Earth orbiting satellites, electric power transmission grids, geophysical operation, and high frequency radio communications. Influence of solar activity during dif- ferent phases of solar cycle on geomagnetic disturbance and geomagnetic hazards has been discussed in the lit- erature [1-3]. The entire structure of the Sun’s magnetic field changes in 11-year cycle. During a solar cycle the strongest magnetic fields slowly migrate towards the Sun’s equator from locations about midway to the Sun’s
poles. The 11-year period is not constant but varies from one cycle to other between 9.5 to 12.5 years [4]. The position of the sunspots is not random [5]. They first appear in the middle latitudes above and below the Sun’s equator. After 11-years when the most cycle begins, the magnetic field poles are reversed. Solar cycles 22 and 23 was 9.7 and 12.6 years long respectively [6,7]. Cycles 22 and 23 both showed large annual average of geomagne tic activity in comparison with most cycle in the record of aa indices. The dramatic variability from one cycle to the next in these sunspot and geomagnetic records shows the difficulty in making empirical predictions of both types of activity. In the present work, we have analyzed the solar output variability during solar cycles 22 to 24.
2. SELECTION CRITERIA AND DATA
SOURCE
In the present study, we have studied correlation of Cosmic Ray Intensity with solar activity and geomag- netic activity. The relationship between solar activity and Cosmic Ray Intensity (CRI) in solar cycles 22 to 24 has also been analysed. The significance of the geomagnetic Aa index in tracking long-term solar activity has been documented in the literature [8]. For this purpose we have selected CRI data of Moscow Neutron Monitor (cut off rigidity 2.42 GV) and the data of geomagnetic active- ity (aa Indices and Ap Indices) have been taken from web
site (www.geomag.bgs.ac.uk/daaservice/dat). The inter-
national SSN data was downloaded from the National Geophysical Data Centre web site
(htt://www.ngdc.noaa.gov/stp/SOLAR/ftpsunspotnumber .html).
3. RELATIONSHIP BETWEEN SOLAR
ACTIVITY AND COSMIC RAY
INTENSITY
200.3 on August 1990 and minimum 1.1 on June 1987. In cycle 23, maximum SSN was 150.7 on Sept. 2001 and minimum 0.9 on Oct. 2007. Cycle 22 was started in Sept. 1986 after four years it reached maximum level but cycle 23 started in May 1996 and becomes maximum in Sept. 2001, it took more time to reach maxima as compared to cycle 22. The weaker and longer solar cycles of the late
19th and early 20th century were associated with weather
that was much colder than that of the late 20th century [9].
Brown and Williams [10] have noticed an extremely high
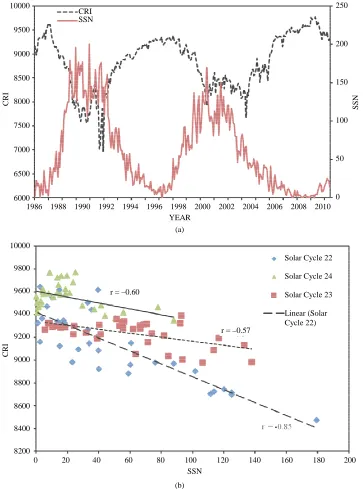
correlation between geomagnetic activity near solar minimum and the size of the next solar cycle. Strong correlations were found between the number of geomag- netic abnormal quite days and the size of the next solar cycle. The relationship of SSN and CRI is clearly seen in
Figure 1(a). It is observed from Figure 1(b) that the
anti-correlation between SSN and CRI has been ob- served to –0.85, –0.57 and –0.60 during ascending phases of cycles 22, 23 and 24 respectively. The period of minimum CRI is much broader in cycle 23. Cosmic Ray
1986 1988 1990 1992 1994 1996 1998 2000 2002 2004 2006 2008 2010 YEAR
10000
9500
9000
8500
8000
7500
7000
6500
6000
250
200
150
100
50
0 CRI
SSN
CR
I
SS
N
(a)
0 20 40 60 80 100 120 140 160 180 200 SSN
10000
9800
9600
9400
9200
9000
8800
8600
8400
8200
r = –0.60
CRI
r = –0.57
Solar Cycle 22
Solar Cycle 24
Solar Cycle 23
Linear (Solar Cycle 22)
[image:2.595.118.481.216.705.2](b)
Figure 1. (a) Shows long term variation of between SSN and CRI for the solar cycles 22 to 24;
0 50 100 150 200 250 SSN
10000
9500
9000
8500
8000
7500
7000
CR
I
r = –0.60
r = –0.75
Solar Cycle 22
Solar Cycle 24
Solar Cycle 23
Linear (Solar Cycle 22) Linear (Solar Cycle 23)
r = –0.87
(a)
0 50 100 150 200 250 SSN
3000
2500
2000
1500
1000
500
0
So
la
e F
lu
k
(Solar Flux) y = 9.4379x + 633.15
r = 0.97197
Linear (Solar Flux)
[image:3.595.118.479.86.508.2](b)
Figure 2. (a) Shows the cross plot between CRI and SSN for the cycles 22 to 24; (b) Shows the
cross plot between Solar Flux and SSN for the cycles 22 to 24.
Intensity is maximum in 1986-1987, after 11 years it oc- curred in 1996-1997 and again after 11 year in 2006- 2007. The next maximum is expected in 2016-2017. The longterm variation has shown strong negative correlation for cycles 22, 23 and 24. The correlation coefficient be-tween CRI and SSN for the cycles 22, 23 and 24 found to
be –0.87, –0.75 and –0.60 respectively (Figure 2(a)). We
have also obtained the correlation coefficient between Solar Flux and SSN, and positive correlation is found as
depicted in (Figure 2(b)).
4. RELATIONSHIP BETWEEN SOLAR
ACTIVITY, CRI AND GEOMAGNETIC
ACTIVITY
We have considered the Ap and aa Indices to observe
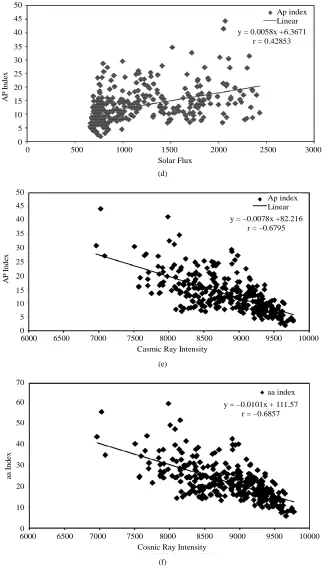
the long term variations of geomagnetic field distur- bances. It is well known that the geomagnetic distur- bances are associated with solar outputs emanates from the surface of the Sun, which in turn propagate their en-ergy through solar wind and interplanetary magnetic field to long distance in heliosphere. We have plotted the monthly mean value of SSN, SF, and CRI with monthly mean values of Ap and aa Indices. We have found the positive correlation (correlation coefficient 0.45) between
SSN and Ap (Figure 3(a)) for the period 1986 to 2011,
which cover the solar cycles 22 to 24. Similar plot is
drawn for SSN and aa indices (Figure 3(b)) for which
the correlation coefficient is 0.42 and similar result for
correlation between SF with Ap & aa indices (Figures
0 50 100 150 200 250 SSN
50
45
40
35
30
25
20
15
10
5
0
A
P
I
n
de
x
Ap index
y = 0.0417x + 12.61 r = 0.453471
(a)
0 50 100 150 200 250 aa Index
70
60
50
40
30
20
10
0
SSN
aa index y = 0.0805x + 17.364
r = 0.4239
(b)
0 500 1000 1500 2000 2500 3000 Solar Flux
70
60
50
40
30
20
10
0
aa
I
n
d
ex
aa index
y = 0.0082x + 12.539 r = 0.41596
0 500 1000 1500 2000 2500 3000 Solar Flux
50
45
40
35
30
25
20
15
10
5
0
AP
I
n
d
ex
Ap index Linear y = 0.0058x +6.3671
r = 0.42853
(d)
6000 6500 7000 7500 8000 8500 9000 9500 10000 Casmic Ray Intensity
50
45
40
35
30
25
20
15
10
5
0
A
P
In
de
x
Ap index Linear y = –0.0078x +82.216
r = –0.6795
(e)
6000 6500 7000 7500 8000 8500 9000 9500 10000 Cosnic Ray Intensity
70
60
50
40
30
20
10
0
aa
I
n
d
ex
aa index
y = –0.0101x + 111.57 r = –0.6857
[image:5.595.135.459.85.653.2](f)
Figure 3. (a) Shows the cross plot between Ap Index and SSN for the solar cycles 22 to
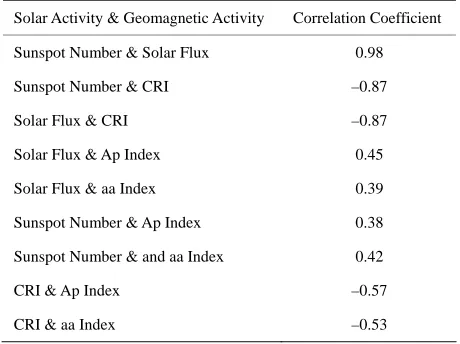
Table 1. Correlation coefficient between solar activity, cosmic ray intensity and geomagnetic activity for cycle 22.
CRI with Ap and aa indices. The correlation coefficient
–0.67 & –0.68 is found as depicted in Figures 3(e) and
3(f)). The correlation coefficient, cosmic ray intensity
and geo- magnetic activity for solar cycles 22, 23 and 24
has been shown in Tables 1-3.
Solar Activity & Geomagnetic Activity Correlation Coefficient
Sunspot Number & Solar Flux 0.98
Sunspot Number & CRI –0.87
Solar Flux & CRI –0.87
Solar Flux & Ap Index 0.45
Solar Flux & aa Index 0.39
Sunspot Number & Ap Index 0.38
Sunspot Number & and aa Index 0.42
CRI & Ap Index –0.57
CRI & aa Index –0.53
REFERENCES
[1] Dubey, S.C. and Mishra, A.P. (2000) Solar wind streams and intense geomagnetic storms observed during 1986- 1991. Earth Moon and Planets (Netherlands), 84, 23-31.
doi:10.1023/A:1026566510077
[2] Dubey, S.C. and Mishra, A.P. (2001) Study of the solar wind streams associated with intense geomagnetic storms.
Bulletin of the Astronomical Society of India, 29, 127-
134.
[3] Dubey, S.C. and Mishra, A.P. (2000) Characteristics of large geomagnetic storms observed during solar cycle 22.
[image:6.595.59.284.323.493.2]Indian Journal of Radio and Space Physics, 29, 51.
Table 2. Correlation coefficient between solar activity, cosmic
ray intensity and geomagnetic activity for cycle 23. [4] Mursala, K. and Ulich, T. (1998) A new method to deter-mine the solar cycle length. Geophysical Research Letters,
25, 1837-1840. doi:10.1029/98GL51317
Solar Activity & Geomagnetic Activity Correlation Coefficient
Sunspot Number & Solar Flux 0.97
Sunspot Number & CRI –0.75
Solar Flux & CRI –0.76
Solar Flux & Ap Index 0.43
Solar Flux & aa Index 0.42
Sunspot Number & Ap Index 0.40
Sunspot Number & and aa Index 0.42
CRI & Ap Index –0.68
CRI & aa Index –0.69
[5] Lean, J., Skumanich, A. and White, O. (1992) Estimating the Sun’s radiative output during the maunder minimum.
Geophysical Research Letters, 19, 1591-1594.
doi:10.1029/92GL01578
[6] Kane, R.P. (2002) Some implications using the group sunspot number reconstruction. Solar Physics, 205, 383- 401.
[7] The Sun. Did you say the Sun has spot? Space Today Online.
http://www.spacetoday.org/SolSys/Sun/Sunspots.html. Retrieved 12 August 2010
[8] Feynman, J. and Gu, X.Y. (1986) Prediction of geomag-netic activity on time scales of one to ten years. Reviews of Geophysics, 24, 650-666.
[image:6.595.59.285.533.704.2]doi:10.1029/RG024i003p00650
Table 3. Correlation coefficient between solar activity, cosmic
ray intensity and geomagnetic activity for cycle 24. [9] Loehle, C. (2007) A 2000-year global temperature recon-struction based on non-treering proxies. Energy and En-vironment, 18, 1049-1058.
doi:10.1260/095830507782616797
Solar Activity & Geomagnetic Activity Correlation Coefficient
Sunspot Number & Solar Flux 0.98
Sunspot Number & CRI –0.60
Solar Flux & CRI –0.59
Solar Flux & Ap Index 0.45
Solar Flux & aa Index 0.40
Sunspot Number & Ap Index 0.47
Sunspot Number & and aa Index 0.42
CRI & Ap Index –0.52
CRI & aa Index –0.42
[10] Brown, G.M. and Williams, W.R. (1969) Some properties of the day-to-day variability of Sq(H). Planetary and Space Science, 17, 455-469.