This is a repository copy of
Development of a mechatronic sorting system for removing
contaminants from wool
.
White Rose Research Online URL for this paper:
http://eprints.whiterose.ac.uk/680/
Article:
Zhang, L., Dehghani, A., Zhenwei, S. et al. (3 more authors) (2005) Development of a
mechatronic sorting system for removing contaminants from wool. IEEE/ASME
Transactions on Mechatronics, 10 (3). 297- 304. ISSN 1083-4435
https://doi.org/10.1109/TMECH.2005.848298
[email protected] https://eprints.whiterose.ac.uk/ Reuse
See Attached
Takedown
If you consider content in White Rose Research Online to be in breach of UK law, please notify us by
Liwei Zhang, Abbas Dehghani, Zhenwei Su, Tim King
, Senior Member, IEEE
, Barry Greenwood, and
Martin Levesley
Abstract—Automated visual inspection (AVI) systems have been extended to many fields, such as agriculture and the food, plastic and textile industries. Generally, most visual systems only inspect product defects, and then analyze and grade them due to the lack of any sorting function. This main reason rests with the difficulty of using the image data in real time. However, it is increasingly impor-tant to either sort good products from bad or grade products into separate groups using AVI systems. This article describes the devel-opment of a mechatronic sorting system and its integration with a vision system for automatically removing contaminants from wool in real time. The integration is implemented by a personal com-puter, which continuously processes live images under the Win-dows 2000 operating system. The developed real-time sorting ap-proach is also applicable to many other AVI systems.
Index Terms—Automated visual inspection (AVI), color image, contaminants, mechatronic sorting system, wool.
I. INTRODUCTION
C
ONTAMINANTS of different colors, sizes, and shapes are always present in raw wool used for textile manufac-ture. These contaminants mainly include polypropylene (PP) baler twines, packaging materials, plastic materials, urine/fecal-stained wool, paint sheep marker, and black pigmented fibers, and their sizes are generally 4–20 cm long. For many practical applications, their presence will lead to serious color defects in products such as woven fabrics, carpets, and knitwear, where a solid color is required because they do not dye to the same shade as wool fibers. Currently, in the United Kingdom alone, this problem is conservatively estimated to cost the textile in-dustry more than £6M each year.In more recent years, the automatic removal of contaminants from raw wool has remained a challenging problem. Currently, they are only manually removed during the wool scouring (cleaning and degreasing) process by human visual inspection. However, the efficiency of the contaminant detection and removal by the pickers, often working for long hours at this tedious task, is very low; moreover, significant amounts of
Manuscript received August 17, 2003; revised December 25, 2003. This work was supported by the U.K. Department of Trade and Industry under Grant KBBB/C/013/00007. Recommended by Technical Editor J. T. Sawicki.
L. Zhang, Z. Su, and B. Greenwood are with the School of Design, Univer-sity of Leeds, Leeds LS2 9JT, U.K. (e-mail: [email protected]; [email protected]; [email protected]).
A. Dehghani was with the School of Design, University of Leeds, Leeds LS2 9JT, U.K. He is now with the School of Mechanical Engineering, University of Leeds, Leeds LS2 9JT, U.K. (e-mail: [email protected]).
T. King and M. Levesley are with the School of Mechanical Engineering, University of Leeds, Leeds LS2 9JT, U.K. (e-mail: [email protected]; M.C. [email protected]).
Digital Object Identifier 10.1109/TMECH.2005.848298
unseen and unwanted materials still remain in the wool after picking [1].
This study develops an AVI system to automatically detect and remove contaminants from wool to increase the efficiency of contaminant removal and avoid the drawbacks of inspection by human operators. The requirements of the developed system are that it should
• be able to identify all types of contaminants (minimum size is roughly 4 cm);
• be able to sufficiently reduce contaminant levels to allow uniform dyed solid shades to be achieved; • remain stable and operate in real time;
• be easy to incorporate into wool scouring lines (typi-cally running at 5 m/min);
• satisfy the requirement for a production rate of at least 1000 kg/h.
II. BACKGROUND
In visual servo control of robotic manipulators, it is quite common to use visual data to control the action of these robots [2], [3] where open-loop or closed-loop controllers were de-signed and used. Although applications of processing images for automatic control in noncontact inspection have been ex-plored and investigated [4]–[6], fully automatic control using the imaging data has yet not been successful.
In AVI systems used for process control in the textile industry, there exists one case of implementing closed-loop control using visual sensing data [7], where a knowledge-based process con-trol system incorporating a machine vision system was used. However, the control process could not satisfy the production rate requirement. Although AVI systems for inspecting foreign or defective materials are widely used in many fields, only a few can successfully complete online real-time control using contin-uous incoming image data. A computer vision-based system for automatic lace scalloping has been reported by Shihet al.[8], but details of the control process were not presented.
Earlier research work on contaminant removal from wool and other fibers comes from CSIRO Division of Wool Technology, Australia [9]. In their system, optical inspection was tried but hampered by the need to separate the flow of scoured wool into six separate streams. As a result, the efficiency and performance of the sorting were not promising in their system. Later, Lan-genhoveet al.[10] developed a quality control machine to de-tect and remove contaminants from raw cotton at a throughput rate of up to 1500 kg/h. The need for contaminant removal from cotton [11] resulted in the further development of an AVI system
298 IEEE/ASME TRANSACTIONS ON MECHATRONICS, VOL. 10, NO. 3, JUNE 2005
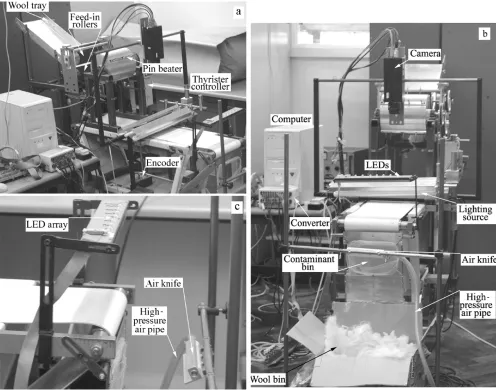
Fig. 1. Test rig of automated visual inspection system in the lab.
to inspect foreign fibers and blow them off using high-pressure compressed air, which was located at a point immediately be-fore carding.
However, these systems can only detect and remove contam-inants depending on color difference. Furthermore, they could not be used for contaminant removal from wool because wool fibers are much longer than cotton and more mingled.
In the two systems [10], [11] described previously, the re-jection device was installed near the point of inspection. This means the control components must work within a short fixed period of the image being processed. As a result, this system is not flexible enough to deal with the variable speed of image processing.
Despite an extensive literature search, no literature was found to report the successful integration of a sorting function with a machine vision system. The sorting system presented in this article can be installed far away from the inspection location. Moreover, the method by which the continuous incoming live images data are used for real-time control is general and appli-cable to many other AVI systems.
The AVI system developed in this article consists of three sub-systems: wool preopening system, vision system, and sorting
system. The wool preopening system [Fig. 1(a)] is described in Section III. The vision system [Fig. 1(b)] is discussed in Section IV. Finally, the development of the sorting system [Fig. 1(c)] is reported in Section V. System performance tests are carried out in Section VI, and conclusions are drawn in Section VII.
III. PREOPENINGSYSTEM
In current wool scouring plant, the presentation of scoured wool is not suitable for automatic contaminant detection and re-moval because the wool tufts are entangled together in a thick layer (about 20–30 cm), running at a speed of 5 m/min. To present the wool in a uniform thin layer for inspection, first, the conveyor in the inspection zone was run at a speed of 20 m/min so the wool could be drafted into one-fourth of the orig-inal thickness. Second, an opening device has been designed and constructed to separate wool into small tufts, and distribute it into a loose and thin layer so all the contaminants are visible on the surface of the wool and can, therefore, be easily identified and blown away.
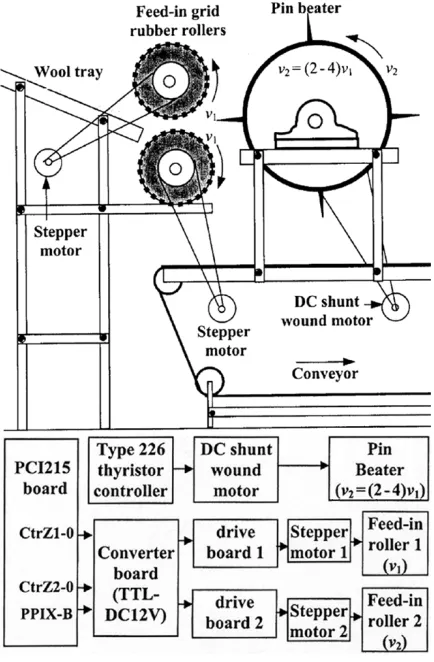
Fig. 2. Schematic diagrams for the preopening system.
constructed to separate the wool into small tufts without further subdividing the contaminants [Fig. 1(a)]. The device consisted of two rubber-covered, feed-in rollers and one large roller with four groups of pin bars. The feed-in rollers gently restrain the wool tufts and are driven by two independent stepper motors. An Amplicon PCI215 counter/timer board sets both stepper mo-tors’ speeds as the drive speed of the conveyor. The large roller with pinned bars is used to open out the wool tufts from the feed system. A dc shunt wound motor drives the large roller run-ning between two to four times faster than the feed-in rollers. The schematic diagrams for the preopening system are shown in Fig. 2.
The experimental results obtained from the laboratory pre-opening system were successfully used to modify the hopper machine [12] for wool preopening in a large-scale factory test rig.
IV. VISIONSYSTEM
A. System Configuration
Fig. 1 shows the constructed online AVI system. The main components of the vision system are a Dalsa Trillium 34-color line scan camera (resolution 2048 pixels, maximum line scan rate 11 kHz), a host computer (3.06 GHz Pentium IV CPU, 1 Gb RAM), a Coreco Viper-Digital framegrabber installed in the host computer, two fluorescent tubes with high-frequency electronic ballasts, and a 235-mm wide conveyor running at
B. Online Image Acquisition and Processing
Development of real-time software has been undertaken using the Coreco Sapera imaging library package and Mi-crosoft Visual C++ 6.0. The whole image acquisition process is controlled by the i960 system controller and the PLX chip (a PCI interface chip targeted at video applications) on the Coreco Viper-Digital framegrabber. The host CPU is not involved with the management of data transfers, address generation, and in-terrupt of every image [13]. As a result, live image acquisition and processing are a continuous procedure, where the host computer displays and processes the images buffer by buffer, in parallel with the image acquisition.
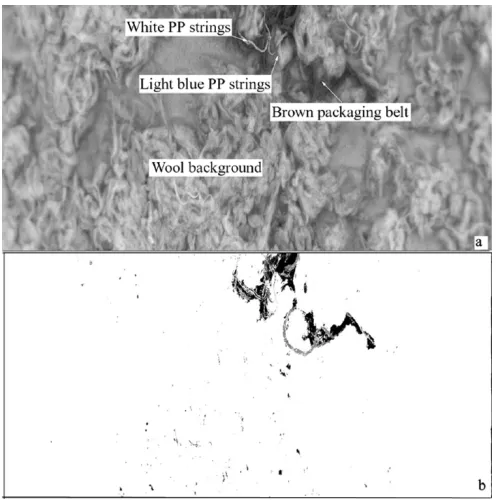
Real-time image-processing algorithms were developed in RGB and HSV color spaces. First, every color image in the RGB color space is split into red, green, and blue gray-scale images and transformed into the HSV color space. Then, every gray-scale image in the RGB color space is separately processed by global and local adaptive threshold algorithms for identifica-tion of deep color, light, and white color contaminants; the satu-ration gray-scale image in the HSV color space is processed by a global adaptive threshold algorithm for identification of white, light yellow, and brown color contaminants. The last processed image is the addition of the processed gray-scale images. Fi-nally, the blob features were extracted, and the coordinates of the centroids of the identified contaminants were calculated. The algorithms are capable of identifying 96% of all typical contam-inant types (50), including all the deep color contamcontam-inants and most of the light and white color contaminants with minimum size of 4 cm long, both in the lab. and in the factory test rig. A typical processed image is shown in Fig. 3, where the small white PP (4 cm long, 3–4 mm in diameter) and light blue PP (3–4 mm in diameter) were clearly identified. More details of the image-processing algorithms are presented in [14] and [15]. In the following development, the camera runs at about 2000 lines/s, and only the global adaptive threshold algorithm is used to simulate practical factory situation due to the short distance (0.53 m) between the camera and the end of the conveyor (DCC) in the lab. test rig (compared with 1.2 m in the factory). The time range of processing one buffer of image (1024 2048) is 120–150 ms. If the DCC were longer, complex image-pro-cessing algorithms could be used for the development of the sorting system.
V. DEVELOPMENT ANDINTEGRATION OF AMECHATRONIC
SORTINGSYSTEM
300 IEEE/ASME TRANSACTIONS ON MECHATRONICS, VOL. 10, NO. 3, JUNE 2005
Fig. 3. Typical wool image with contaminants and processed image. (a) Original image. (b) Processed image.
The main principle of the integration of the sorting system is to change the processed high-resolution image (resolution 1024 2048) to a low-resolution one, synchronized with the spatial position of the moving contaminants on the conveyor. The spatial positions can be obtained by extracting the coordi-nates of the contaminant centroids from the processed live im-ages. The low-resolution image data are then stored in a cir-cular buffer. The data in the circir-cular buffer are sent to a re-moval mechanism one by one to remove the contaminants using a synchronous interrupt routine. The time at which the solenoid valves are actuated can be calculated to efficiently remove the contaminants without extensive loss of wool.
The choice of removal mechanism, generation of the circular buffer, the synchronous interrupt controlled data transmission mode, and the integration procedure are presented in the fol-lowing sections.
A. Choice of Removal Mechanism
Two possible methods were considered to remove the contaminants, namely, mechanical and pneumatic removal methods.
For the mechanical removal method, a robotic device was considered. A pneumatic actuator or a solenoid can be used to drive a mechanical gripper to remove the contaminants within a short time interval (about 512 ms in this application). How-ever, it is difficult to complete the necessary actions within such a short time interval. Moreover, the wool and contaminants are very light and difficult to release after they are gripped. There-fore, the robotic device was ruled out.
For the pneumatic removal method, air knives are used in-stead of air nozzles because the active length of the air knives is much longer than the air nozzles. Initially, an air knife using a high-velocity air source (from blower, type ATV28*U41N4)
Fig. 4. Schematic structure of the control system.
was considered to be a potential mechanism. However, it was frustrated due to the lack of readily available product to con-trol the high-velocity air flow through the air knife. As a result, the attention moved to the use of high-pressure compressed air. This allows the use of smaller diameter pipes. In consequence, the solenoid valves with short response time (less than 20 ms) can be used to control the air flow through the air knife. The length of the air knife can be selected to suit practical end use.
For the laboratory test rig [Fig. 1(b)], only one air knife (15 cm long) was used. For the large-scale factory trials, how-ever, an array of air knives (8) would be installed across the 1.45- m wide conveyor. To simulate control in this situation, eight less powerful solenoid valves (24 V dc) were installed at the end of the conveyor, which directed jets of the high-pres-sure compressed air through the nozzles. These valves are controlled by the Amplicon PCI215 board. One converter is used to change the TTL-level signals to 24 V dc signals. The schematic structure of the control system is shown in Fig. 4. Eight light-emitting diodes (LEDs) were connected in parallel with the eight solenoid valves to indicate the status of the valves.
B. Generation of a Circular Buffer
By the time the first buffer of image data has been processed and moved to the solenoid valve array, two further buffers of image data have been acquired and processed into low-resolu-tion image data on the lab. test rig. To not lose the low-resolulow-resolu-tion image data, a buffer space is needed to store them. A printer buffer [16] was successfully modified into a circular buffer for this purpose. Every buffer of the high-resolution image (1024 2048) is changed to 1 byte of a low-resolution image once it has been processed. The size of the low-resolution image is chosen according to the required actuating time of the solenoid valves for efficiently removing the contaminants. The minimum size of the buffer is limited by the distance between the camera and the solenoid valves, whereas the maximum size of the buffer is limited only by the size of the computer free memory.
[image:5.594.306.552.64.119.2]Fig. 5. Schematic diagram of the circular buffer.
continues. The data output from the circular buffer is controlled by a synchronous interrupt routine. When the byte in the last ad-dress of the buffer is sent to the solenoid valve array, the output address pointer is reset to the beginning address of the buffer, and the process of data output continues.
C. Interrupt Controlled Data Transmission
An interrupt is an event that forces the CPU to modify the se-quence of actions. In this application, a hardware INTR (inter-rupt request) [17] is used because the Amplicon PCI215 board can generate an INTR signal. Normally, a real-time system in-teracts with external events via the computer hardware. External events are converted into interrupts and handled by a device driver. In the Windows 2000 operating system, the interrupt is processed in two stages. First, it is processed by a short interrupt servicing routine (ISR). Afterward, the process is completed by executing a deferred procedure call (DPC) [18].
To complete real-time operation of the AVI system in this application, an interrupt-controlled data transmission mode is used for passing the low-resolution image data to the solenoid valves. The Amplicon PCI215 board has six external interrupt sources [19], two of which (outputs of the counters CtrZ1-1 and CtrZ2-1) are used to generate INTR signals to the host com-puter. Every counter on the Amplicon PCI215 board has six working modes, two of which (mode 0-Interrupt on terminal count and mode 1-Rate generator) are used to configure the counters CtrZ1-1 and CtrZ2-1 for generation of the INTR sig-nals. These interrupts are then handled by Windows callback functions (WCFs) to complete data output to the solenoid valve array. In this way, the CPU and the counters of the Amplicon PCI215 board can work in parallel, which satisfies the require-ment of real-time control.
D. Generation of Synchronized Signals
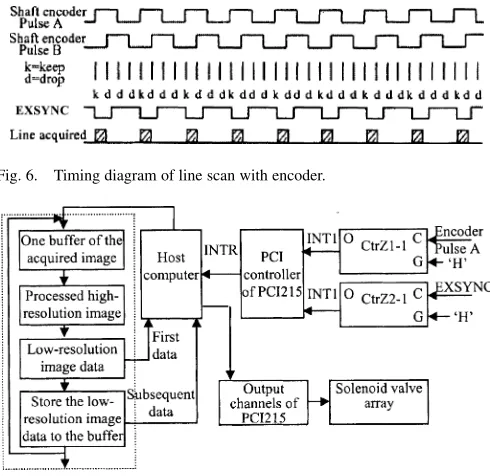
For the sorting system to work reliably, it is essential that the interrupt-controlled data transmission is synchronized with the movement of the wool on the conveyor. To achieve this, an encoder (resolution 12 pulses/mm), driven by the belt, is used to provide A and B RS422 differential signals. These signals are used for two key tasks: 1) to ensure the first data in the circular buffer is sent out to actuate the solenoid valves at the right time; and 2) to control the line scan rate of the camera and generate a fixed integration time. The A and B signals from the encoder are fed to the Coreco Viper-Digital framegrabber to build up the EXSYNC signal (Fig. 6). It is the signal that is used to trigger the camera to read one line image. In this way, the line scan rate is synchronized with the conveyor speed. As a result, small variations on the belt speed are taken into account.
Fig. 6. Timing diagram of line scan with encoder.
Fig. 7. Flowchart of integration of the sorting system.
Based on the previous analysis, the encoder signals and EXSYNC signals are used as synchronous signals for the interrupt-controlled data transmission. The first data in the circular buffer should be sent to the solenoid valve array after a fixed number of pulses (depending on DCC) from either A or B signal have been counted following the image acquisition. The subsequent data in the circular buffer should be sent each time when every 1024 EXSYNC pulse has been counted.
E. Integration Procedure of Sorting System
The flowchart of integration of the sorting system is shown in Fig. 7. The process of integration is separated into two parts. First, the low-resolution image (1 8) data transformed from the processed high-resolution images with the spatial position of moving contaminants on the conveyor are sequentially stored in the circular buffer. Second, data in the circular buffer are sent to the solenoid valve array under the control of the spatial synchronization through the interrupt routine of the host com-puter. Following the movement of the conveyor, the output of the counter CtrZ1-1 [the encoder signal as its clock source, mode 0,
counting number 6360 ] is used to
generate the first INTR signal. A WCF handles the INTR signal and sends the first data in the circular buffer to the solenoid valve array; the output of the counter CtrZ2-1 [EXSYNC signal as its clock source, mode 2, counting number 1024 (width of high-res-olution image)] is used to generate the subsequent INTR sig-nals. A WCF is periodically called to handle the INTR signal and sends the subsequent data in the circular buffer to the so-lenoid valve array. The schematic diagram of the interrupt oc-currence is shown in Fig. 8. The two WCFs are presented in the Appendix.
[image:6.594.38.287.67.149.2]302 IEEE/ASME TRANSACTIONS ON MECHATRONICS, VOL. 10, NO. 3, JUNE 2005
Fig. 8. Schematic diagram of interrupt occurrence.
is jumped out and is then rapidly called again until the output address pointer does not equal the input address pointer.
VI. PERFORMANCETEST ANDANALYSIS
A wide range of tests were carried out to evaluate the per-formance of the developed AVI system. These cover two as-pects—contaminant identification tests (results were reported in Section IV-B), and accuracy and stability tests for the sorting system, discussed in the following sections.
A. Accuracy and Stability Tests on Lab. Test Rig
The accuracy and stability tests on the lab. test rig (Fig. 1) include signal accuracy test, accuracy test for practical sorting, and signal stability test.
The signal accuracy test is used to verify whether the corre-sponding solenoid valves can be actuated at the right time when the contaminants pass through them. An LED array is used to inspect the accuracy of the output signal to the solenoid valve array. For easy and repeatable testing, wool and several con-taminants were uniformly stuck on the surface of the conveyor (using double-sided adhesive tape). The vision system and in-tegration program were then run. It was found that the corre-sponding LEDs could correctly illuminate the contaminants at every occasion when the contaminants passed under them.
An accuracy test for practical sorting was carried out using one air knife and one solenoid valve. Loose wool with contami-nants was fed onto the conveyor through the preopening system. The vision system and the integration program were then run. It was found that the contaminants were blown into the contami-nant bin at every occasion as the contamicontami-nants pass through the air knife. The actuation time of the solenoid valve is about 512 ms, which is enough to remove the contaminants without un-necessary loss of wool.
Signal stability test was undertaken to check the reliability of the sorting system. The setup for the test is the same as for the signal accuracy test. The test, which was carried out numerous times, involved running the system continuously for about 3 h. When the system was running, the contaminants could also be dropped into the inspection zone to check the accuracy of the output signals to the solenoid valve array, as indicated by the corresponding LEDs. The test has proved that the system could remain stable and accurate after being run for a long period of time.
B. Accuracy Test on the Factory Test Rig
A factory test rig was constructed on the basis of the tech-niques developed on the lab test rig. The modified hopper
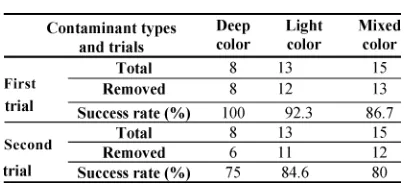
ma-TABLE I EXPERIMENTALRESULTS
chine was used to open and distribute the short to medium en-tangled wool into a uniform thin layer to the inspection zone. The conveyor in the inspection zone runs at 20 m/min, and the same vision components as those on the lab. test rig were used to inspect the wool on the whole width of the conveyor (1.45-m wide). An array of 15-cm long air knives (8) driven by the so-lenoid valves (Norgren VM10) were installed at the end of the conveyor. The DCC is 1.2 m compared with 0.53 m for the lab. test rig.
In this test, the real-time image-processing algorithm pre-sented in Section IV-B was used, for which the time range for processing one buffer of image is 650–950 ms. The camera line scan rate of 800 lines/s and low-resolution image size of 2 8 bytes were set for real-time AVI.
Two trials were carried out for the accuracy test. The first trial was to drop different types and shapes of contaminants (min-imum size 4 cm) onto the conveyor, upstream of the inspection point. The second trial was carried out by mixing different types of contaminants with wool in the hopper tank (other test condi-tions were the same as for the first trial). In both trials, the suc-cess or failure of contaminant removal was observed by human vision. Every trial was repeated three times. The results are sum-marized in Table I, where light color contaminants include white color ones and mixed color contaminants include deep color and light color ones.
In trial 1, a high success rate of contaminant removal is ob-tained because the contaminants were all present on the surface of the wool. Unremoved contaminants were all light in color and were not identified. In trial 2, a comparative lower success rate of contaminant removal was obtained because some unremoved contaminants were covered by wool and thus not identified, de-spite the wool having been presented in a very thin layer.
C. Results and Analysis
Because the conveyor on both the lab. test rig and factory test rig runs four times faster than the speed of the conveyor in the scouring line (5 m/min), when the AVI system fits into the scouring line, the system will be able to maintain its existing production rate. Only a small amount of wool was blown away along with the contaminants.
Two factors have been considered to affect the accuracy and stability of the sorting system. One is the rising edge of the EXSYNC signal. The other is the Windows 2000 operating system.
scheduled through the operating system, sometimes executes after the interrupt occurs. However, the delays not only are small, but can also compensate the error caused by the rising edge of the EXSYNC signal. Moreover, they are not accumu-lated due to the automatic counting of the counter (Fig. 8). Therefore, the AVI system can remain stable and accurate for a long period of time.
In addition, the maximum DCC is limited by the maximum counting number of the counter. If 32 bits of counter and a lower resolution encoder were used, the DCC could be very long due to the use of the circular buffer.
VII. CONCLUSION
This paper describes the development and integration of a sorting system with a vision system. The developed image processing algorithms identify all the deep color contami-nants and most of the white and light color contamicontami-nants. The presented synchronous interrupt data transmission mode based on the Windows 2000 operating system can successfully complete the sorting task. This method is also applicable to other AVI applications, where a control task is required. Fol-lowing the successful integration of the sorting system with the vision system in the factory test rig, it was confirmed that the corresponding solenoid valves were correctly actuated at every occasion. The contaminants were efficiently removed in real time by the corresponding air knife/knives under such a conveyor speed of about 20 m/min and the camera line scan rate about 800 lines/s. This indicates that a faster PC with Windows 2000 or Windows NT operating system could easily complete both image acquisition, processing, and sorting tasks in parallel. It has also been shown that as a result of using a circular buffer, the actuators (the solenoid valve array in the application) can be located remotely from the camera, which greatly increases the range of applications in which this type of system will be needed.
APPENDIX
void CALLBACK ProcessInterrupt (short h, WPARAM wParam, ULONG lParam)
{ //Send the first data in the circular buffer
DIOsetDataEx (hboard, PPIX, 0, *bufferout);
;
> > >TCsetGate (hboard, Z2, 1, GAT_VCC); > > >TCsetMode (hboard, Z2, 1, 2);
> > >TCsetCount (hboard, Z2, 1, 1024); > > >TCsetUserInterrupt(hboard,
ProcessInterruptz2, 0,0,0,0,0,0); > >bufferout++; }
{ if
> > > > > > ;
> > > >TCsetMode(hboard, Z2, 1, 0); > > > > > >TCsetCount(hboard,Z2,1,2); > > > > > > > ;
> > > > > > >return; }
//Sending subsequent data in the circular buffer
>DIOsetDataEx(hboard,PPIX, 0, *bufferout);
> > > > > ; > > > > >bufferout++; if
> > > >{ TCsetCount(hboard, Z2,1,1024); > > > > > > > > ; }
>if
> > > > > > > ; }
ACKNOWLEDGMENT
The authors want to thanks C. Mcburney and J. Mundh for their technical support, as well as the help and advice of their U.K. collaborators: Buckfast Spinning, British Wool Marketing Board, the Confederation of British Wool Textiles, the Dawson Group, Haworth Scouring Company, Victoria Carpets, Thomas Chadwick & Sons, and Wira Instrumentation Ltd.
REFERENCES
[1] N. H. Gillian, “Non-wool contamination in carbonised wool,” CSIRO, Victoria, Australia, G Report G73, pp. 1–3, Sep. 1992.
[2] S. Hutchinson, G. D. Hager, and P. I. Corke, “A tutorial on visual servo control,”IEEE Trans. Robot. Autom., vol. 12, no. 5, pp. 651–670, Oct. 1996.
[3] R. Kelly, R. Carelli, O. Naisi, B. Kuchen, and F. Reyes, “Stable vi-sual servoing of camera-in-hand robotic systems,”IEEE/ASME Trans. Mechatronics, vol. 5, no. 1, pp. 39–48, Mar. 2000.
[4] S. R. Duncan, “Two-dimensional control systems: Learning from imple-mentations,”J. Electron. Imaging, vol. 10, no. 3, pp. 661–668, 2001. [5] A. C. Legrand, P. Suzeau, E. Renier, F. Truchetet, P. Gorria, and F.
Meri-audeau, “Machine vision systems in the metallurgy industry,”J. Elec-tron. Imaging, vol. 10, no. 1, pp. 274–282, 2001.
[6] R. Deloughry, E. Pickup, and P. Ponnapalli, “Closed loop control of a pneumatic conveying system using tomographic imaging,”J. Electron. Imaging, vol. 10, no. 3, pp. 653–660, 2001.
[7] N. K. H. Tang, J. F. Pickering, and J. M. Freeman, “An investigation into the control of brush yarn properties: The application of machine vision and knowledge-based systems, Part II: The machine vision system,”J. Textile Inst., vol. 84, no. 2, pp. 166–175, 1993.
[8] C.-H. V. Shih, N. Sherkat, and P. Thomas, “An automatic lace trimming process using real-time vision,”Real-Time Imaging, no. 2, pp. 117–130, 1996.
[9] G. M. Abbott, “An automated color sorting device for wool and other fibers,”Textile Res. J., vol. 65, no. 6, pp. 331–338, 1995.
[10] L. V. Langenhove, R. Habets, and J. Priniotakies,Cotton Fibre Free of Contaminants. Huddersfield, U.K.: Wool Textile Congress on Natural and Natural Polymer Fibres, 1997, pp. 231–239.
[11] L. S. Schilichter and L. C. Farber, “A new system for the effective control of foreign fibres,”ITB Int. Textile Bull., no. 3, pp. 48–50, 2000. [12] A. Brearley and J. A. Iredale,The Worsted Industry, 2nd ed. Leeds,
U.K.: Wira, The Research and Services Centre for Textiles, Carpets and Clothing, 1980, p. 35; pp. 35–45; pp. 67–69.
304 IEEE/ASME TRANSACTIONS ON MECHATRONICS, VOL. 10, NO. 3, JUNE 2005
[14] L. Zhang, Z. Su, T. King, A. Dehghani, and B. Greenwood, “Mecha-tronics and machine vision for removing contaminants from wool,” in
Proc. 8th Int. Forum on Mechatronics 2002, Enchede, The Netherlands, June 24–26, 2002, pp. 899–908.
[15] L. Zhang, A. Dehghani, T. King, Z. Su, and B. Greenwood, “Identifica-tion of white contaminants and their removal from wool fibres,” inProc. SPIE-IS&T Electronic Imaging, Presented in Mach. Vis. Applic. Ind. In-spection XI on 15th IS&T/SPIE Symp. Electronic Imaging: Science & Technology, vol. 5011, SPIE, Jan. 22–23, 2003, pp. 22–31.
[16] M. Catherwood, “Printer buffer,”Electron. Wirel. World, pp. 37–39, July 1985.
[17] A. Clements,The Principles of Computer Hardware, 3rd ed. Oxford, U.K.: Oxford Univ. Press, 2000, p. 407.
[18] M. Timmerman and J. C. Monfred, “Windows NT real-time extensions: An overview,”Real-Time Mag., vol. 97-2, pp. 14–24, May 2002. [19] Manual of PCI215 Programmable Digital Input/Output and
Counter/Timer Board Amplicon Liveline Ltd., Sussex, U.K., 2001, pp. 1–23.
[20] “Inside NT’s interrupt handling,”Windows & Net Mag., [Online]. In-stant Doc #298, p. 2, Nov. 1997 [Accessed May 14, 2002].
Liwei Zhangwas born in Shandong, China. She re-ceived the B.E. degree in industrial electrical engi-neering from the Department of Automation, Tianjin Polytechnic University, Tianjin, China, and the Ph.D. degree in mechatronics and machine vision from the School of Design and School of Mechanical Engi-neering, University of Leeds, Leeds, U.K., in 1995 and 2004, respectively.
Her research interests focus on automated visual inspection and microprocessor/microcon-troller-based real-time control.
Abbas Dehghanireceived the B.Sc. degree in tex-tile engineering from AmirKabir University, Tehran, Iran, the M.Sc. degree in fibre science and technology from University of Leeds, the B.Sc. degree in elec-tronic engineering from Leeds Polytechnic; the M.Sc. degree in digital systems engineering from UMIST; and the Ph.D. degree in auto-levelling systems from University of Leeds.
He has been working in the School of Textiles and Design since 1992 as a researcher and since 1999 as a lecturer, being involved in a number of mecha-tronic research and product development projects in the areas of machine vision and control, image processing, and material testing instrumentation. He was in charge of Mechatronics Research Group in the School of Design prior to joining the School of Mechanical Engineering in 2004 in the University of Leeds. He is currently a lecturer in this school, responsible for mechatronics teaching and research. His research interests include smart sensors and actuators, machine in-telligence and machine vision, mechatronics of digital jet printing, mechatronic systems applications in medical, health care, and assistive technologies.
Zhenwei Su graduated from the Department of Mechanical Engineering in Xian Jiaotong Univer-sity, Xian, China, in 1982, and then received the Doctoral degree in the Department of Mechanical Engineering, Sichuan University, Chengdu, China, in 1996.
He is currently a Research Fellow in the School of Design, Leeds University, United Kingdom. Since 1982, he has been engaged in the research area of computer-aided measurement and analysis, including sensor selection, data acquisition and processing, image acquisition and processing, analysis of dynamic parameters of mechanical systems, and applications of artificial intelligence. His research covers the range of mechanical engineering, optical engineering, leather engineering, and textile engineering.
Tim King (M’95–SM’97) was born in London, England. He received the B.Sc. (Eng.) degree in mechanical engineering from King’s College, London; the M.Des. degree in industrial design from the Royal College of Art, London; and the Ph.D. degree in Surface Finish Measurement from Leicester Polytechnic, United Kingdom, in 1972, 1975, and 1981, respectively.
He is currently Honorary Professor of Mechanical Engineering at the University of Leeds, United Kingdom, having previously held the position of Professor of Textile Mechatronics at Leeds; Professor of Mechanical Engi-neering at the University of Birmingham, United Kingdom; and, before that, Senior Lecturer at Loughborough University. His research interests include machine vision for manufacturing and real-time control, and high-speed piezoelectric actuators.
Prof. King is a Fellow of the IMechE since 1995, and a Fellow of IEE, U.K., since 1995.
Barry Greenwoodreceived the B.Sc. (Eng.) and M.Phil. degrees in textile chemistry from the School of Textiles, University of Leeds, Leeds, United Kingdom, in 1964 and 1967, respectively.
He retired in 2004. His last position was as research officer in the School of Design, University of Leeds, Leeds, U.K. Previously, he held the posts of senior development officer, as well as technical liaison and training officer at the International Wool Secretariat. His research interests include the chemistry and engineering of wool processing.
Martin Levesley received the B.E. degree in mechanical engineering from Brunel University, London, U.K., in 1988, and the Ph.D. degree in non-linear dynamics from the University of Southampton, U.K., in 1992.